

Red and blue light in antitumor photodynamic therapy with chlorin-based photosensitizers: a comparative animal study assisted by optical imaging modalities
- PMID: 33680547
- PMCID: PMC7901330
- DOI: 10.1364/BOE.411518
Red and blue light in antitumor photodynamic therapy with chlorin-based photosensitizers: a comparative animal study assisted by optical imaging modalities
Abstract
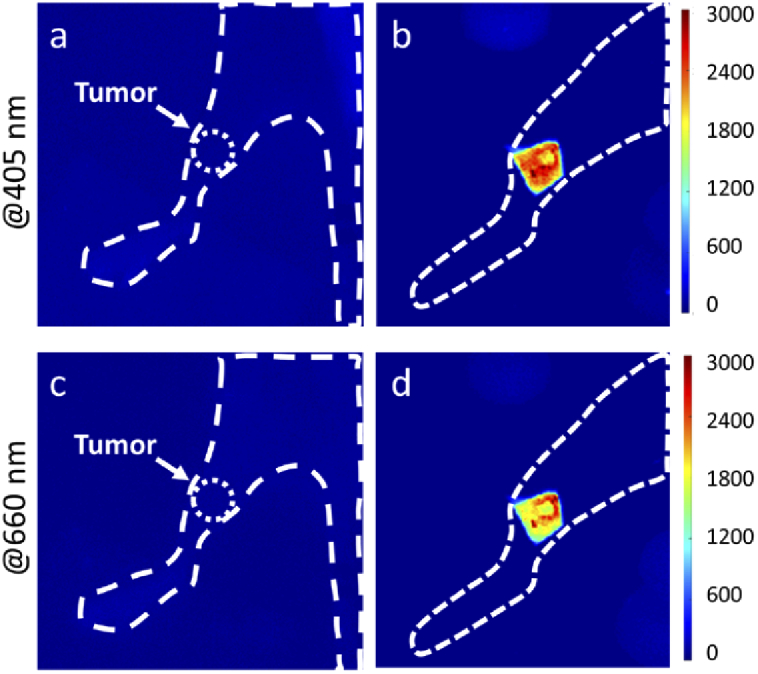
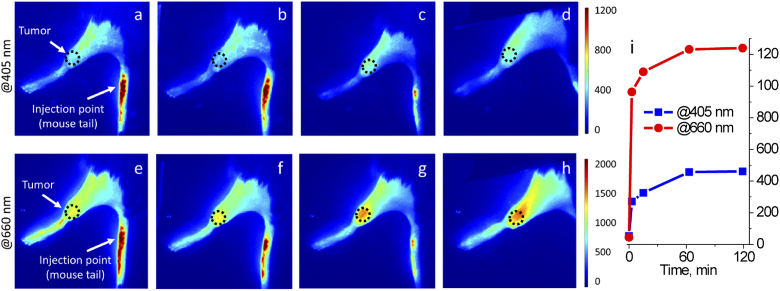
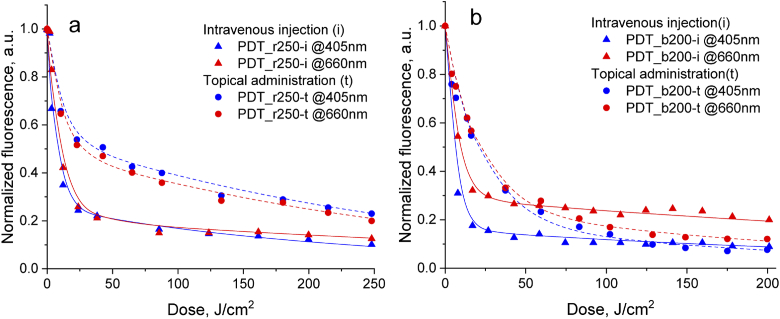
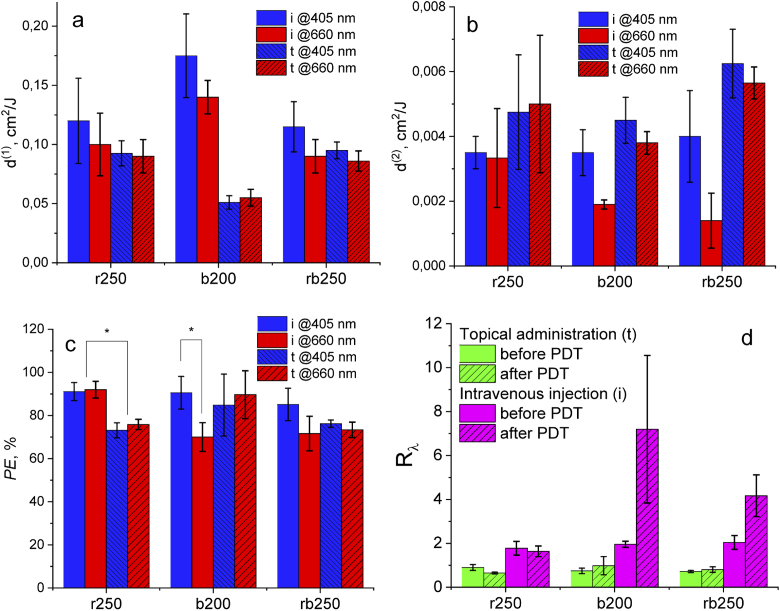
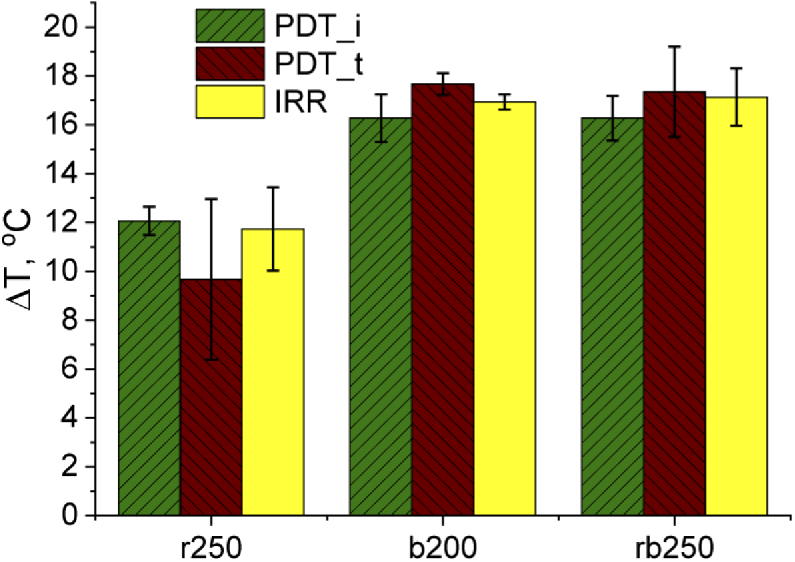
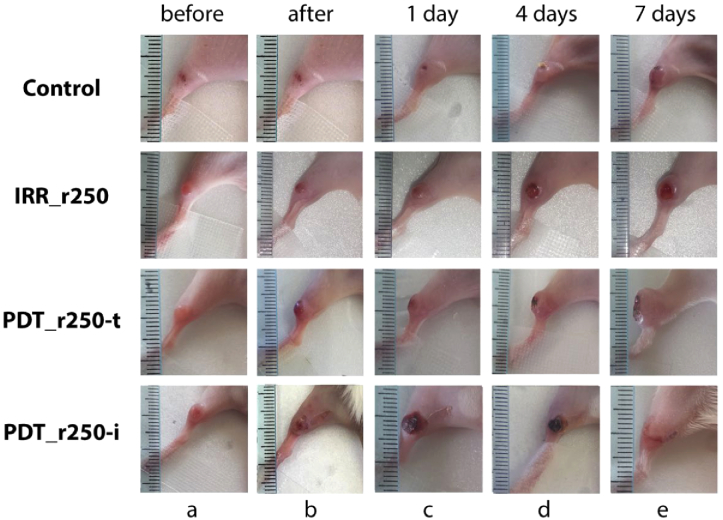
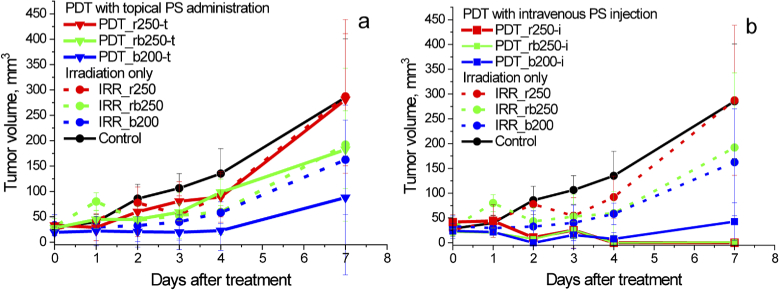
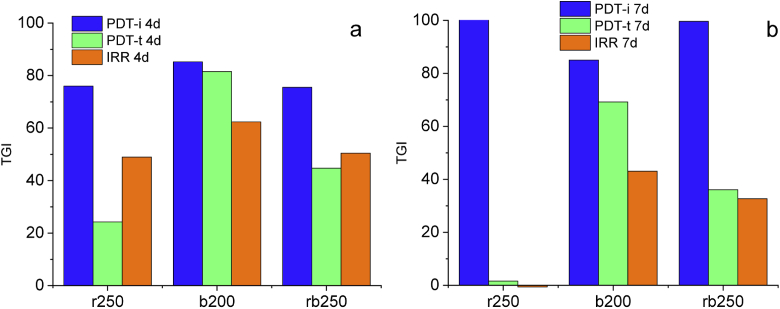
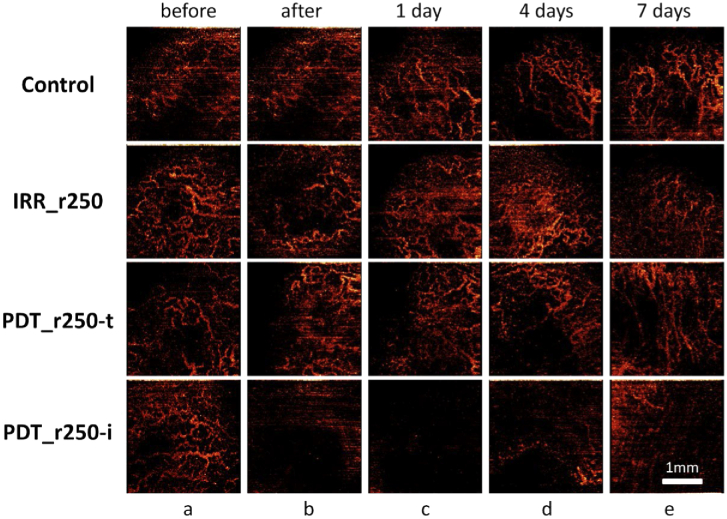
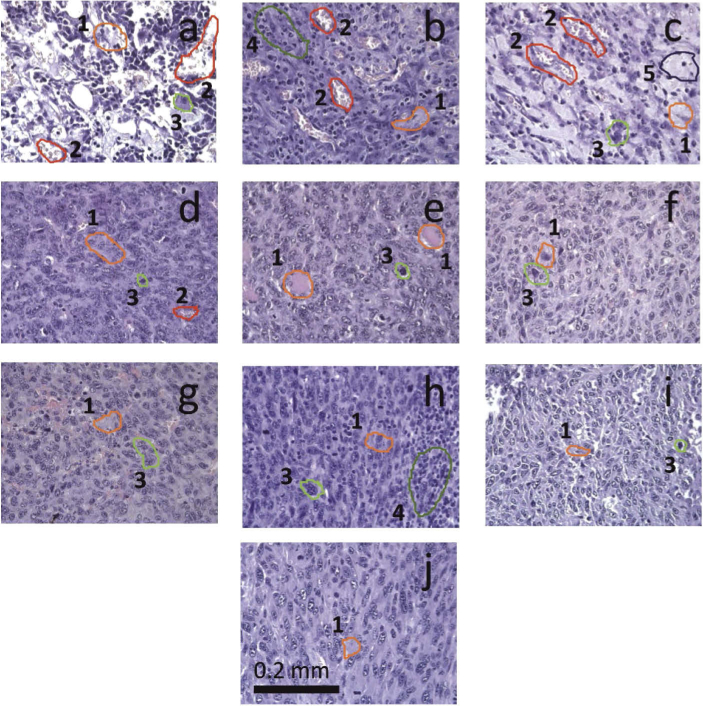
The goal of this study is a comparative analysis of the efficiency of the PDT protocols for CT26 tumor model treatment in Balb/c mice employing red and blue light with both topical and intravenous administration of chlorin-based photosensitizers (PSs). The considered protocols include the doses of 250 J/cm2 delivered at 660 nm, 200 J/cm2 delivered at 405 nm, and 250 J/cm2 delivered at both wavelengths with equal energy density contribution. Dual-wavelength fluorescence imaging was employed to estimate both photobleaching efficiency, typical photobleaching rates and the procedure impact depth, while optical coherence tomography with angiography modality (OCT-A) was employed to monitor the tumor vasculature response for up to 7 days after the procedure with subsequent histology inspection. Red light or dual-wavelength PDT regimes with intravenous PS injection were demonstrated to provide the most pronounced tumor response among all the considered cases. On the contrary, blue light regimes were demonstrated to be most efficient among topical application and irradiation only regimes. Tumor size dynamics for different groups is in good agreement with the tumor response predictions based on OCT-A taken in 24h after exposure and the results of histology analysis performed in 7 days after the exposure.
© 2021 Optical Society of America under the terms of the OSA Open Access Publishing Agreement.
Conflict of interest statement
The authors have declared that no competing interest exists.
Figures
Similar articles
-
Comparative analysis of single- and dual-wavelength photodynamic therapy regimes with chlorin-based photosensitizers: animal study.J Biomed Opt. 2019 Dec;25(6):1-17. doi: 10.1117/1.JBO.25.6.063804. J Biomed Opt. 2019. PMID: 31872580 Free PMC article.
-
Dual-Wavelength Fluorescence Monitoring of Photodynamic Therapy: From Analytical Models to Clinical Studies.Cancers (Basel). 2021 Nov 19;13(22):5807. doi: 10.3390/cancers13225807. Cancers (Basel). 2021. PMID: 34830963 Free PMC article.
-
Measurement of Cyanine Dye Photobleaching in Photosensitizer Cyanine Dye Conjugates Could Help in Optimizing Light Dosimetry for Improved Photodynamic Therapy of Cancer.Molecules. 2018 Jul 24;23(8):1842. doi: 10.3390/molecules23081842. Molecules. 2018. PMID: 30042350 Free PMC article.
-
Potential of Photodynamic Therapy Based on Sugar-Conjugated Photosensitizers.J Clin Med. 2021 Feb 18;10(4):841. doi: 10.3390/jcm10040841. J Clin Med. 2021. PMID: 33670714 Free PMC article. Review.
-
Critical Overview of the Use of Ru(II) Polypyridyl Complexes as Photosensitizers in One-Photon and Two-Photon Photodynamic Therapy.Acc Chem Res. 2017 Nov 21;50(11):2727-2736. doi: 10.1021/acs.accounts.7b00180. Epub 2017 Oct 23. Acc Chem Res. 2017. PMID: 29058879 Review.
Cited by
-
Research Progress of Photothermal Nanomaterials in Multimodal Tumor Therapy.Front Oncol. 2022 Jul 6;12:939365. doi: 10.3389/fonc.2022.939365. eCollection 2022. Front Oncol. 2022. PMID: 35898892 Free PMC article. Review.
-
Combined Fluorescence and Optoacoustic Imaging for Monitoring Treatments against CT26 Tumors with Photoactivatable Liposomes.Cancers (Basel). 2021 Dec 31;14(1):197. doi: 10.3390/cancers14010197. Cancers (Basel). 2021. PMID: 35008362 Free PMC article.
-
Effects of Photodynamic Therapy on Tumor Metabolism and Oxygenation Revealed by Fluorescence and Phosphorescence Lifetime Imaging.Int J Mol Sci. 2024 Jan 30;25(3):1703. doi: 10.3390/ijms25031703. Int J Mol Sci. 2024. PMID: 38338976 Free PMC article.
-
Special Chimeric Antigen Receptor (CAR) Modifications of T Cells: A Review.Front Oncol. 2022 Mar 22;12:832765. doi: 10.3389/fonc.2022.832765. eCollection 2022. Front Oncol. 2022. PMID: 35392217 Free PMC article. Review.
-
Post-Operational Photodynamic Therapy of the Tumor Bed: Comparative Analysis for Cold Knife and Laser Scalpel Resection.Biomedicines. 2024 Jan 26;12(2):0. doi: 10.3390/biomedicines12020291. Biomedicines. 2024. PMID: 38397893 Free PMC article.
References
-
- Jansen M. H. E., Koekelkoren F. H. J., Nelemans P. J., Arits A., Roozeboom M. H., Kelleners-Smeets N. W. J., Mosterd K., “Comparison of long-term cosmetic outcomes for different treatments of superficial basal cell carcinoma,” J. Am. Acad. Dermatol. 79(5), 961–964 (2018).10.1016/j.jaad.2018.04.053 - DOI - PubMed
-
- Svanberg K., Andersson T., Killander D., Wang I., Stenram U., Andersson-Engels S., Berg R., Johansson J., Svanberg S., “Photodynamic therapy of non-melanoma malignant tumours of the skin using topical delta-amino levulinic acid sensitization and laser irradiation,” Br. J. Dermatol. 130(6), 743–751 (1994).10.1111/j.1365-2133.1994.tb03412.x - DOI - PubMed
LinkOut - more resources
Full Text Sources
Other Literature Sources