

Malignant and benign thyroid nodule differentiation through the analysis of blood plasma with terahertz spectroscopy
- PMID: 33680557
- PMCID: PMC7901318
- DOI: 10.1364/BOE.412715
Malignant and benign thyroid nodule differentiation through the analysis of blood plasma with terahertz spectroscopy
Abstract
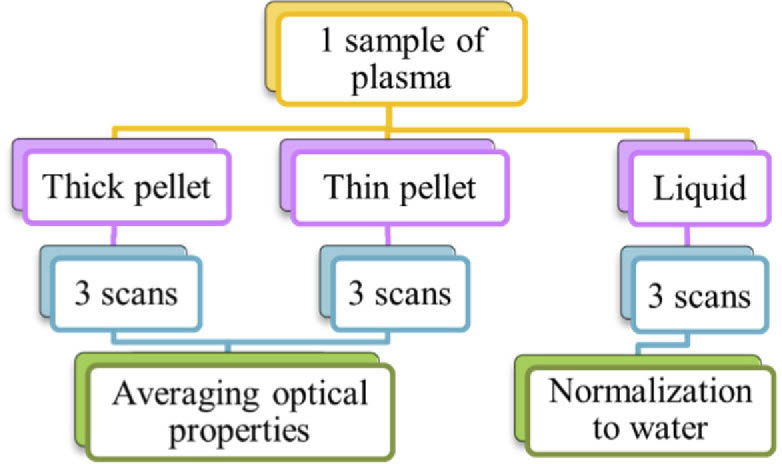
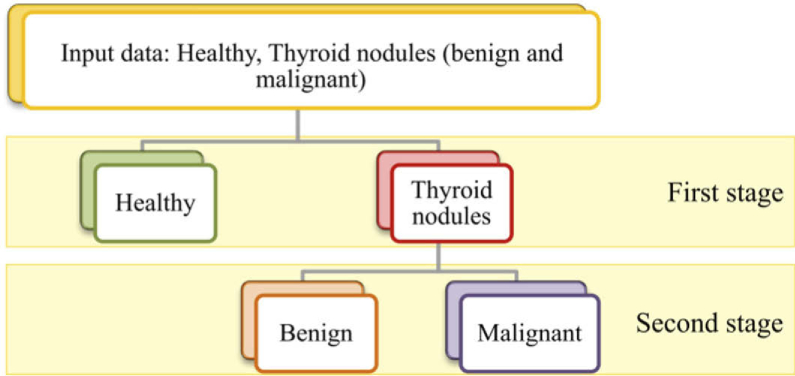
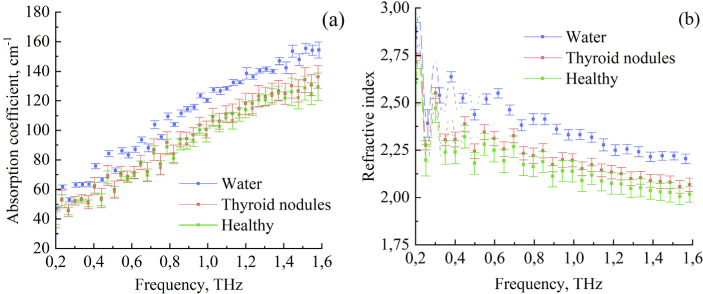
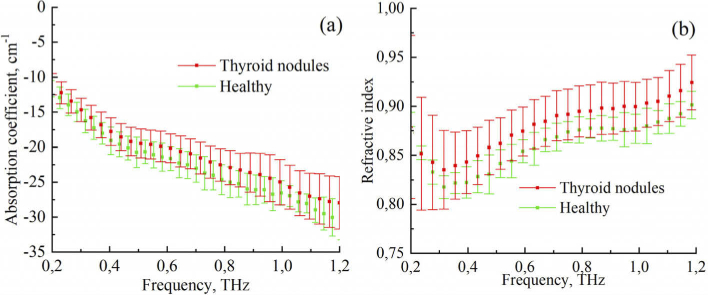
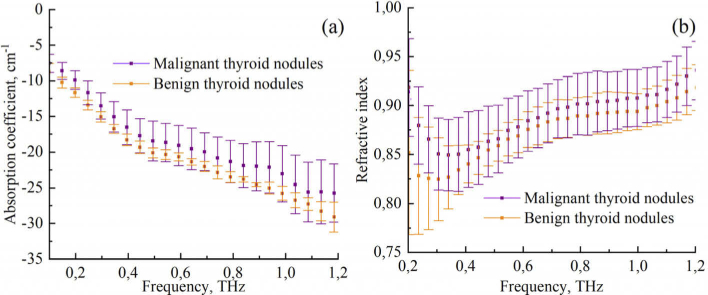
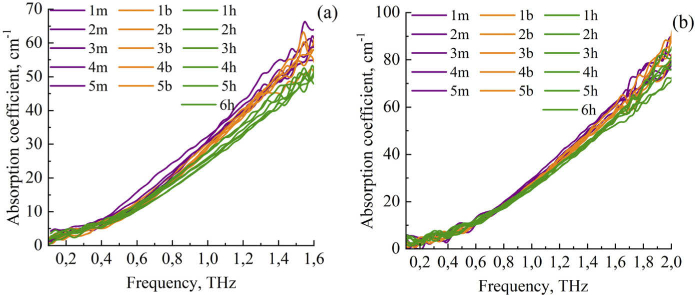
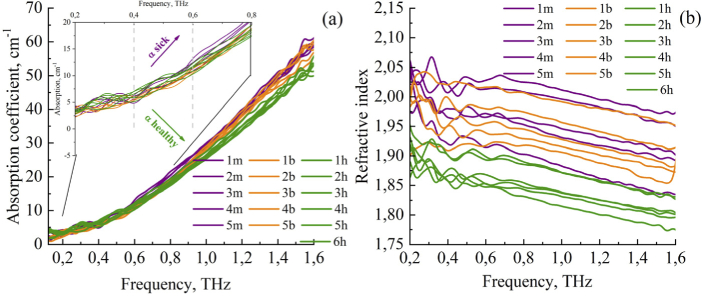
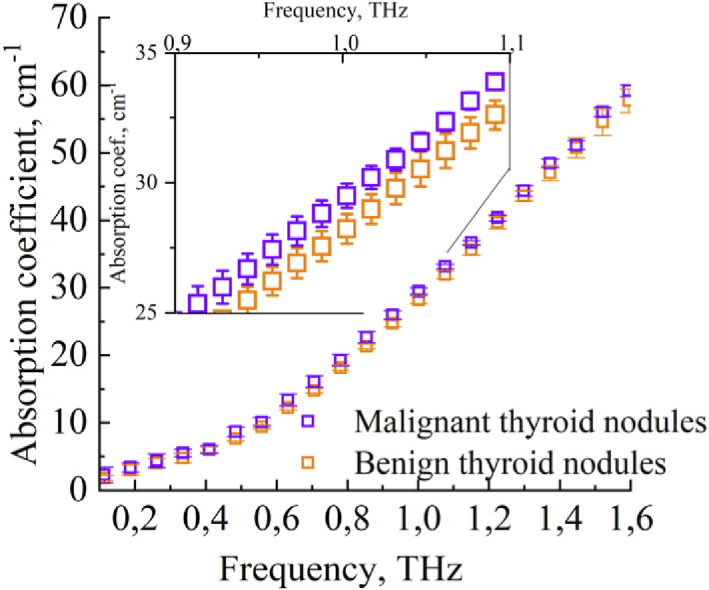
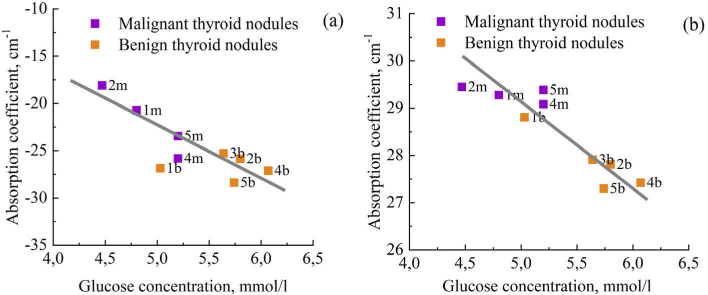
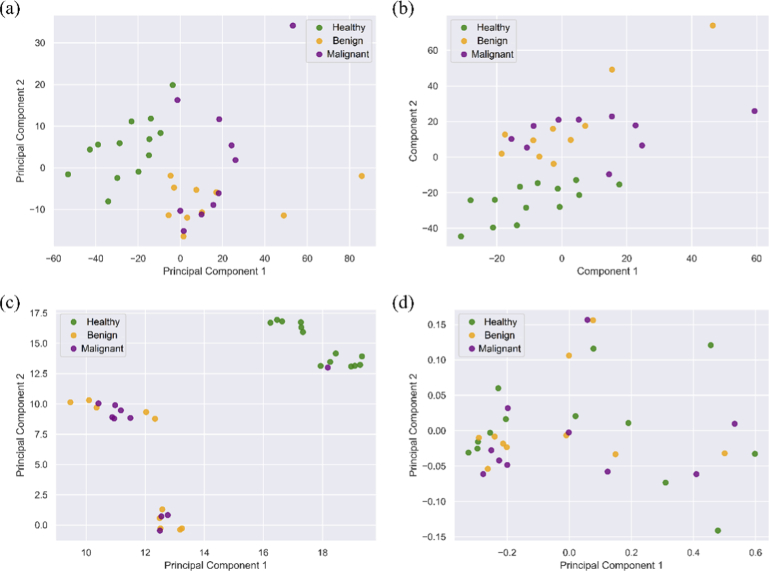
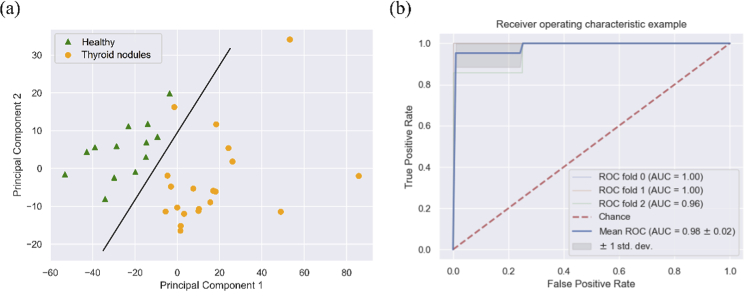
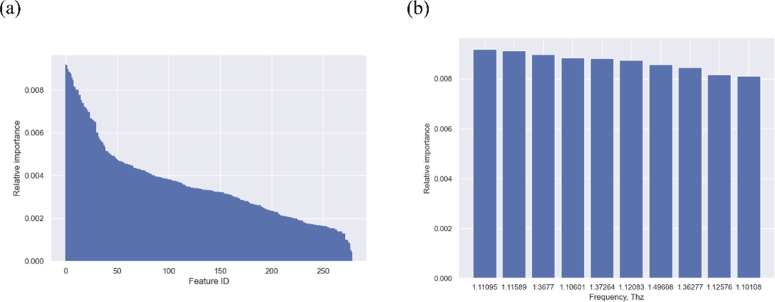
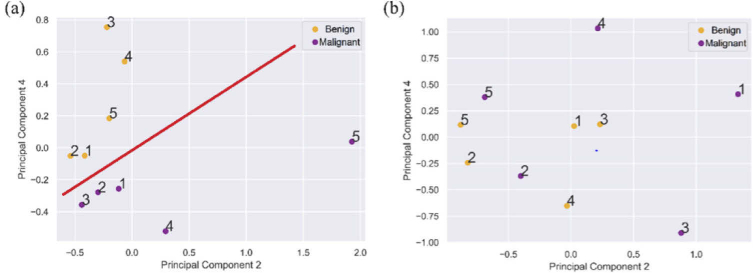
The liquid and lyophilized blood plasma of patients with benign or malignant thyroid nodules and healthy individuals were studied by terahertz (THz) time-domain spectroscopy and machine learning. The blood plasma samples from malignant nodule patients were shown to have higher absorption. The glucose concentration and miRNA-146b level were correlated with the sample's absorption at 1 THz. A two-stage ensemble algorithm was proposed for the THz spectra analysis. The first stage was based on the Support Vector Machine with a linear kernel to separate healthy and thyroid nodule participants. The second stage included additional data preprocessing by Ornstein-Uhlenbeck kernel Principal Component Analysis to separate benign and malignant thyroid nodule participants. Thus, the distinction of malignant and benign thyroid nodule patients through their lyophilized blood plasma analysis by terahertz time-domain spectroscopy and machine learning was demonstrated.
© 2021 Optical Society of America under the terms of the OSA Open Access Publishing Agreement.
Conflict of interest statement
The authors declare that there are no conflicts of interest.
Figures
Similar articles
-
Terahertz spectroscopy of diabetic and non-diabetic human blood plasma pellets.J Biomed Opt. 2021 Feb;26(4):043006. doi: 10.1117/1.JBO.26.4.043006. J Biomed Opt. 2021. PMID: 33580640 Free PMC article.
-
[Discrimination of varieties of borneol using terahertz spectra based on principal component analysis and support vector machine].Guang Pu Xue Yu Guang Pu Fen Xi. 2014 Dec;34(12):3235-40. Guang Pu Xue Yu Guang Pu Fen Xi. 2014. PMID: 25881415 Chinese.
-
Filter-Membrane-Based Ultrafiltration Coupled with Surface-Enhanced Raman Spectroscopy for Potential Differentiation of Benign and Malignant Thyroid Tumors from Blood Plasma.Int J Nanomedicine. 2020 Apr 1;15:2303-2314. doi: 10.2147/IJN.S233663. eCollection 2020. Int J Nanomedicine. 2020. PMID: 32280222 Free PMC article.
-
Identification of coumarin-based food additives using terahertz spectroscopy combined with manifold learning and improved support vector machine.J Food Sci. 2022 Mar;87(3):1108-1118. doi: 10.1111/1750-3841.16064. Epub 2022 Feb 4. J Food Sci. 2022. PMID: 35122257
-
Machine Learning Techniques for THz Imaging and Time-Domain Spectroscopy.Sensors (Basel). 2021 Feb 8;21(4):1186. doi: 10.3390/s21041186. Sensors (Basel). 2021. PMID: 33567605 Free PMC article. Review.
Cited by
-
Measurement of tissue optical properties in a wide spectral range: a review [Invited].Biomed Opt Express. 2022 Dec 16;14(1):249-298. doi: 10.1364/BOE.479320. eCollection 2023 Jan 1. Biomed Opt Express. 2022. PMID: 36698664 Free PMC article. Review.
-
Terahertz technology and its applications in head and neck diseases.iScience. 2023 Jun 7;26(7):107060. doi: 10.1016/j.isci.2023.107060. eCollection 2023 Jul 21. iScience. 2023. PMID: 37534152 Free PMC article. Review.
-
Dielectric property measurement of human sweat using attenuated total reflection terahertz time domain spectroscopy.Biomed Opt Express. 2022 Aug 4;13(9):4572-4582. doi: 10.1364/BOE.467450. eCollection 2022 Sep 1. Biomed Opt Express. 2022. PMID: 36187269 Free PMC article.
-
Terahertz dielectric spectroscopy and solid immersion microscopy of ex vivo glioma model 101.8: brain tissue heterogeneity.Biomed Opt Express. 2021 Jul 27;12(8):5272-5289. doi: 10.1364/BOE.432758. eCollection 2021 Aug 1. Biomed Opt Express. 2021. PMID: 34513256 Free PMC article.
-
Cellular effects of terahertz waves.J Biomed Opt. 2021 Sep;26(9):090902. doi: 10.1117/1.JBO.26.9.090902. J Biomed Opt. 2021. PMID: 34595886 Free PMC article. Review.
References
LinkOut - more resources
Full Text Sources
Other Literature Sources