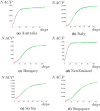
Possibility of long-termed prediction of NACPs and NADPs of COVID-19 in different countries and regions via tanh basic functions
- PMID: 33680710
- PMCID: PMC7926199
- DOI: 10.1007/s40435-021-00770-y
Possibility of long-termed prediction of NACPs and NADPs of COVID-19 in different countries and regions via tanh basic functions
Abstract
In this paper, we make long-termed prediction for numbers of accumulative confirmed patients (NACPs) and numbers of accumulative death patients (NADPs) of COVID-19 in different countries and regions by fitting method. We use hyperbolic tangent functions as basic functions for the fitting method. The results indicate that it is possible to make long-termed prediction for NACPs and NADPs of COVID-19 by using a small amount of data. And we can estimate the arrival times of the plateau phases of COVID-19 in some countries and regions. It shows that our method is simple (model-free) and very effective in long-termed prediction of NACPs and NADPs with small data.
Keywords: COVID-19; Long-termed prediction; NACP; NADP; Plateau phase.
© The Author(s), under exclusive licence to Springer-Verlag GmbH, DE part of Springer Nature 2021.
Conflict of interest statement
Conflict of interestThe authors declare that there is no conflict of interest regarding the publication of this paper.
Figures


Similar articles
-
Prediction of numbers of the accumulative confirmed patients (NACP) and the plateau phase of 2019-nCoV in China.Cogn Neurodyn. 2020 Jun;14(3):411-424. doi: 10.1007/s11571-020-09588-4. Epub 2020 Apr 27. Cogn Neurodyn. 2020. PMID: 32341718 Free PMC article.
-
Correction to: Prediction of numbers of the accumulative confirmed patients (NACP) and the plateau phase of 2019-nCoV in China.Cogn Neurodyn. 2021 Aug;15(4):741. doi: 10.1007/s11571-020-09657-8. Epub 2020 Dec 18. Cogn Neurodyn. 2021. PMID: 33354247 Free PMC article.
-
Prediction of the COVID-19 Pandemic for the Top 15 Affected Countries: Advanced Autoregressive Integrated Moving Average (ARIMA) Model.JMIR Public Health Surveill. 2020 May 13;6(2):e19115. doi: 10.2196/19115. JMIR Public Health Surveill. 2020. PMID: 32391801 Free PMC article.
-
Impact of facility type on survival after pancreatoduodenectomy for small pancreatic adenocarcinoma (≤ 2 cm).Am J Surg. 2021 Jul;222(1):145-152. doi: 10.1016/j.amjsurg.2020.10.022. Epub 2020 Oct 20. Am J Surg. 2021. PMID: 33131577
-
On the approximation of functions by tanh neural networks.Neural Netw. 2021 Nov;143:732-750. doi: 10.1016/j.neunet.2021.08.015. Epub 2021 Aug 19. Neural Netw. 2021. PMID: 34482172
Cited by
-
Long-term prediction of the sporadic COVID-19 epidemics induced by -virus in China based on a novel non-autonomous delayed SIR model.Eur Phys J Spec Top. 2022;231(18-20):3649-3662. doi: 10.1140/epjs/s11734-022-00622-6. Epub 2022 Jul 4. Eur Phys J Spec Top. 2022. PMID: 35813987 Free PMC article.
References
-
- Chen Y, Cheng J, Jiang Y, Liu K (2020) A time delay dynamical model for outbreak of 2019-nCoV and the parameter identification. arXiv:2002.00418 [q-bio.PE]
LinkOut - more resources
Full Text Sources
Other Literature Sources
