

Identifying Apoptosis-Related Transcriptomic Aberrations and Revealing Clinical Relevance as Diagnostic and Prognostic Biomarker in Hepatocellular Carcinoma
- PMID: 33680905
- PMCID: PMC7931692
- DOI: 10.3389/fonc.2020.519180
Identifying Apoptosis-Related Transcriptomic Aberrations and Revealing Clinical Relevance as Diagnostic and Prognostic Biomarker in Hepatocellular Carcinoma
Abstract
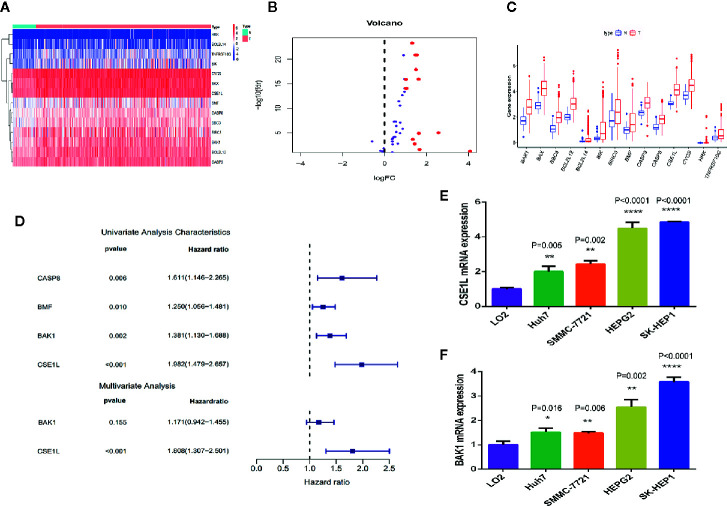
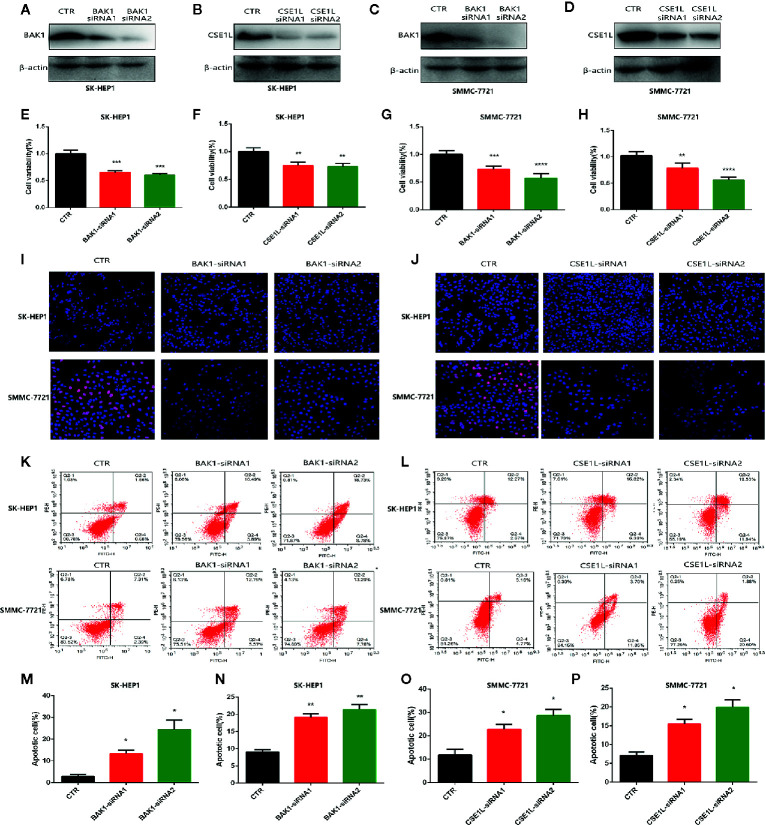
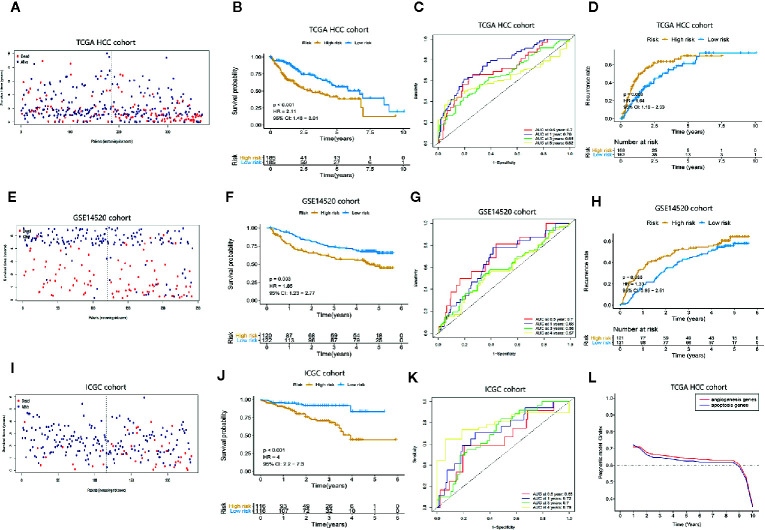
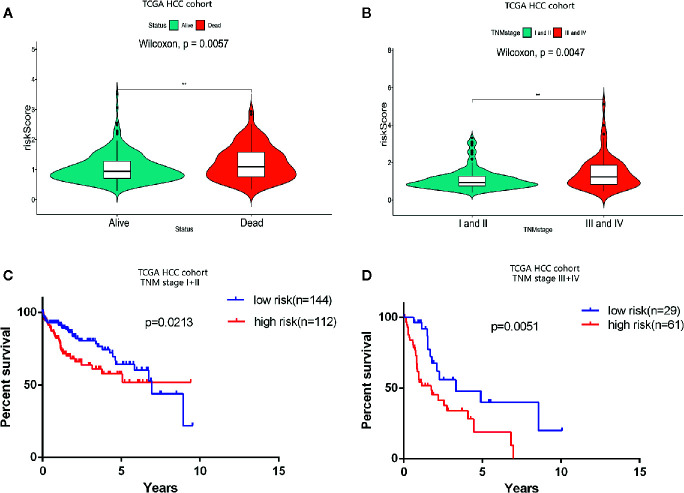
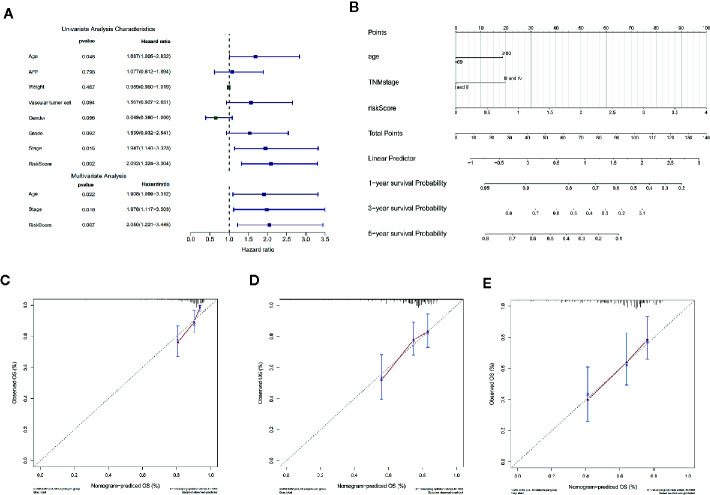
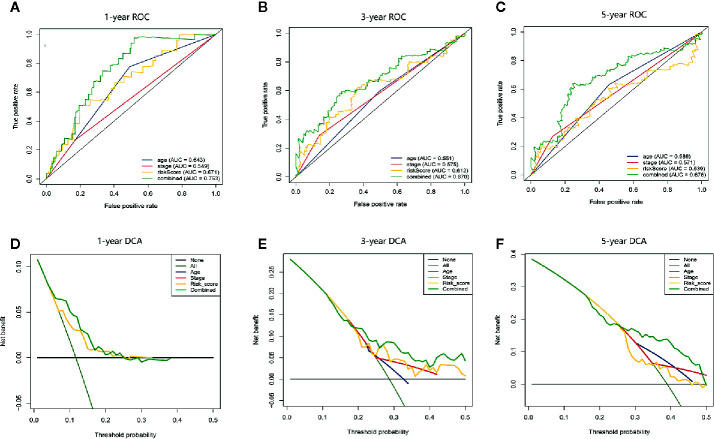
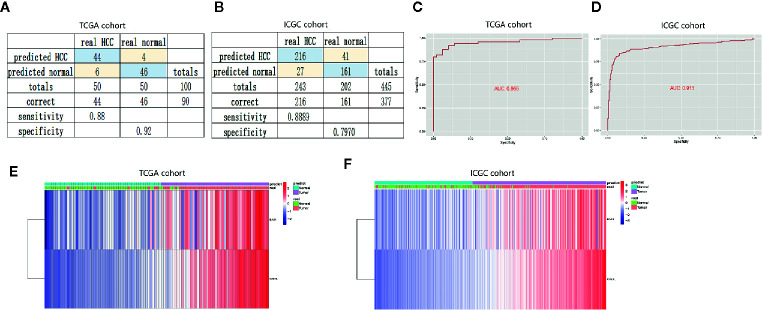
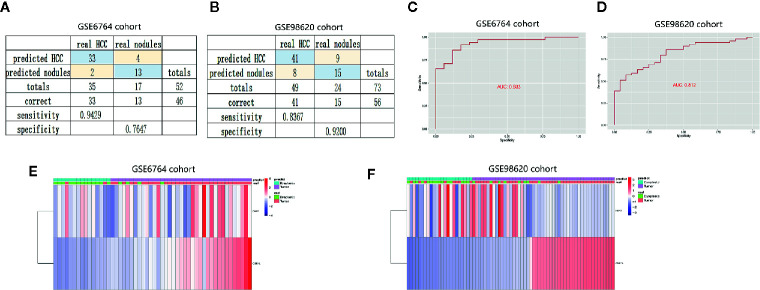
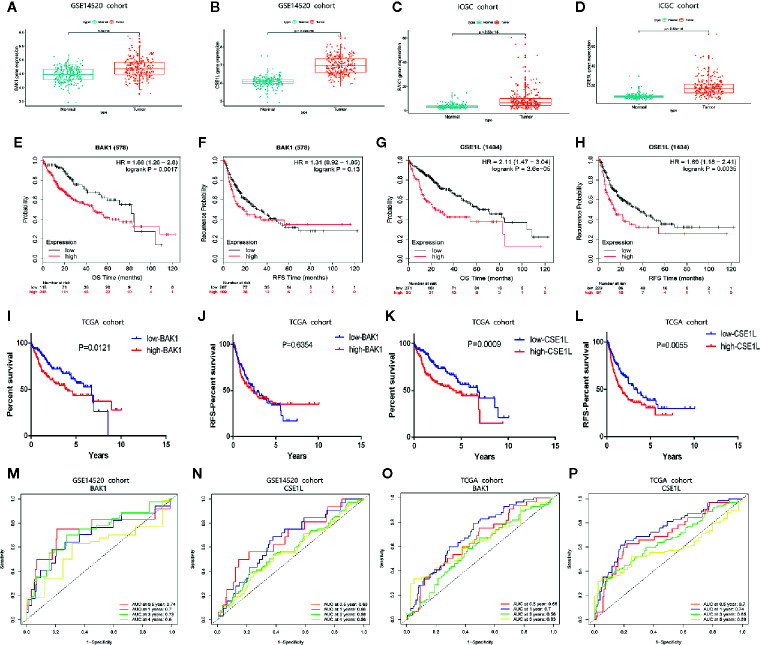
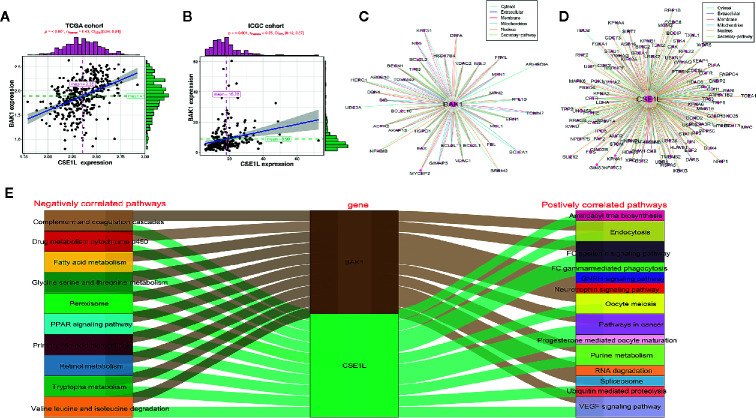
In view of the unsatisfactory treatment outcome of liver cancer under current treatment, where the mortality rate is high and the survival rate is poor, in this study we aimed to use RNA sequencing data to explore potential molecular markers that can be more effective in predicting diagnosis and prognosis of hepatocellular carcinoma. RNA sequencing data and corresponding clinical information were obtained from multiple databases. After matching with the apoptotic genes from the Deathbase database, 14 differentially expressed human apoptosis genes were obtained. Using univariate and multivariate Cox regression analyses, two apoptosis genes (BAK1 and CSE1L) were determined to be closely associated with overall survival (OS) in HCC patients. And subsequently experiments also validated that knockdown of BAK1 and CSE1L significantly inhibited cell proliferation and promoted apoptosis in the HCC. Then the two genes were used to construct a prognostic signature and diagnostic models. The high-risk group showed lower OS time compared to low-risk group in the TCGA cohort (P < 0.001, HR = 2.11), GSE14520 cohort (P = 0.003, HR = 1.85), and ICGC cohort (P < 0.001, HR = 4). And the advanced HCC patients showed higher risk score and worse prognosis compared to early-stage HCC patients. Moreover, the prognostic signature was validated to be an independent prognostic factor. The diagnostic models accurately predicted HCC from normal tissues and dysplastic nodules in the training and validation cohort. These results indicated that the two apoptosis-related signature effectively predicted diagnosis and prognosis of HCC and may serve as a potential biomarker and therapeutic target for HCC.
Keywords: apoptosis; diagnosis; hepatocellular carcinoma; overall survival; prognosis; relapse-free survival.
Copyright © 2021 Zhu, Tang, Lv, Meng, Weng, Zhang, Li, Fan, Zheng, Fang, Xu and Ji.
Conflict of interest statement
The authors declare that the research was conducted in the absence of any commercial or financial relationships that could be construed as a potential conflict of interest.
Figures
Similar articles
-
Identification of a five-long non-coding RNA signature to improve the prognosis prediction for patients with hepatocellular carcinoma.World J Gastroenterol. 2018 Aug 14;24(30):3426-3439. doi: 10.3748/wjg.v24.i30.3426. World J Gastroenterol. 2018. PMID: 30122881 Free PMC article.
-
Predictive Models for HCC Prognosis, Recurrence Risk, and Immune Infiltration Based on Two Exosomal Genes: MYL6B and THOC2.J Inflamm Res. 2021 Aug 24;14:4089-4109. doi: 10.2147/JIR.S315957. eCollection 2021. J Inflamm Res. 2021. PMID: 34466015 Free PMC article.
-
Establishment of a Prognostic Model for Hepatocellular Carcinoma Based on Endoplasmic Reticulum Stress-Related Gene Analysis.Front Oncol. 2021 May 21;11:641487. doi: 10.3389/fonc.2021.641487. eCollection 2021. Front Oncol. 2021. PMID: 34094926 Free PMC article.
-
A 4-gene prognostic signature predicting survival in hepatocellular carcinoma.J Cell Biochem. 2019 Jun;120(6):9117-9124. doi: 10.1002/jcb.28187. Epub 2018 Dec 23. J Cell Biochem. 2019. PMID: 30582205
-
A novel ferroptosis-related gene signature for clinically predicting recurrence after hepatectomy of hepatocellular carcinoma patients.Am J Cancer Res. 2022 May 15;12(5):1995-2011. eCollection 2022. Am J Cancer Res. 2022. PMID: 35693077 Free PMC article.
Cited by
-
Pyroptosis-related gene signature: A predictor for overall survival, immunotherapy response, and chemosensitivity in patients with pancreatic adenocarcinoma.Heliyon. 2023 Nov 28;9(12):e23004. doi: 10.1016/j.heliyon.2023.e23004. eCollection 2023 Dec. Heliyon. 2023. PMID: 38125471 Free PMC article.
-
Primary ovarian insufficiency associated with lenvatinib therapy in a patient with hepatocellular carcinoma: A case report.Oncol Lett. 2023 Aug 31;26(4):450. doi: 10.3892/ol.2023.14037. eCollection 2023 Oct. Oncol Lett. 2023. PMID: 37720675 Free PMC article.
-
Mitochondrial permeability transition drives the expression, identification and validation of necrosis-related genes in prognostic risk models of hepatocellular carcinoma.Transl Cancer Res. 2025 Feb 28;14(2):1037-1052. doi: 10.21037/tcr-24-1442. Epub 2025 Feb 26. Transl Cancer Res. 2025. PMID: 40104732 Free PMC article.
-
Non-Apoptotic Programmed Cell Death-Related Gene Signature Correlates With Stemness and Immune Status and Predicts the Responsiveness of Transarterial Chemoembolization in Hepatocellular Carcinoma.Front Cell Dev Biol. 2022 Apr 29;10:844013. doi: 10.3389/fcell.2022.844013. eCollection 2022. Front Cell Dev Biol. 2022. PMID: 35573678 Free PMC article.
-
Artificial Intelligence and Machine Learning Predicting Transarterial Chemoembolization Outcomes: A Systematic Review.Dig Dis Sci. 2025 Feb;70(2):533-542. doi: 10.1007/s10620-024-08747-5. Epub 2024 Dec 21. Dig Dis Sci. 2025. PMID: 39708260
References
LinkOut - more resources
Full Text Sources
Other Literature Sources