

Identification and Validation of a Novel Six-Gene Prognostic Signature of Stem Cell Characteristic in Colon Cancer
- PMID: 33680915
- PMCID: PMC7933554
- DOI: 10.3389/fonc.2020.571655
Identification and Validation of a Novel Six-Gene Prognostic Signature of Stem Cell Characteristic in Colon Cancer
Abstract
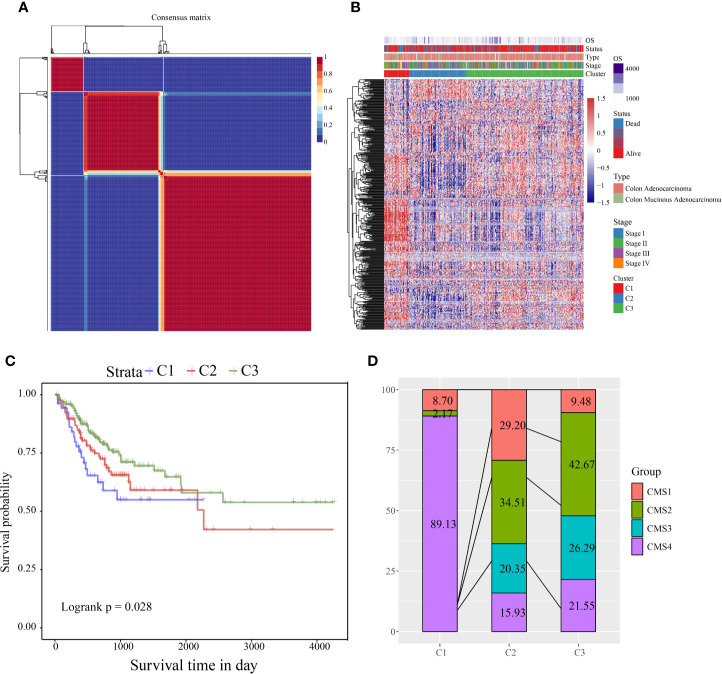
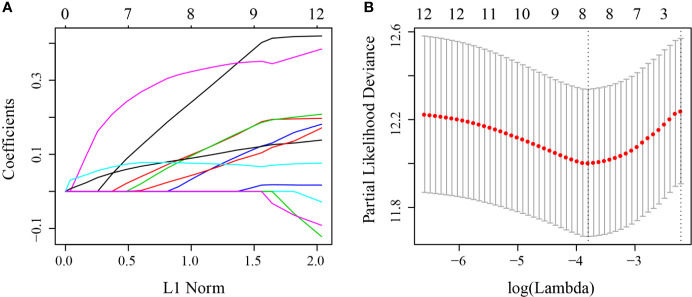
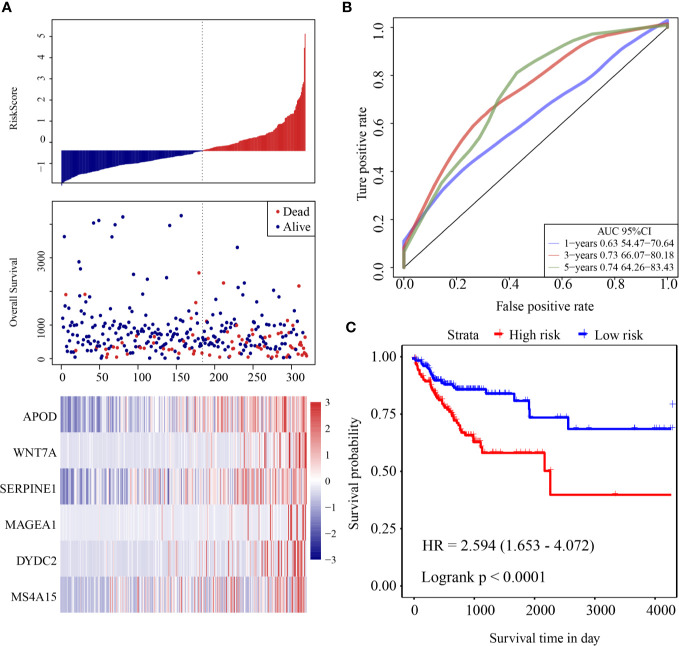
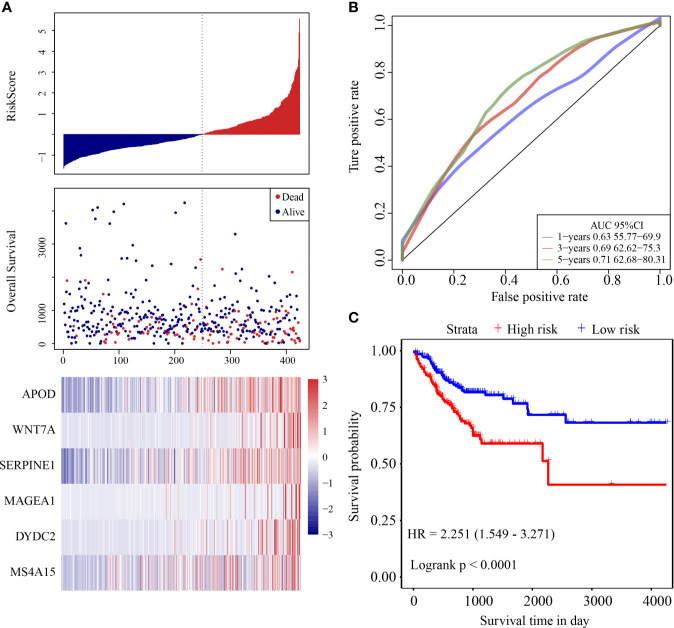
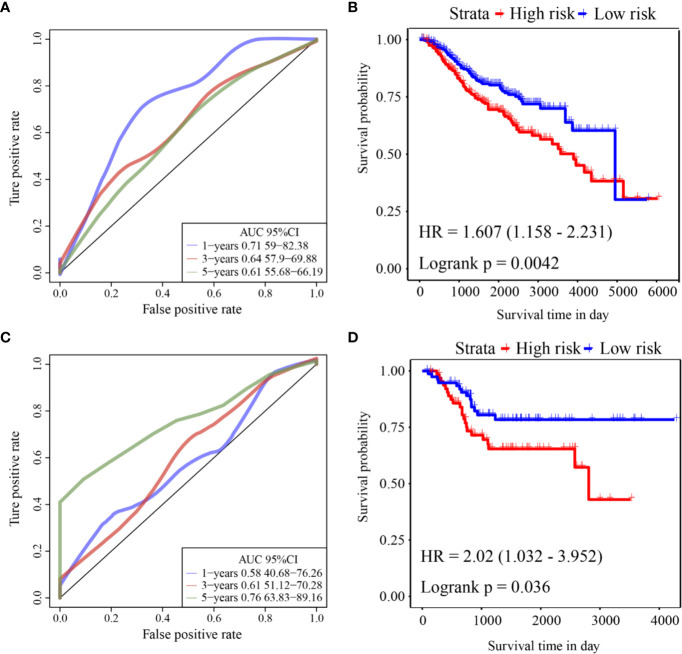
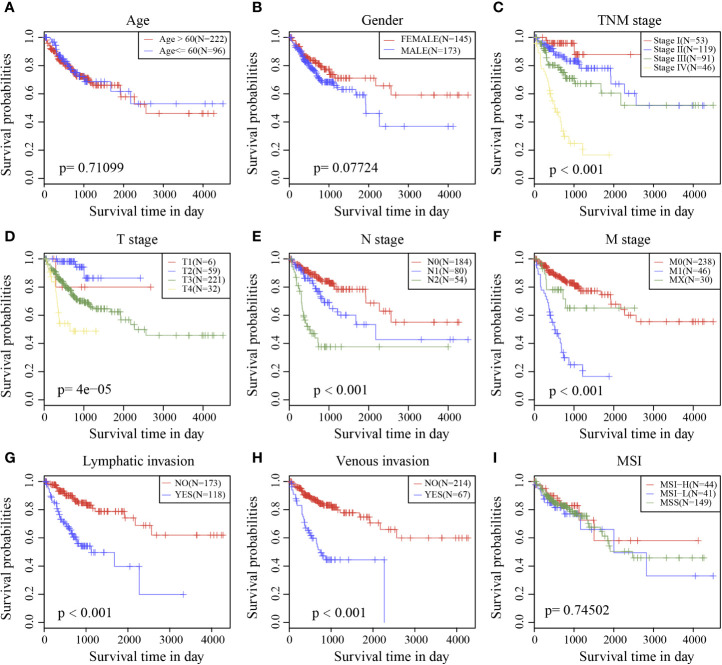
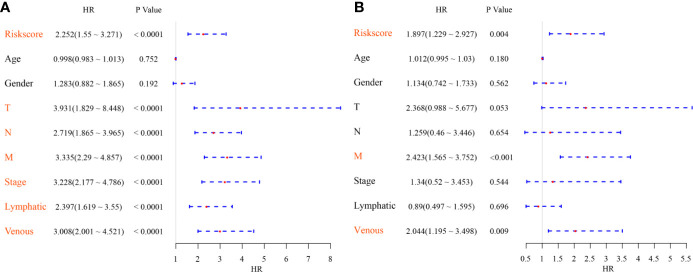
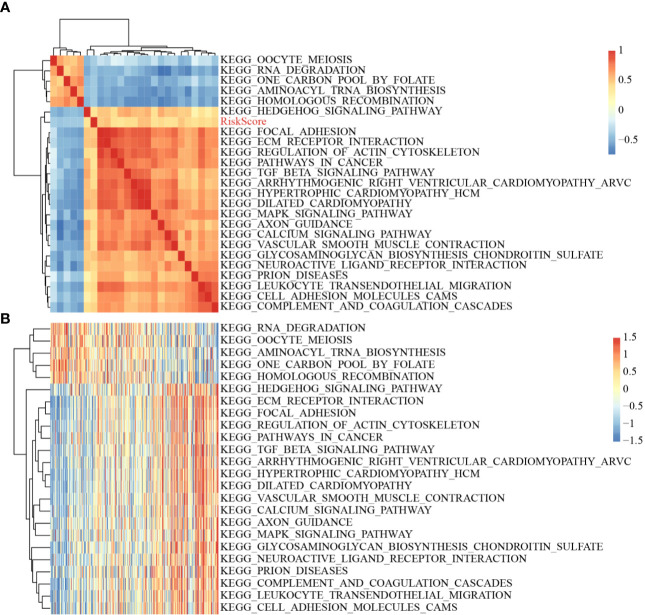
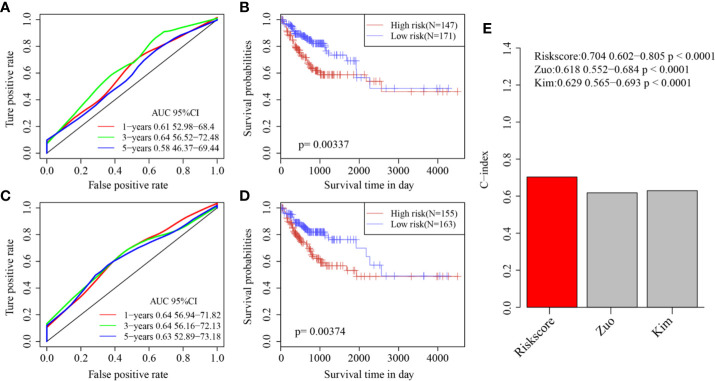
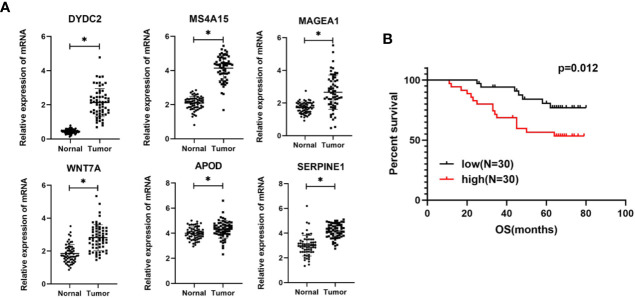
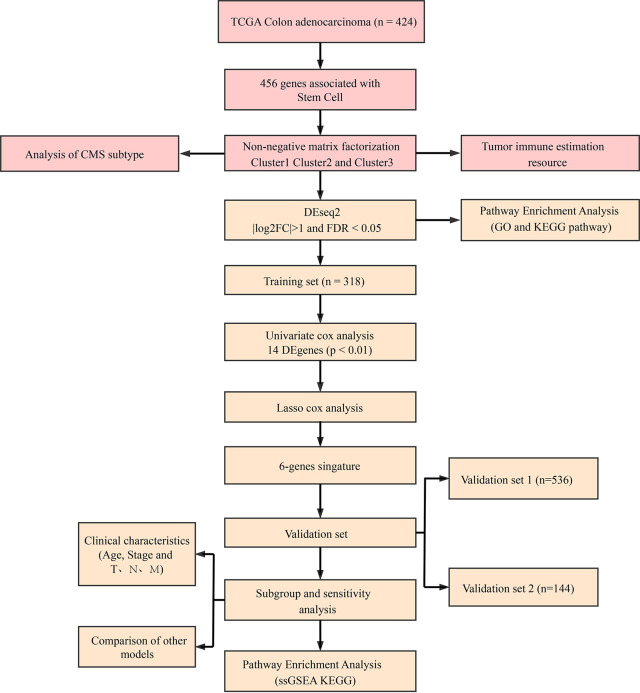
Cancer stem cells play crucial roles in the development of colon cancer (COAD). This study tried to explore new markers for predicting the prognosis of colon cancer based on stem cell-related genes. In our study, 424 COAD samples from TCGA were divided into three subtypes based on 412 stem cell-related genes; there were significant differences in prognosis, clinical characteristics, and immune scores between these subtypes. 694 genes were screened between subgroups. Subsequently a six-gene signature (DYDC2, MS4A15, MAGEA1, WNT7A, APOD, and SERPINE1) was established. This model had strong robustness and stable predictive performance in cohorts of different platforms. Taken together, the six-gene signature constructed in this study could be used as a novel prognostic marker for COAD patients.
Keywords: colon adenocarcinoma; molecular subtype; prognostic marker; six-gene signature; stem cell.
Copyright © 2021 Liang, Su and Wu.
Conflict of interest statement
The authors declare that the research was conducted in the absence of any commercial or financial relationships that could be construed as a potential conflict of interest.
Figures
Similar articles
-
Identification and development of a novel invasion-related gene signature for prognosis prediction in colon adenocarcinoma.Cancer Cell Int. 2021 Feb 12;21(1):101. doi: 10.1186/s12935-021-01795-1. Cancer Cell Int. 2021. PMID: 33579281 Free PMC article.
-
In silico development and clinical validation of novel 8 gene signature based on lipid metabolism related genes in colon adenocarcinoma.Pharmacol Res. 2021 Jul;169:105644. doi: 10.1016/j.phrs.2021.105644. Epub 2021 Apr 30. Pharmacol Res. 2021. PMID: 33940186
-
Weighted Gene Co-expression Network Analysis Identified a Novel Thirteen-Gene Signature Associated With Progression, Prognosis, and Immune Microenvironment of Colon Adenocarcinoma Patients.Front Genet. 2021 Jul 12;12:657658. doi: 10.3389/fgene.2021.657658. eCollection 2021. Front Genet. 2021. PMID: 34322151 Free PMC article.
-
Development and Clinical Validation of a Novel 4-Gene Prognostic Signature Predicting Survival in Colorectal Cancer.Front Oncol. 2020 May 20;10:595. doi: 10.3389/fonc.2020.00595. eCollection 2020. Front Oncol. 2020. PMID: 32509568 Free PMC article.
-
Gene Expression Along with Genomic Copy Number Variation and Mutational Analysis Were Used to Develop a 9-Gene Signature for Estimating Prognosis of COAD.Onco Targets Ther. 2020 Oct 14;13:10393-10408. doi: 10.2147/OTT.S255590. eCollection 2020. Onco Targets Ther. 2020. PMID: 33116619 Free PMC article.
Cited by
-
A novel investigation into an E2F transcription factor-related prognostic model with seven signatures for colon cancer patients.IET Syst Biol. 2023 Aug;17(4):187-197. doi: 10.1049/syb2.12069. Epub 2023 Jul 11. IET Syst Biol. 2023. PMID: 37431829 Free PMC article.
-
Identification of N7-methylguanosine related signature for prognosis and immunotherapy efficacy prediction in lung adenocarcinoma.Front Med (Lausanne). 2022 Aug 24;9:962972. doi: 10.3389/fmed.2022.962972. eCollection 2022. Front Med (Lausanne). 2022. PMID: 36091687 Free PMC article.
-
A novel stemness-hypoxia-related signature for prognostic stratification and immunotherapy response in hepatocellular carcinoma.BMC Cancer. 2022 Oct 28;22(1):1103. doi: 10.1186/s12885-022-10195-1. BMC Cancer. 2022. PMID: 36307751 Free PMC article.
-
Prognostic value of RNA methylation-related genes in gastric adenocarcinoma based on bioinformatics.PeerJ. 2024 Feb 29;12:e16951. doi: 10.7717/peerj.16951. eCollection 2024. PeerJ. 2024. PMID: 38436027 Free PMC article.
-
Novel six-gene prognostic signature based on colon adenocarcinoma immune-related genes.BMC Bioinformatics. 2022 Oct 11;23(1):418. doi: 10.1186/s12859-022-04909-2. BMC Bioinformatics. 2022. PMID: 36221049 Free PMC article.
References
-
- Dawood S, Austin L, Cristofanilli M. Cancer stem cells: implications for cancer therapy[J]. Oncol (Williston Park NY) (2014) 28(12):1101–7. - PubMed
LinkOut - more resources
Full Text Sources
Other Literature Sources
Miscellaneous