

Multiple Myeloma Cells Alter Adipogenesis, Increase Senescence-Related and Inflammatory Gene Transcript Expression, and Alter Metabolism in Preadipocytes
- PMID: 33680918
- PMCID: PMC7930573
- DOI: 10.3389/fonc.2020.584683
Multiple Myeloma Cells Alter Adipogenesis, Increase Senescence-Related and Inflammatory Gene Transcript Expression, and Alter Metabolism in Preadipocytes
Abstract
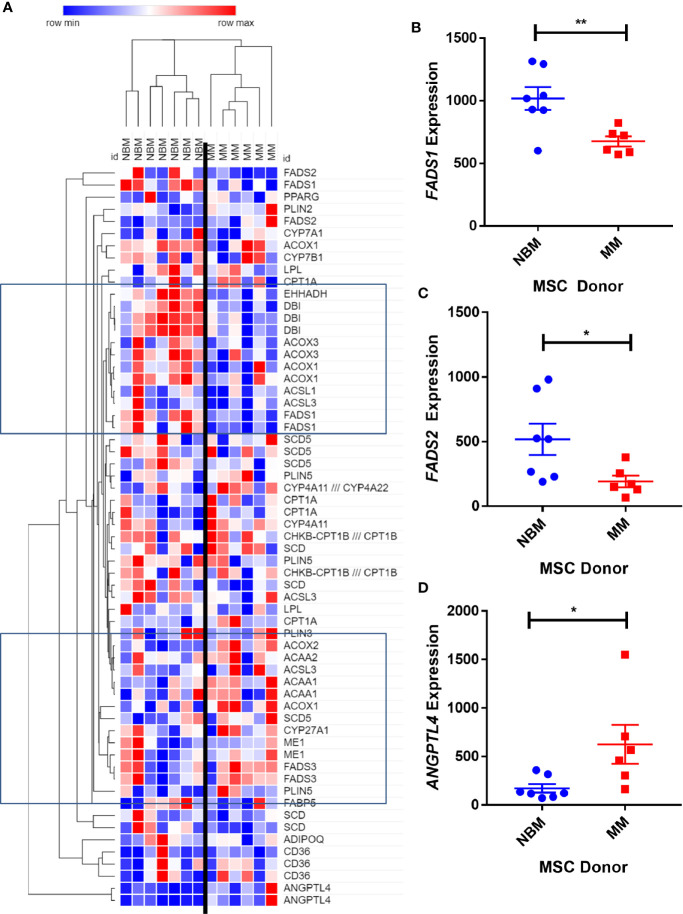
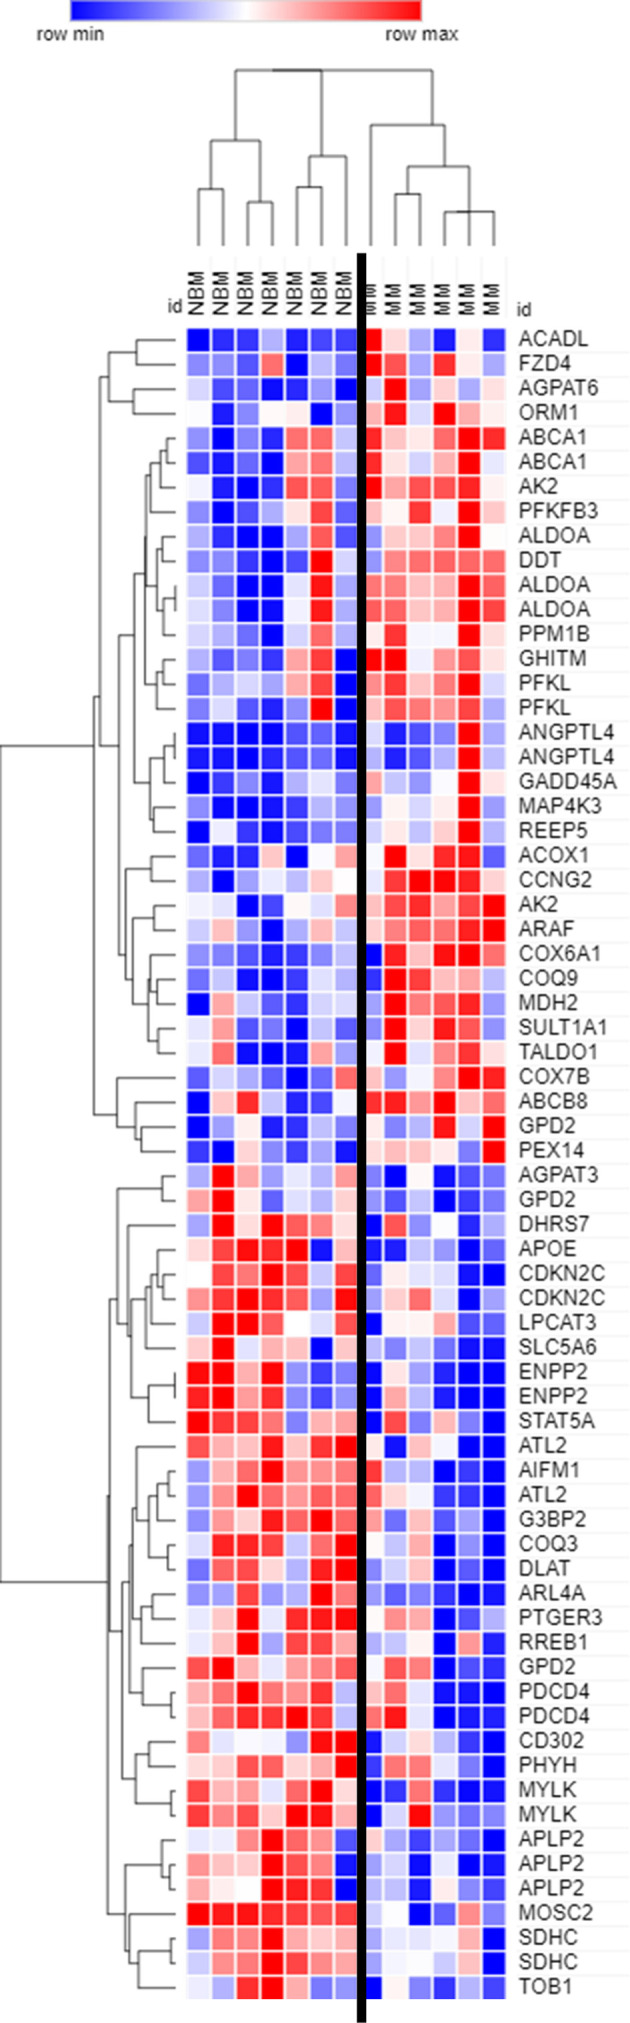
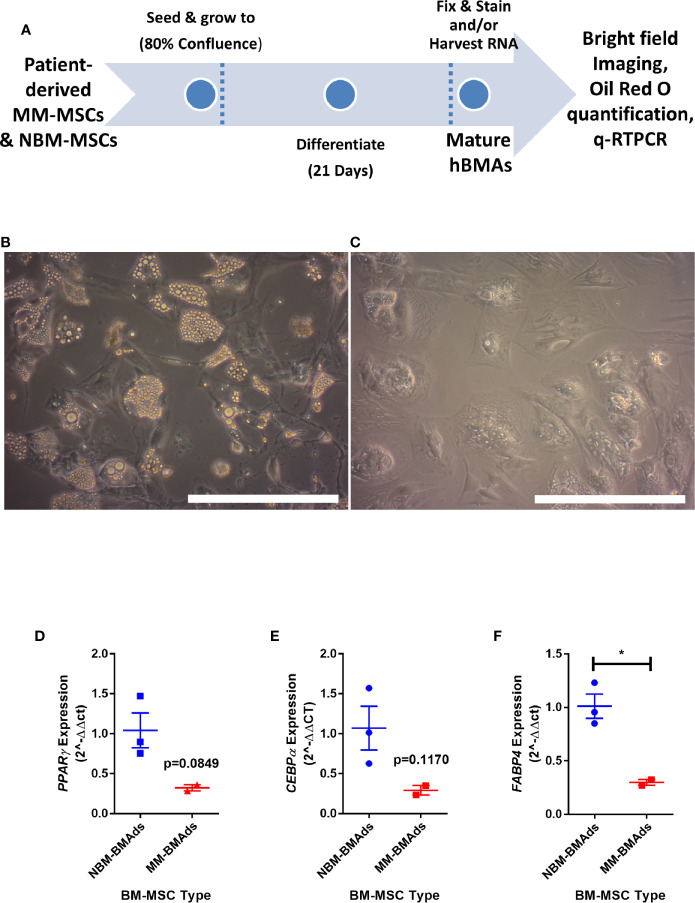
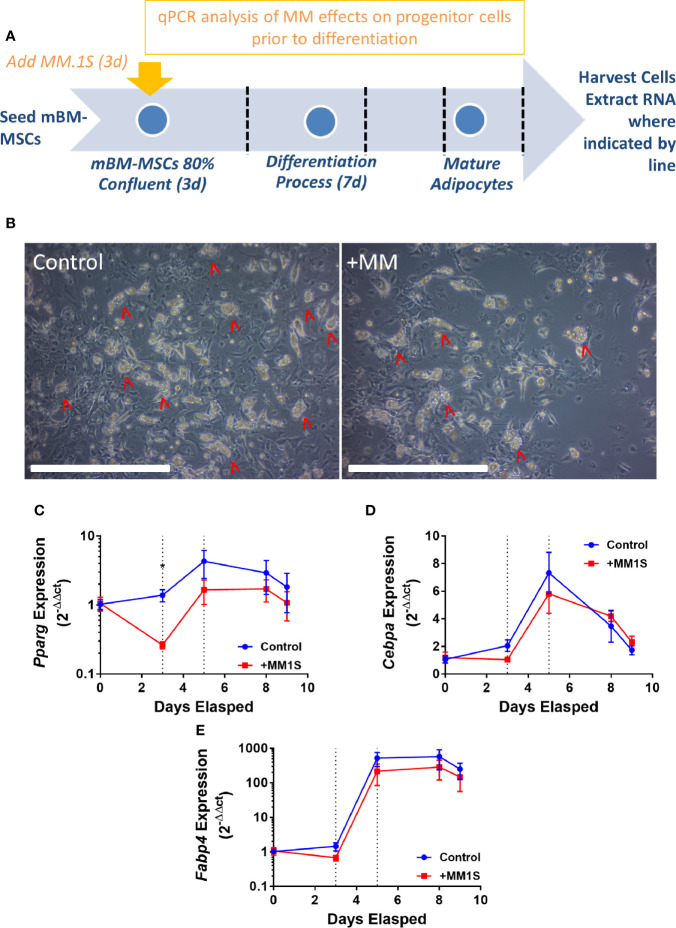
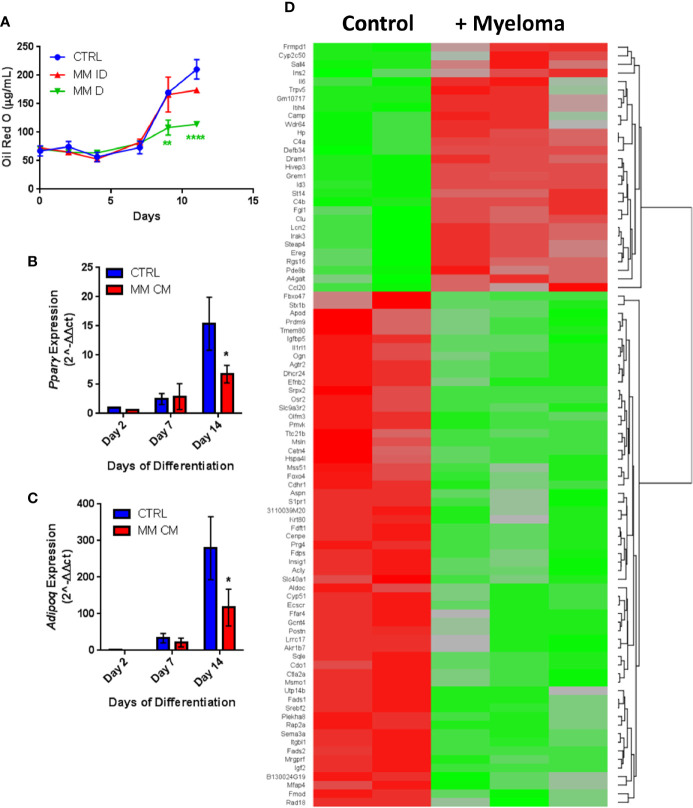
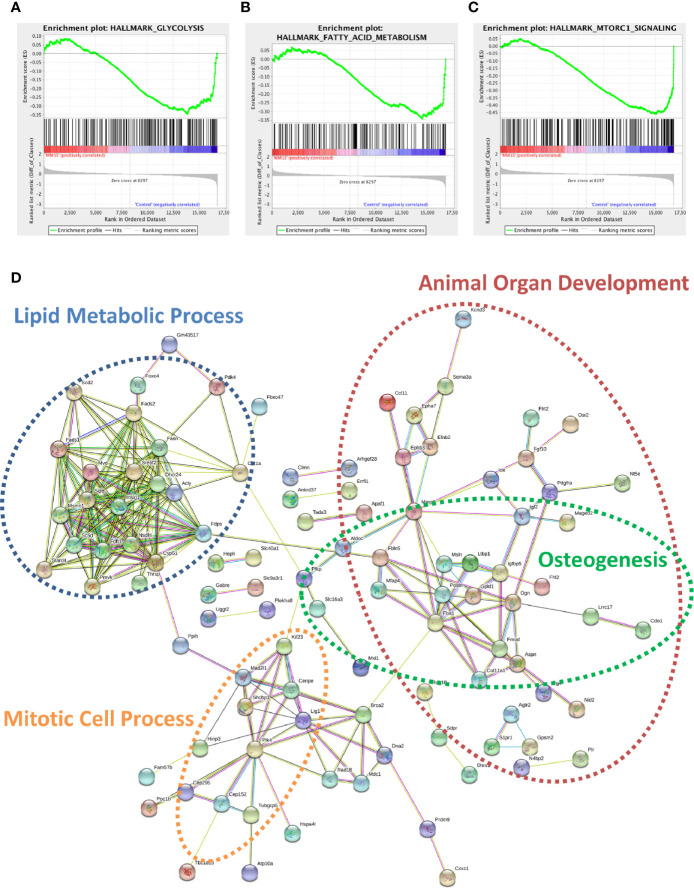
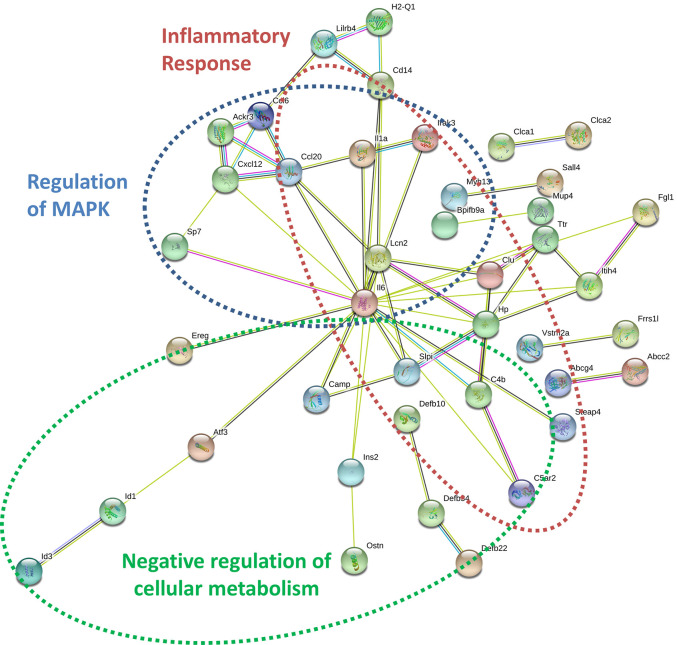
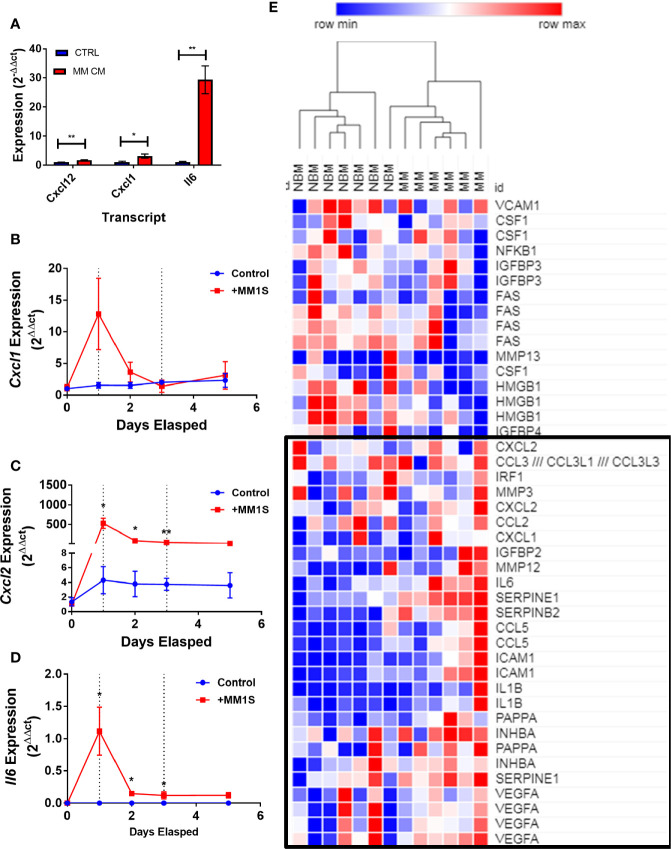
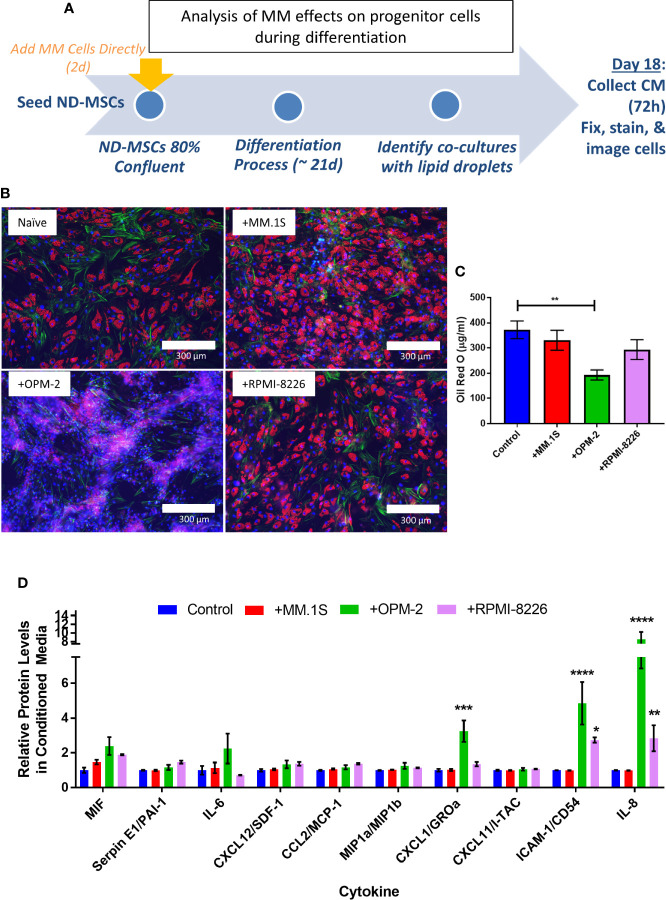
Within the bone marrow microenvironment, mesenchymal stromal cells (MSCs) are an essential precursor to bone marrow adipocytes and osteoblasts. The balance between this progenitor pool and mature cells (adipocytes and osteoblasts) is often skewed by disease and aging. In multiple myeloma (MM), a cancer of the plasma cell that predominantly grows within the bone marrow, as well as other cancers, MSCs, preadipocytes, and adipocytes have been shown to directly support tumor cell survival and proliferation. Increasing evidence supports the idea that MM-associated MSCs are distinct from healthy MSCs, and their gene expression profiles may be predictive of myeloma patient outcomes. Here we directly investigate how MM cells affect the differentiation capacity and gene expression profiles of preadipocytes and bone marrow MSCs. Our studies reveal that MM.1S cells cause a marked decrease in lipid accumulation in differentiating 3T3-L1 cells. Also, MM.1S cells or MM.1S-conditioned media altered gene expression profiles of both 3T3-L1 and mouse bone marrow MSCs. 3T3-L1 cells exposed to MM.1S cells before adipogenic differentiation displayed gene expression changes leading to significantly altered pathways involved in steroid biosynthesis, the cell cycle, and metabolism (oxidative phosphorylation and glycolysis) after adipogenesis. MM.1S cells induced a marked increase in 3T3-L1 expression of MM-supportive genes including Il-6 and Cxcl12 (SDF1), which was confirmed in mouse MSCs by qRT-PCR, suggesting a forward-feedback mechanism. In vitro experiments revealed that indirect MM exposure prior to differentiation drives a senescent-like phenotype in differentiating MSCs, and this trend was confirmed in MM-associated MSCs compared to MSCs from normal donors. In direct co-culture, human mesenchymal stem cells (hMSCs) exposed to MM.1S, RPMI-8226, and OPM-2 prior to and during differentiation, exhibited different levels of lipid accumulation as well as secreted cytokines. Combined, our results suggest that MM cells can inhibit adipogenic differentiation while stimulating expression of the senescence associated secretory phenotype (SASP) and other pro-myeloma molecules. This study provides insight into a novel way in which MM cells manipulate their microenvironment by altering the expression of supportive cytokines and skewing the cellular diversity of the marrow.
Keywords: adipocytes; bone marrow; mesenchymal stromal cells (MSCs); microarray; myeloma; preadipocytes; senescence.
Copyright © 2021 Fairfield, Costa, Falank, Farrell, Murphy, D’Amico, Driscoll and Reagan.
Conflict of interest statement
The authors declare that the research was conducted in the absence of any commercial or financial relationships that could be construed as a potential conflict of interest.
Figures
Similar articles
-
[Comparison of Adipogenesis and Adipocyte Functions of 3T3-L1 Cells and Human Bone Marrow Mesenchymal Stem Cells In Vitro].Zhongguo Shi Yan Xue Ye Xue Za Zhi. 2015 Dec;23(6):1729-33. doi: 10.7534/j.issn.1009-2137.2015.06.036. Zhongguo Shi Yan Xue Ye Xue Za Zhi. 2015. PMID: 26708901 Chinese.
-
Mesenchymal stem cells gene signature in high-risk myeloma bone marrow linked to suppression of distinct IGFBP2-expressing small adipocytes.Br J Haematol. 2019 Feb;184(4):578-593. doi: 10.1111/bjh.15669. Epub 2018 Nov 8. Br J Haematol. 2019. PMID: 30408155 Free PMC article. Clinical Trial.
-
Adipocyte-Lineage Cells Support Growth and Dissemination of Multiple Myeloma in Bone.Am J Pathol. 2016 Nov;186(11):3054-3063. doi: 10.1016/j.ajpath.2016.07.012. Epub 2016 Sep 17. Am J Pathol. 2016. PMID: 27648615 Free PMC article.
-
Involvement of adipogenic potential of human bone marrow mesenchymal stem cells (MSCs) in osteoporosis.Curr Stem Cell Res Ther. 2008 Sep;3(3):208-18. doi: 10.2174/157488808785740325. Curr Stem Cell Res Ther. 2008. PMID: 18782003 Review.
-
[Adipogenesis and osteoporosis].Rev Med Chil. 2009 Jun;137(6):827-36. Epub 2009 Sep 4. Rev Med Chil. 2009. PMID: 19746287 Review. Spanish.
Cited by
-
Mesenchymal stromal cells in bone marrow niche of patients with multiple myeloma: a double-edged sword.Cancer Cell Int. 2025 Mar 26;25(1):117. doi: 10.1186/s12935-025-03741-x. Cancer Cell Int. 2025. PMID: 40140850 Free PMC article. Review.
-
Molecular Deconvolution of Bone Marrow Adipose Tissue Interactions with Malignant Hematopoiesis: Potential for New Therapy Development.Curr Osteoporos Rep. 2024 Aug;22(4):367-377. doi: 10.1007/s11914-024-00879-x. Epub 2024 Jun 26. Curr Osteoporos Rep. 2024. PMID: 38922359 Review.
-
Report From the 6th International Meeting on Bone Marrow Adiposity (BMA2020).Front Endocrinol (Lausanne). 2021 Jul 16;12:712088. doi: 10.3389/fendo.2021.712088. eCollection 2021. Front Endocrinol (Lausanne). 2021. PMID: 34335478 Free PMC article.
-
ECM-mimicking hydrogel models of human adipose tissue identify deregulated lipid metabolism in the prostate cancer-adipocyte crosstalk under antiandrogen therapy.Mater Today Bio. 2024 Dec 25;30:101424. doi: 10.1016/j.mtbio.2024.101424. eCollection 2025 Feb. Mater Today Bio. 2024. PMID: 39866784 Free PMC article.
-
Metabolic cross-talk within the bone marrow milieu: focus on multiple myeloma.Exp Hematol Oncol. 2022 Sep 1;11(1):49. doi: 10.1186/s40164-022-00303-z. Exp Hematol Oncol. 2022. PMID: 36050788 Free PMC article. Review.
References
Grants and funding
LinkOut - more resources
Full Text Sources
Other Literature Sources
Molecular Biology Databases