

Multiple U-Net-Based Automatic Segmentations and Radiomics Feature Stability on Ultrasound Images for Patients With Ovarian Cancer
- PMID: 33680934
- PMCID: PMC7930567
- DOI: 10.3389/fonc.2020.614201
Multiple U-Net-Based Automatic Segmentations and Radiomics Feature Stability on Ultrasound Images for Patients With Ovarian Cancer
Abstract
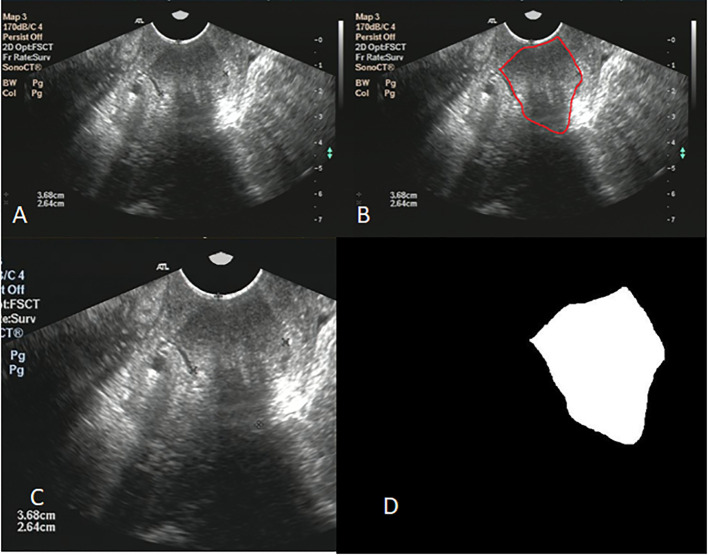
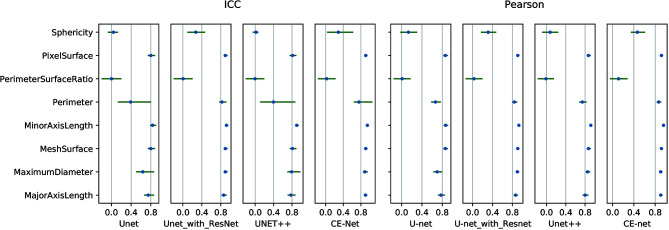
Few studies have reported the reproducibility and stability of ultrasound (US) images based radiomics features obtained from automatic segmentation in oncology. The purpose of this study is to study the accuracy of automatic segmentation algorithms based on multiple U-net models and their effects on radiomics features from US images for patients with ovarian cancer. A total of 469 US images from 127 patients were collected and randomly divided into three groups: training sets (353 images), validation sets (23 images), and test sets (93 images) for automatic segmentation models building. Manual segmentation of target volumes was delineated as ground truth. Automatic segmentations were conducted with U-net, U-net++, U-net with Resnet as the backbone (U-net with Resnet), and CE-Net. A python 3.7.0 and package Pyradiomics 2.2.0 were used to extract radiomic features from the segmented target volumes. The accuracy of automatic segmentations was evaluated by Jaccard similarity coefficient (JSC), dice similarity coefficient (DSC), and average surface distance (ASD). The reliability of radiomics features were evaluated by Pearson correlation and intraclass correlation coefficients (ICC). CE-Net and U-net with Resnet outperformed U-net and U-net++ in accuracy performance by achieving a DSC, JSC, and ASD of 0.87, 0.79, 8.54, and 0.86, 0.78, 10.00, respectively. A total of 97 features were extracted from the delineated target volumes. The average Pearson correlation was 0.86 (95% CI, 0.83-0.89), 0.87 (95% CI, 0.84-0.90), 0.88 (95% CI, 0.86-0.91), and 0.90 (95% CI, 0.88-0.92) for U-net++, U-net, U-net with Resnet, and CE-Net, respectively. The average ICC was 0.84 (95% CI, 0.81-0.87), 0.85 (95% CI, 0.82-0.88), 0.88 (95% CI, 0.85-0.90), and 0.89 (95% CI, 0.86-0.91) for U-net++, U-net, U-net with Resnet, and CE-Net, respectively. CE-Net based segmentation achieved the best radiomics reliability. In conclusion, U-net based automatic segmentation was accurate enough to delineate the target volumes on US images for patients with ovarian cancer. Radiomics features extracted from automatic segmented targets showed good reproducibility and for reliability further radiomics investigations.
Keywords: U-net; automatic segmentation; ovarian cancer; radiomics; ultrasound images.
Copyright © 2021 Jin, Zhu, Zhang, Ai, Zhang, Teng, Xie and Jin.
Conflict of interest statement
The authors declare that the research was conducted in the absence of any commercial or financial relationships that could be construed as a potential conflict of interest.
Figures


References
LinkOut - more resources
Full Text Sources
Other Literature Sources