. 2021 Feb 18:2021:8813410.
doi: 10.1155/2021/8813410. eCollection 2021.

Metabolic Alteration in Hepatocellular Carcinoma: Mechanism of Lipid Accumulation in Well-Differentiated Hepatocellular Carcinoma

Affiliations

Metabolic Alteration in Hepatocellular Carcinoma: Mechanism of Lipid Accumulation in Well-Differentiated Hepatocellular Carcinoma

Hideo Suzuki et al. Can J Gastroenterol Hepatol. .

Abstract

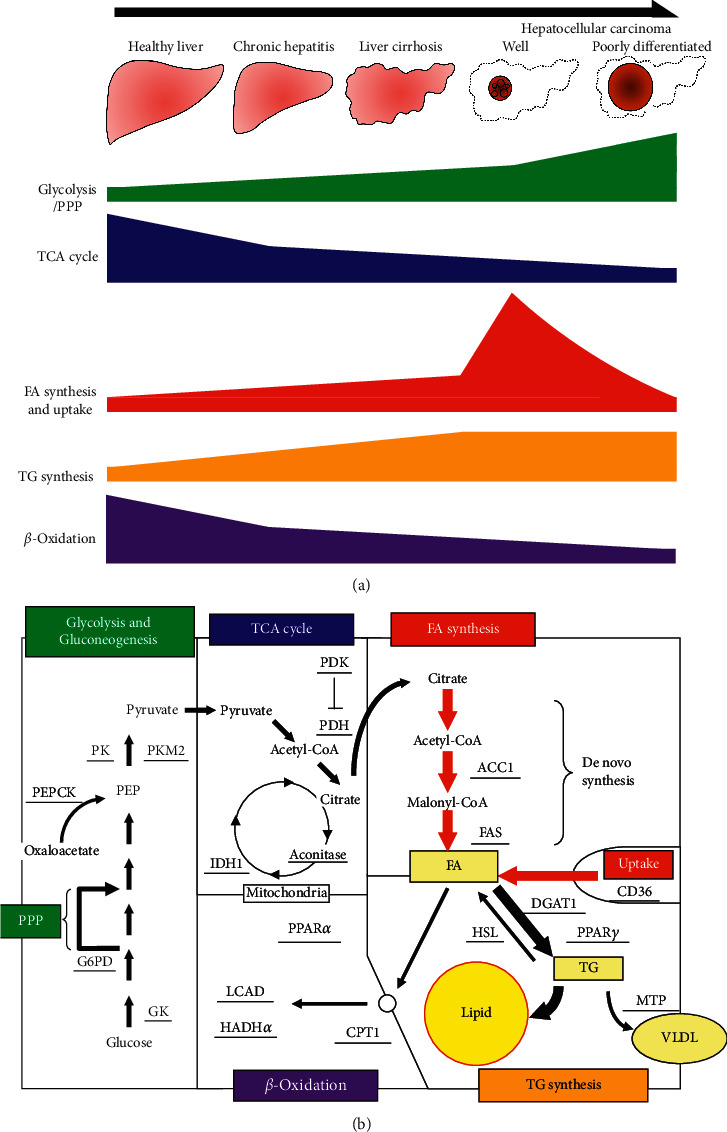
Objective: Metabolic alteration is widely considered as one of the hallmarks of cancer. Hepatocellular carcinoma (HCC) presents a unique pathological feature in which lipid accumulation is common in well-differentiated HCC and rare in poorly differentiated HCC; however, the underlying mechanism remains unclear.

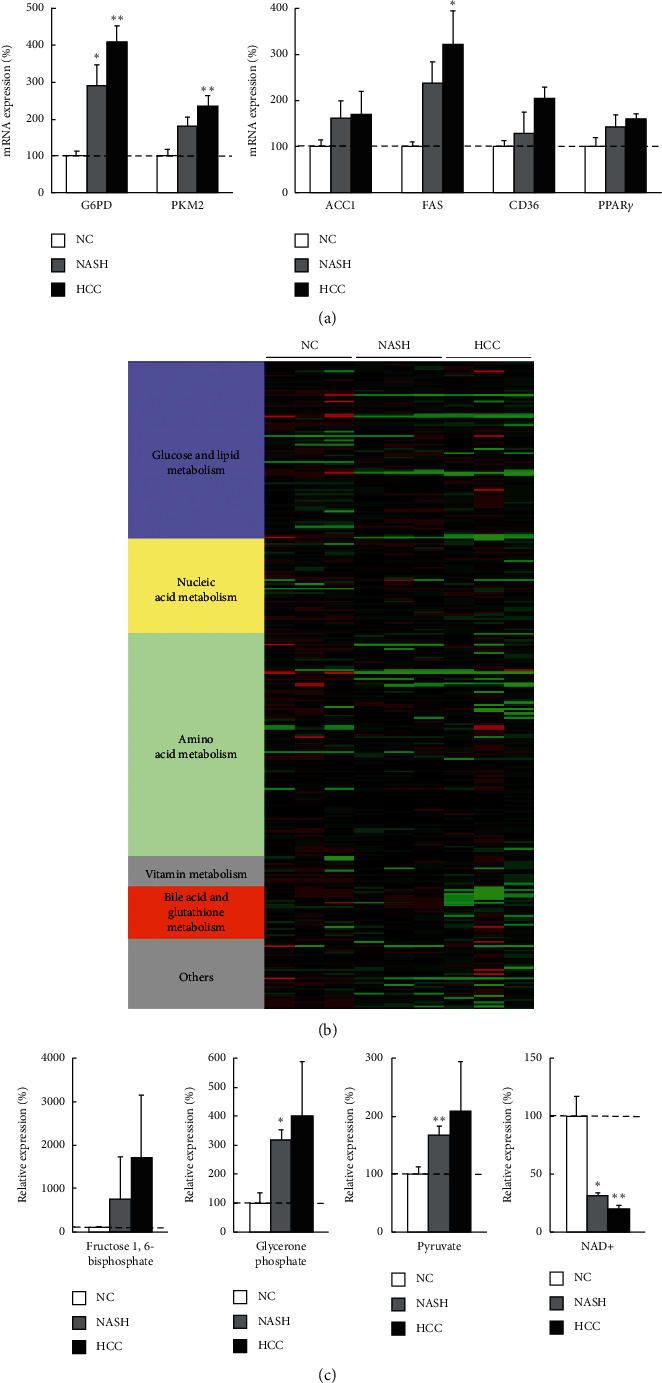
Methods: Tissue samples were obtained from 103 HCC patients who had undergone hepatic resection and 12 living donors of liver transplantation. We evaluated metabolic gene expressions in cancer tissues as well as background noncancer tissues and compared the expressions by the degree of cancer differentiation and by liver disease states. Besides, the metabolomics was evaluated and integrated to gene expressions in nonalcoholic steatohepatitis (NASH)-HCC model mice.

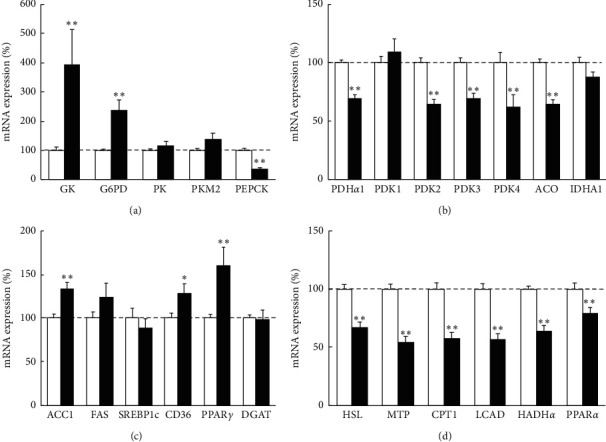
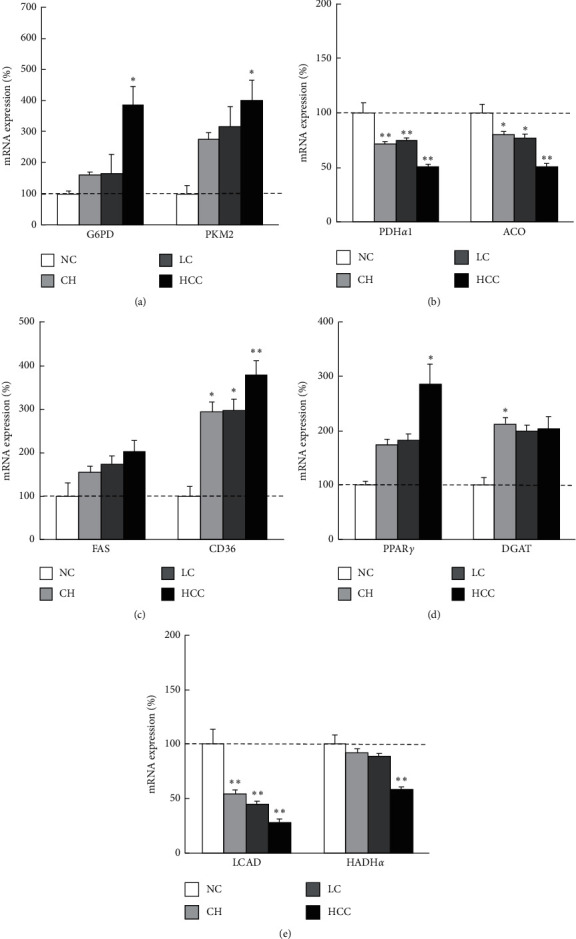
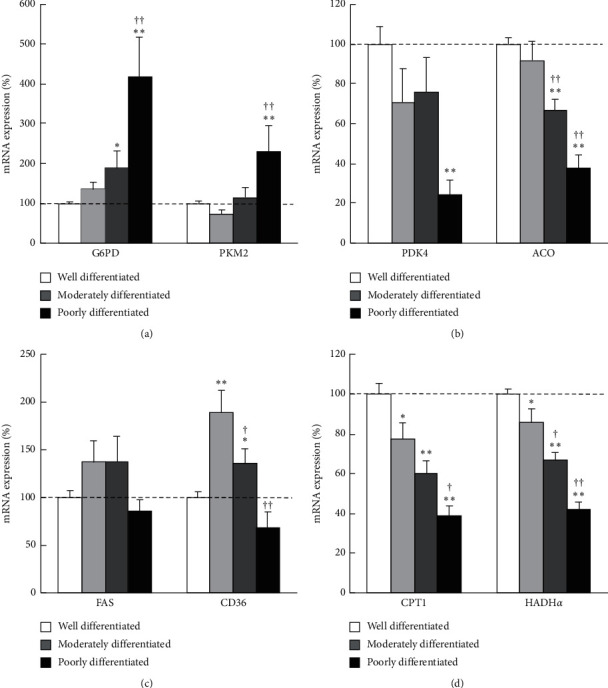
Results: In cancer tissues, the expression levels of enzymes related to glycolysis, pentose phosphate pathway (PPP), and fatty acid (FA) synthesis were increased and that of tricarboxylic acid (TCA) cycle and β-oxidation were suppressed. Same metabolic alterations were observed in noncancer tissue as the liver disease progresses from healthy liver to chronic hepatitis, cirrhosis, and HCC. Similar alterations of metabolic genes were detected in NASH-HCC mice, which were consistent with the results of metabolomics. As the degree of cancer differentiation decreased, glycolysis and PPP were accelerated; however, FA synthesis and uptake were diminished.

Conclusions: The metabolic alterations including glycolysis, PPP, TCA cycle, and β-oxidation became more prominent as liver disease progresses from normal, chronic hepatitis, cirrhosis, well-, moderately, and poorly differentiated HCC. FA synthesis and uptake were highest in well-differentiated HCC, which could explain the lipid accumulation.


Conflict of interest statement

The authors declare no conflicts of interest.

Figures

Figure 1
Figure 1
Metabolic gene expression in cancer tissues relative to noncancer tissues in human HCC samples. Quantitative RT-PCR analysis of metabolic genes related to (a) glucose metabolism, (b) pyruvate metabolism, tricarboxylic acid (TCA) cycle, (c) fatty acid (FA) synthesis and uptake, (d) triglyceride (TG) hydrolysis and secretion, and β-oxidation. The gene expression levels of cancer tissues were normalized to those of noncancer tissues and were presented as mean ± SE. p < 0.05 and ∗∗p < 0.01 vs. noncancer tissue. GK, glucokinase; G6PD, glucose-6-phosphate dehydrogenase; PK, pyruvate kinase; PEPCK, phosphoenolpyruvate carboxykinase; PDH, pyruvate dehydrogenase; PDK, pyruvate dehydrogenase kinase; ACO, aconitase; IDH, isocitrate dehydrogenase; ACC, acetyl-coenzyme A carboxylase; FAS, fatty acid synthase; SREBP, sterol regulatory element-binding protein; PPAR, peroxisome proliferator-activated receptor; DGAT, diacylglycerol acyltransferase; HSL, hormone-sensitive lipase; MTP, microsomal triglyceride transfer protein; CPT, carnitine palmitoyltransferase; LCAD, long chain acyl-coenzyme A dehydrogenase; HADH, hydroxyacyl-coenzyme A dehydrogenase.
Figure 2
Figure 2
Metabolic gene expressions in each liver disease sate in human liver samples. Quantitative RT-PCR analysis of metabolic genes related to (a) glycolysis, (b) TCA cycle, (c) FA synthesis and uptake, (d) TG synthesis, and (e) β-oxidation, by liver disease states. The gene expression levels normalized to those of normal control tissues were presented as mean ± SE. p < 0.05 and ∗∗p < 0.01 vs. normal control tissue. NC, normal control; CH, chronic hepatitis; LC, liver cirrhosis; HCC, hepatocellular carcinoma; G6PD, glucose-6-phosphate dehydrogenase; PK, pyruvate kinase; PDH, pyruvate dehydrogenase; ACO, aconitase; FAS, fatty acid synthase; PPAR, peroxisome proliferator-activated receptor; DGAT, diacylglycerol acyltransferase; LCAD, long chain acyl-coenzyme A dehydrogenase; HADH, hydroxyacyl-coenzyme A dehydrogenase.
Figure 3
Figure 3
Gene expression analysis and metabolomics of liver samples from mouse NASH-HCC model. (a) Quantitative RT-PCR analysis of metabolic genes related to glycolysis, FA synthesis and uptake, and TG synthesis in cancer tissues (HCC) and noncancer tissues (NASH) from melanocortin-4 receptor-deficient (MC4R–KO) mice fed a western diet for 60 weeks. The gene expression levels were normalized to those of wild-type (WT) mice as normal control (NC) and were presented as mean ± SE. p < 0.05 and ∗∗p < 0.01 vs. NC. (b) Heat map analysis of metabolomics in NC, NASH, and HCC. It was generated by coloring the values of all data across their value ranges. The color red demonstrated that the relative content of metabolites is high and green demonstrates that they are low. The brightness of each color corresponded to the magnitude of the difference when compared with the average value. (c) The amounts of glycolysis-related metabolites and NAD+ in NASH and HCC normalized to those in NC were presented as mean ± SD. p < 0.05, ∗∗p < 0.01 vs. NC. NASH, nonalcoholic steatohepatitis; HCC, hepatocellular carcinoma; G6PD, glucose-6-phosphate dehydrogenase; PK, pyruvate kinase; ACC, acetyl-coenzyme A carboxylase; FAS, fatty acid synthase; SREBP, sterol regulatory element-binding protein; PPAR, peroxisome proliferator-activated receptor; NAD, nicotinamide adenine dinucleotide.
Figure 4
Figure 4
Metabolic gene expression levels in each degree of cancer differentiation in human HCC samples. Quantitative RT-PCR analysis of metabolic genes related to (a) glycolysis, (b) TCA cycle, (c) FA synthesis and uptake, and (d) β-oxidation. The gene expression levels normalized to those of noncancer tissues and were presented as mean ± SE. p < 0.05 and ∗∗p < 0.01 vs. noncancer tissue. p < 0.05, ††p < 0.01 vs. well-differentiated HCC tissue. G6PD, glucose-6-phosphate dehydrogenase; PK, pyruvate kinase; PDK, pyruvate dehydrogenase kinase; ACO, aconitase; FAS, fatty acid synthase; CPT, carnitine palmitoyltransferase; HADH, hydroxyacyl-coenzyme A dehydrogenase.
Figure 5
Figure 5
Schematic figures of metabolic alterations in HCC. (a) The schematic figure showing the metabolic alteration as liver disease progresses from normal liver, chronic hepatitis, cirrhosis, to well- and poorly differentiated HCC. Glycolysis and pentose phosphate pathway (PPP) were increased and the TCA cycle and β-oxidation were decreased throughout the disease progression course. FA synthesis and uptake were gradually increased until HCC development, while those of well-differentiated HCC were the highest and decreased as the degree of differentiation progressed. (b) Comprehensive schematic figure showing the metabolic features in the well-differentiated HCC. The thick arrows represent increased biochemical reactions indicated by gene expression analysis. GK, glucokinase; G6PD, glucose-6-phosphate dehydrogenase; PEP, phosphoenolpyruvate; PEPCK, phosphoenolpyruvate carboxykinase; PK, pyruvate kinase; PDH, pyruvate dehydrogenase; PDK, pyruvate dehydrogenase kinase; IDH, isocitrate dehydrogenase; ACC, acetyl-coenzyme A carboxylase; FAS, fatty acid synthase; PPAR, peroxisome proliferator-activated receptor; DGAT, diacylglycerol acyltransferase; HSL, hormone-sensitive lipase; MTP, microsomal triglyceride transfer protein; CPT, carnitine palmitoyltransferase; LCAD, long chain acyl-coenzyme A dehydrogenase; HADH, hydroxyacyl-coenzyme A dehydrogenase.

References

    1. Forner A., Reig M., Bruix J. Hepatocellular carcinoma. The Lancet. 2018;391(10127):1301–1314. doi: 10.1016/s0140-6736(18)30010-2. - DOI - PubMed
    1. Villanueva A. Hepatocellular carcinoma. New England Journal of Medicine. 2019;380(15):1450–1462. doi: 10.1056/nejmra1713263. - DOI - PubMed
    1. Amann T., Maegdefrau U., Hartmann A., et al. GLUT1 expression is increased in hepatocellular carcinoma and promotes tumorigenesis. The American Journal of Pathology. 2009;174(4):1544–1552. doi: 10.2353/ajpath.2009.080596. - DOI - PMC - PubMed
    1. Wong C. C., Au S. L., Tse A. P., et al. Switching of pyruvate kinase isoform L to M2 promotes metabolic reprogramming in hepatocarcinogenesis. PLoS One. 2014;9(12) doi: 10.1371/journal.pone.0115036.e115036 - DOI - PMC - PubMed
    1. Calvisi D. F., Wang C., Ho C., et al. Increased lipogenesis, induced by AKT-mTORC1-RPS6 signaling, promotes development of human hepatocellular carcinoma. Gastroenterology. 2011;140(3):1071–1083. doi: 10.1053/j.gastro.2010.12.006. - DOI - PMC - PubMed