

Analysis of Differentially Expressed Genes in Endothelial Cells Following Tumor Cell Adhesion, and the Role of PRKAA2 and miR-124-3p
- PMID: 33681194
- PMCID: PMC7933219
- DOI: 10.3389/fcell.2021.604038
Analysis of Differentially Expressed Genes in Endothelial Cells Following Tumor Cell Adhesion, and the Role of PRKAA2 and miR-124-3p
Abstract
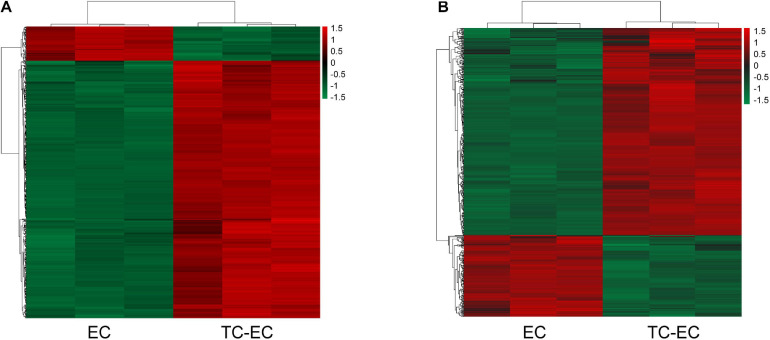
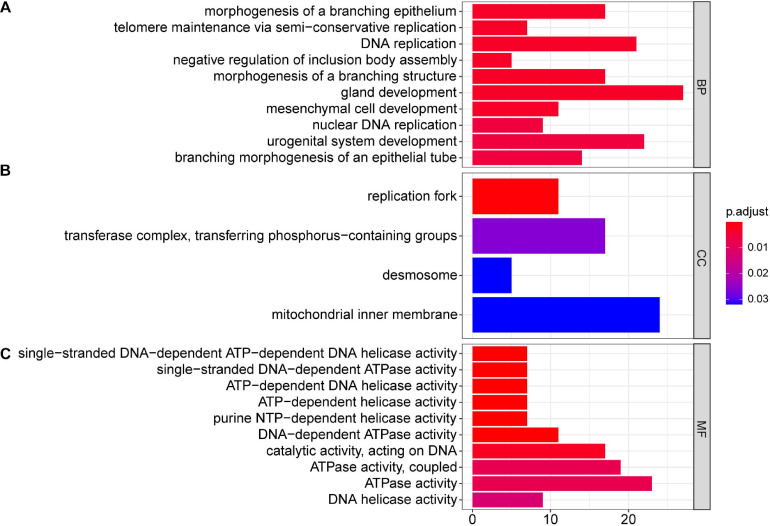
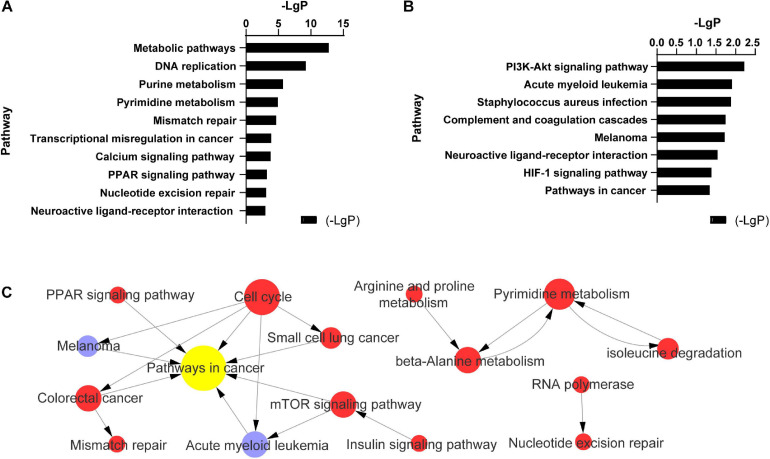
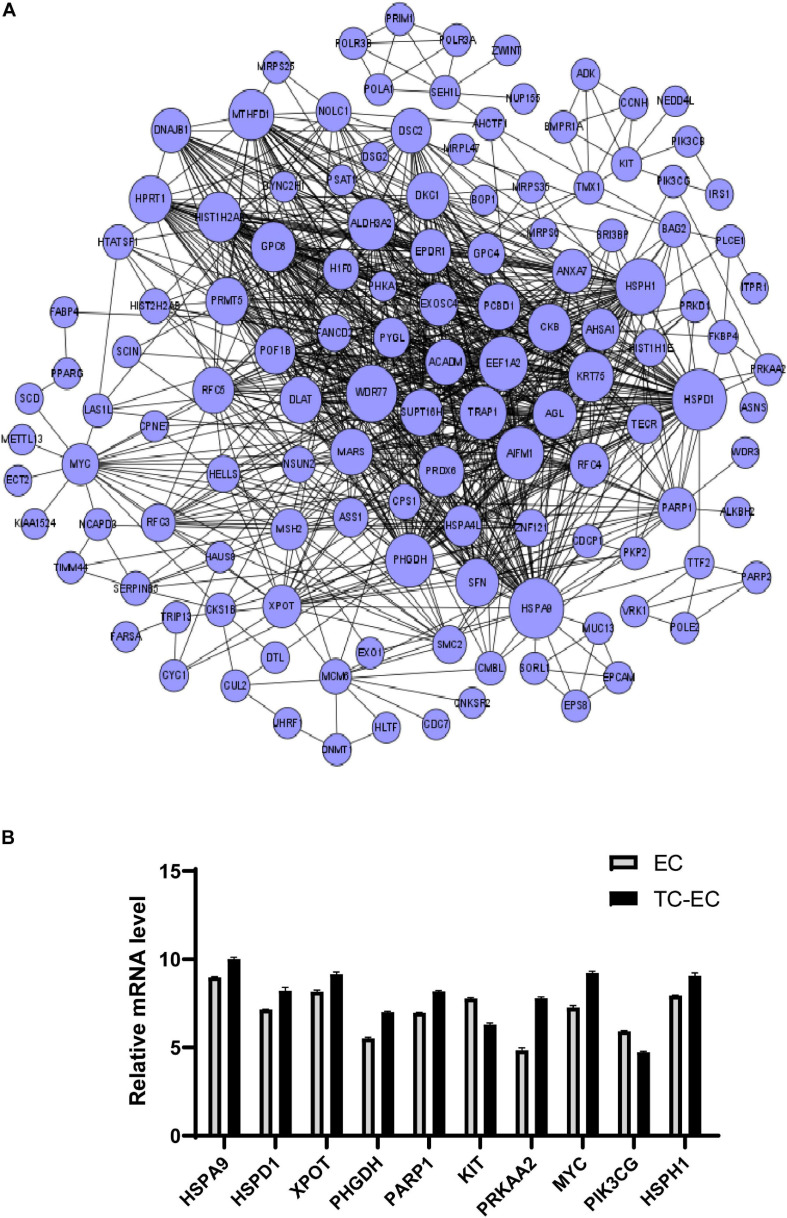
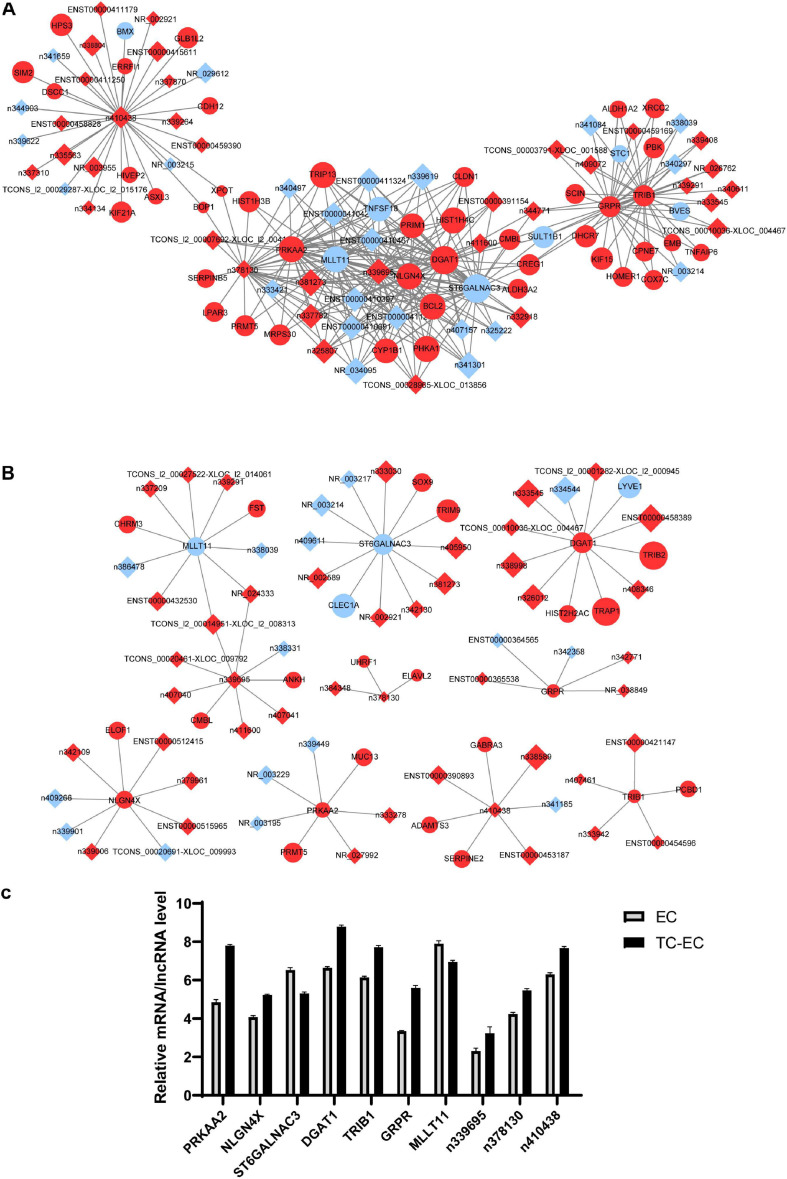
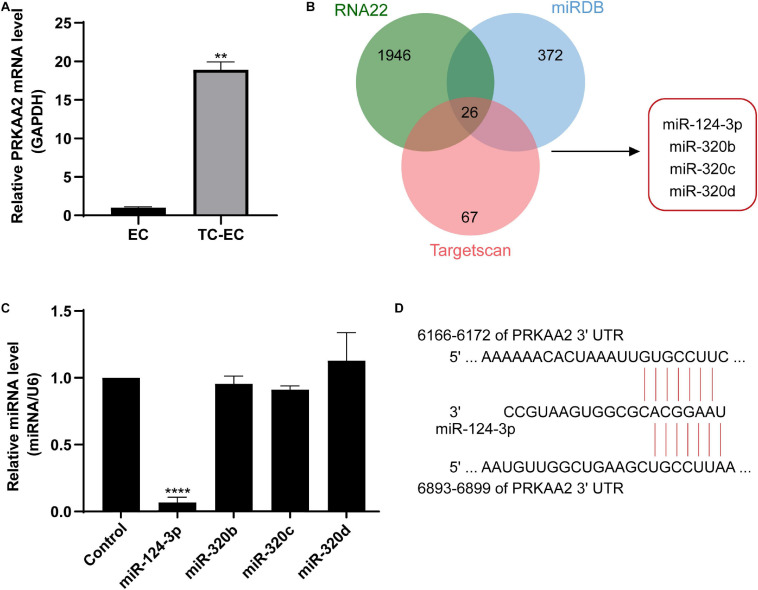
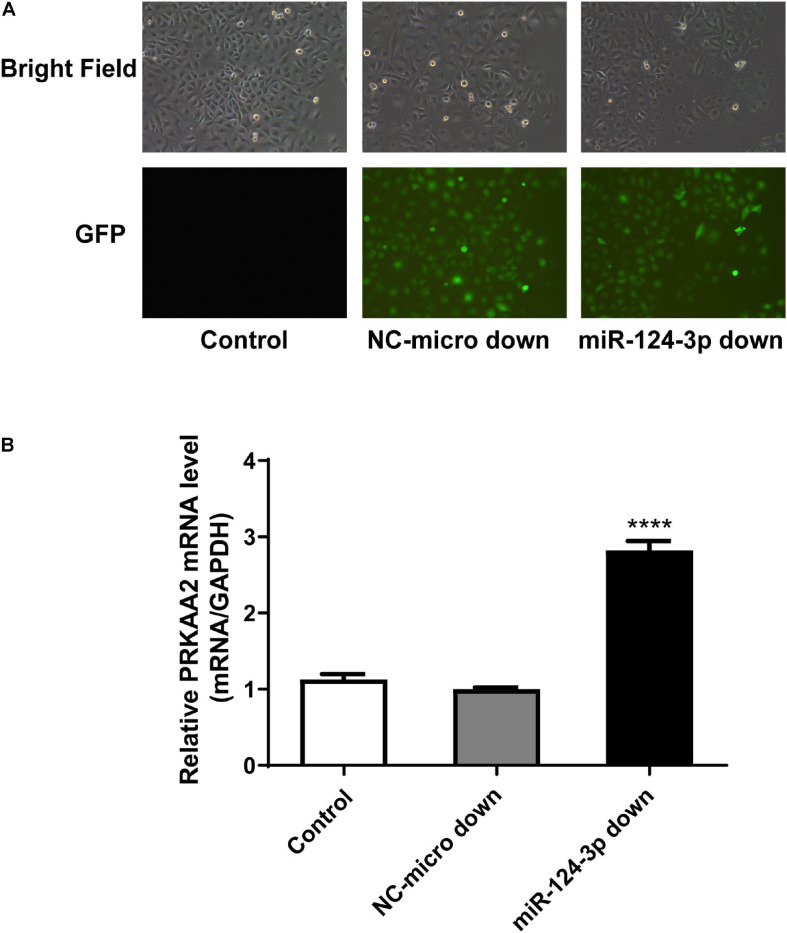
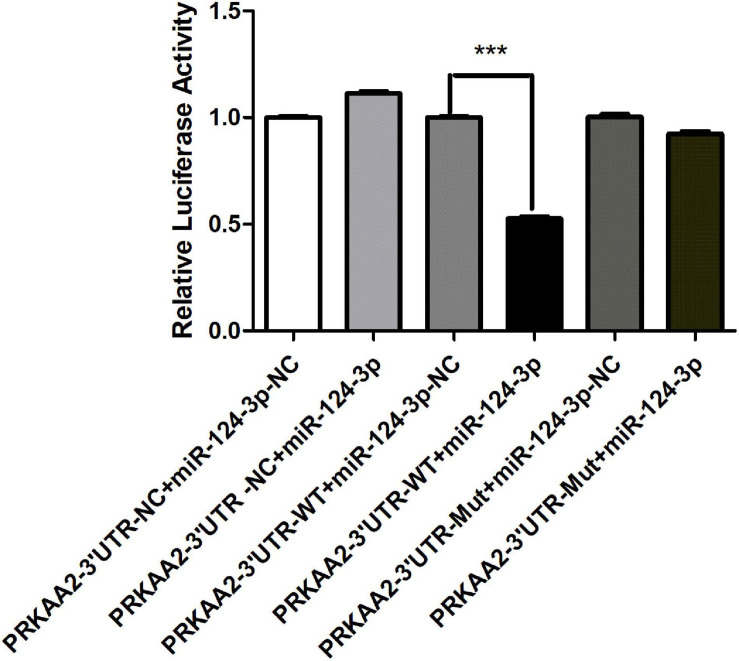
Tumor cell adhesion to the endothelium is one pattern of tumor-endothelium interaction and a key step during tumor metastasis. Endothelium integrity is an important barrier to prevent tumor invasion and metastasis. Changes in endothelial cells (ECs) due to tumor cell adhesion provide important signaling mechanisms for the angiogenesis and metastasis of tumor cells. However, the changes happened in endothelial cells when tumor-endothelium interactions are still unclear. In this study, we used Affymetrix Gene Chip Human Transcriptome Array 2.0. and quantitative real-time PCR (qPCR) to clarify the detailed gene alteration in endothelial cells adhered by prostate tumor cells PC-3M. A total of 504 differentially expressed mRNAs and 444 lncRNAs were obtained through chip data analysis. Gene Ontology (GO) function analysis showed that differentially expressed genes (DEGs) mainly mediated gland development and DNA replication at the biological level; at the cell component level, they were mainly involved in the mitochondrial inner membrane; and at the molecular function level, DEGs were mainly enriched in ATPase activity and catalytic activity. Kyoto Encyclopedia of Genes and Genomes (KEGG) signal pathway analysis showed that the DEGs mainly regulated pathways in cancer, cell cycle, pyrimidine metabolism, and the mTOR signaling pathway. Then, we constructed a protein-protein interaction functional network and mRNA-lncRNA interaction network using Cytoscape v3.7.2. to identify core genes, mRNAs, and lncRNAs. The miRNAs targeted by the core mRNA PRKAA2 were predicted using databases (miRDB, RNA22, and Targetscan). The qPCR results showed that miR-124-3p, the predicted target miRNA of PRKAA2, was significantly downregulated in endothelial cells adhered by PC-3M. With a dual luciferase reporter assay, the binding of miR-124-3p with PRKAA2 3'UTR was confirmed. Additionally, by using the knockdown lentiviral vectors of miR-124-3p to downregulate the miR-124-3p expression level in endothelial cells, we found that the expression level of PRKAA2 increased accordingly. Taken together, the adhesion of tumor cells had a significant effect on mRNAs and lncRNAs in the endothelial cells, in which PRKAA2 is a notable changed molecule and miR-124-3p could regulate its expression and function in endothelial cells.
Keywords: PRKAA2; bioinformatic analysis; long non-coding RNA; miR-124-3p; tumor-endothelial adhesion.
Copyright © 2021 Pan, Abdureyim, Yao and Li.
Conflict of interest statement
The authors declare that the research was conducted in the absence of any commercial or financial relationships that could be construed as a potential conflict of interest.
Figures
Similar articles
-
Exploring the Molecular Mechanisms of Pterygium by Constructing lncRNA-miRNA-mRNA Regulatory Network.Invest Ophthalmol Vis Sci. 2020 Jul 1;61(8):12. doi: 10.1167/iovs.61.8.12. Invest Ophthalmol Vis Sci. 2020. PMID: 32645133 Free PMC article.
-
Comprehensive analysis of transcriptome-wide expression patterns and a circRNA/lncRNA-miRNA-mRNA network in the pathogenesis of cerebral ischemia in Rattus norvegicus.Am J Transl Res. 2023 Mar 15;15(3):1535-1549. eCollection 2023. Am J Transl Res. 2023. PMID: 37056868 Free PMC article.
-
Exploration and validation of downregulated microRNA-199a-3p, downstream messenger RNA targets and transcriptional regulation in osteosarcoma.Am J Transl Res. 2019 Dec 15;11(12):7538-7554. eCollection 2019. Am J Transl Res. 2019. PMID: 31934299 Free PMC article.
-
PTHR1 May Be Involved in Progression of Osteosarcoma by Regulating miR-124-3p-AR-Tgfb1i1, miR-27a-3p-PPARG-Abca1, and miR-103/590-3p-AXIN2 Axes.DNA Cell Biol. 2019 Nov;38(11):1323-1337. doi: 10.1089/dna.2019.4880. Epub 2019 Sep 19. DNA Cell Biol. 2019. PMID: 31536386
-
E2F7, EREG, miR-451a and miR-106b-5p are associated with the cervical cancer development.Arch Gynecol Obstet. 2019 Apr;299(4):1089-1098. doi: 10.1007/s00404-018-5007-y. Epub 2019 Jan 4. Arch Gynecol Obstet. 2019. PMID: 30607582
Cited by
-
Analysis of extracellular vesicle microRNA profiles reveals distinct blood and lymphatic endothelial cell origins.J Extracell Biol. 2024 Jan 15;3(1):e134. doi: 10.1002/jex2.134. eCollection 2024 Jan. J Extracell Biol. 2024. PMID: 38938681 Free PMC article.
-
Fatty Acid Metabolism Signature Contributes to the Molecular Diagnosis of a Malignant Gastric Cancer Subtype with Poor Prognosis and Lower Mutation Burden.Recent Pat Anticancer Drug Discov. 2024;19(5):666-680. doi: 10.2174/1574892819666230907145036. Recent Pat Anticancer Drug Discov. 2024. PMID: 37691229
-
Potential targets and mechanisms of photobiomodulation for spinal cord injury.Neural Regen Res. 2023 Aug;18(8):1782-1788. doi: 10.4103/1673-5374.361534. Neural Regen Res. 2023. PMID: 36751806 Free PMC article.
-
Integration of Chemoinformatics and Multi-Omics Analysis Defines ECT2 as a Potential Target for Cancer Drug Therapy.Biology (Basel). 2023 Apr 18;12(4):613. doi: 10.3390/biology12040613. Biology (Basel). 2023. PMID: 37106813 Free PMC article.
-
Circular CPM promotes chemoresistance of gastric cancer via activating PRKAA2-mediated autophagy.Clin Transl Med. 2022 Jan;12(1):e708. doi: 10.1002/ctm2.708. Clin Transl Med. 2022. PMID: 35075806 Free PMC article.
References
-
- Diana Vara-Ciruelos M. D., Hardie D. G. (2020). AMP-Activated Protein Kinase: Friend or Foe in Cancer? Annu. Rev. Cancer Biol. 4 1–16. 10.1146/annurev-cancerbio-030419-033619 - DOI
LinkOut - more resources
Full Text Sources
Other Literature Sources
Molecular Biology Databases
Miscellaneous