. 2021 Feb 18:9:607121.
doi: 10.3389/fcell.2021.607121. eCollection 2021.

Loss of Ciliary Gene Bbs8 Results in Physiological Defects in the Retinal Pigment Epithelium

Affiliations

Loss of Ciliary Gene Bbs8 Results in Physiological Defects in the Retinal Pigment Epithelium

Sandra Schneider et al. Front Cell Dev Biol. .

Abstract

Primary cilia are sensory organelles vital for developmental and physiological processes. Their dysfunction causes a range of phenotypes including retinopathies. Although primary cilia have been described in the retinal pigment epithelium (RPE), little is known about their contribution to biological processes within this tissue. Ciliary proteins are increasingly being identified in non-ciliary locations and might carry out additional functions, disruption of which possibly contributes to pathology. The RPE is essential for maintaining photoreceptor cells and visual function. We demonstrate that upon loss of Bbs8, predominantly thought to be a ciliary gene, the RPE shows changes in gene and protein expression initially involved in signaling pathways and developmental processes, and at a later time point RPE homeostasis and function. Differentially regulated molecules affecting the cytoskeleton and cellular adhesion, led to defective cellular polarization and morphology associated with a possible epithelial-to-mesenchymal transition (EMT)-like phenotype. Our data highlights the benefit of combinatorial "omics" approaches with in vivo data for investigating the function of ciliopathy proteins. It also emphasizes the importance of ciliary proteins in the RPE and their contribution to visual disorders, which must be considered when designing treatment strategies for retinal degeneration.

Keywords: Epithelial-to-Mesenchym Transition (EMT); RPE; cilia; ciliopathy; genetic disease; molecular medicine; retinal pigment epithelium.


Conflict of interest statement

The authors declare that the research was conducted in the absence of any commercial or financial relationships that could be construed as a potential conflict of interest.

Figures
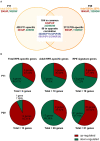
Figure 1
Figure 1
Loss of Bbs8 induces a switch in RPE-specific gene expression from P11 to P29. (A) Venn diagram showing differentially expressed genes (DEGs) obtained via transcriptomic analysis. The number of specific and common DEGs and the orientation of expression are shown. DW, down-regulated; UP, up-regulated. (B) Pie charts depicting % up- or down-regulated genes for three different categories; fetal RPE-specific genes, adult RPE-specific genes and RPE signature genes. At P11 all categories have an increased down-regulation. At P29 fetal RPE-specific genes and RPE signature genes become up-regulated.
Figure 2
Figure 2
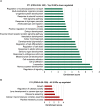
Identification of the biological processes underlying the effect of the deletion of Bbs8 at P11 via gene ontology analysis. Top 25 significant Biological processes (BPs) among the inhibited transcripts (A) and the 6 induced (B) in Bbs8−/− vs. Bbs8+/+. The Enrichment score for each BP cluster is plotted on the x-axis.
Figure 3
Figure 3
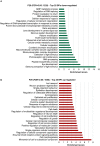
Identification of the biological processes underlying the effect of deletion of Bbs8 at P29 via gene ontology analysis. Top 25 significant Biological pathways (BPs) among the inhibited transcripts (A) and the induced (B) in Bbs8−/− vs. Bbs8+/+ are plotted. The Enrichment score for each BP cluster is plotted on the x-axis.
Figure 4
Figure 4
GOEA of commonly regulated DEGs from Bbs8−/− RPE at P11 and P29. (A) We identified three clusters of Biological processes (BP) that were significantly up-regulated and three that were significantly down-regulated at both time points. Terms are ranked according to the Enrichment score of each BP cluster. Light bright green bar denotes photoreceptor-specific genes. DW, down-regulated; UP, up-regulated. (B) Heatmap of differentially regulated genes associated with processes in A.
Figure 5
Figure 5
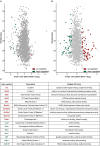
Proteomic analysis shows an increase in mis-regulated proteins in P29 Bbs8−/− RPE. (A) Volcano plot showing significantly up-regulated (red) and down-regulated (green) proteins in P11 Bbs8−/− RPE compared to controls. (B) Volcano plot showing significantly up-regulated (red) and down-regulated (green) proteins in P11 Bbs8−/− RPE compared to controls. (C) Comparison of Proteome and Transcriptome data. Chart shows commonly up or down-regulated molecules at P29 with gene symbols, descriptions and related GO terms.
Figure 6
Figure 6
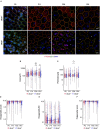
Cell morphological defects are seen in Bbs8-deficient RPE. (A) Representative images of RPE flatmounts stained for F-actin (red) and ZO-1 (green) to visualize cytoskeleton and cell membrane. DAPI was used to stain nuclear DNA. P11 Bbs8−/− RPE shows discontinuous membrane staining (arrowheads). Starting in P29 Bbs8−/− RPE shows larger areas of RPE cells with distorted or even completely disrupted cell membranes (asterisks). Scale bars: 10 μm. (B–F) Quantification of cell morphology parameters. Statistical analysis is described in methods. (B) Comparison of cell area of Bbs8−/− and Bbs8+/+ RPE cells reveals an increase of the mean (p = 6.43 x 10−45) and the variance (p = 5.28 x 10−52) of P29 Bbs8−/− RPE cells and an increase of variance (p = 0.0013) of P81 Bbs8−/− RPE cells. (C) Comparison of cell perimeter of Bbs8−/− and Bbs8+/+ RPE cells reveals an increase of the mean (p = 0.0342) and the variance (p = 0.0272) of P29 Bbs8−/− RPE cells. (D) Comparison of hexagonality score of Bbs8−/− and Bbs8+/+ RPE cells. The blue line depicts a trend toward cells being less hexagonal in the mutant over time. The opposite trend (red line) is observed in Bbs8+/+ RPE. (E) The standard deviation of the hexagonality score trends upwards in the mutant (blue line). The opposite trend is observed in Bbs8+/+ RPE (red line). (F) Comparison of polygonality score of Bbs8−/− and Bbs8+/+ RPE cells reveals a trend to more polygonal cells in Bbs8−/− RPE with higher age (blue line). The opposite trend is observed in Bbs8+/+ RPE (red line). (n: P0 Bbs8+/+ = 1,492 cells, P0 Bbs8−/− = 1,030 cells, P11 Bbs8+/+ = 1,536 cells, P11 Bbs8−/− = 1,755 cells, P29 Bbs8+/+ = 331 cells, P29 Bbs8−/− = 383 cells, P81 Bbs8+/+ = 1,128 cells, P81 Bbs8−/− = 1,315 cells) Significance levels: mean: > 0.05 not significant (ns), ≤0.05*, ≤0.01**, ≤0.001***; variance: > 0.05 not significant (ns), ≤0.05#, ≤0.01##, ≤0.001###.
Figure 7
Figure 7
Deletion of Bbs8 leads to defects in RPE function. (A) Representative images of RPE flatmounts stained for p-ERM (red) and F-actin (green) to visualize apical microvilli and the cytoskeleton. DAPI was used to stain nuclear DNA. P11 Bbs8−/− RPE shows abnormal accumulations of p-ERM staining (arrowheads). Staining of p-ERM is dramatically reduced as the tissue ages. Bbs8+/+ RPE shows consistent staining at all ages. Scale bars: 10 μm. (B) Retinal adhesion assay. Quantification of melanin attached to the retina is significantly increased in P16 Bbs8−/− compared to controls (p < 0.0001). Statistical analysis was performed using ROUT test (Q = 0.1 %) identified 2 outliers before using unpaired t-test (n: Bbs8−/− = 14, Bbs8+/+ = 8). (C) Phagocytosis assay. Quantification of photoreceptor outer segments (POS) uptake reveals a significant increase in bound POS (p = 0.0025) and a significant down-regulation in internalized POS (p = 0.0025) in BBS8 KD ARPE-19 cells compared to controls. Statistical analysis was performed using ROUT test (Q = 10%) identified 1 outliers before doing a one-way ANOVA and Tukey post-hoc test (n: BBS8 KD = 9, NTC = 7–8). Significance levels: ≤0.01**, ≤0.001***.
Figure 8
Figure 8
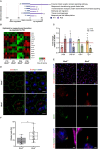
Loss of Bbs8 induces EMT- like traits in the RPE. (A) GO terms associated with differentially expressed genes that were initially down-regulated at P11 and then up-regulated at P29. (B) Heatmap showing DEGs associated with epithelial-to-mesenchymal transition in the four experimental groups. shi (C) Quantitative gene expression shows a shift toward EMT-like associated gene expression profiles between P11 and P29. Snail expression shifts from down-regulation at P11 (p = 0.0073) toward up-regulation at P29 (p = 0.0096). Expression of Cldn19, Cdh1, and Tjp1 shifts from an up-regulation (Cldn19: p = 0.2681, Cdh1: p = 0.0180 and Tjp1: p = 0.3439) at P11 toward a down-regulation at P29 (Cldn19: p = 0.0919, Cdh1: p = 0.0189 and Tjp1: p = 0.0028) (P11 n: Bbs8−/− = 3–4, Bbs8+/+ = 4; P29 n: Bbs8−/− = 3–5, Bbs8+/+ = 3–5). Statistical analysis was performed using one sample t-test. Cdh1: E-cadherin, Cldn19: Claudin 19, Snail: Snail, Tjp1: tight-junction protein 1. (D) Representative images of P11 RPE flatmounts stained for Snail (red) and ZO-1 (green). DAPI was used to stain nuclear DNA. P11 Bbs8−/− RPE shows an increase in Snail expression especially in cells with disrupted morphology. Scale bars: 10 μm. (E) Representative images of RPE flatmounts at P29, stained for primary cilia using Arl13b (red) and Gt335 (green). F-Actin (magenta) was stained to visualize the cytoskeleton and DAPI was used to stain nuclear DNA. Higher magnifications are indicated in the image by a square. Scale bars: 10 μm, higher magnifications 1 μm. (F) Quantification of ciliated cells in P29 Bbs8 RPE showing a significant increase in ciliation in Bbs8-deficient RPE compared to control (p = 0.0011) (n: Bbs8−/− = 4 eyes, 340 cells, Bbs8+/+ = 2 eyes, 157 cells). Statistical analysis was performed using unpaired t-test. Significance levels: > 0.05 not significant (ns), ≤ 0.05*, ≤ 0.01**, ≤ 0.001***.

Similar articles

Cited by

References

    1. Adijanto J., Castorino J. J., Wang Z. X., Maminishkis A., Grunwald G. B., Philp N. J. (2012). Microphthalmia-associated transcription factor (MITF) promotes differentiation of human retinal pigment epithelium (RPE) by regulating microRNAs-204/211 expression. J. Biol. Chem. 287, 20491–20503. 10.1074/jbc.M112.354761 - DOI - PMC - PubMed
    1. Agostini M., Romeo F., Inoue S., Niklison-Chirou M. V., Elia A. J., Dinsdale D., et al. . (2016). Metabolic reprogramming during neuronal differentiation. Cell Death Differ. 23, 1502–1514. 10.1038/cdd.2016.36 - DOI - PMC - PubMed
    1. Anders S., Pyl P. T., Huber W. (2015). HTSeq-A Python framework to work with high-throughput sequencing data. Bioinformatics 31, 166–169. 10.1093/bioinformatics/btu638 - DOI - PMC - PubMed
    1. Ansley S. J., Badano J. L., Blacque O. E., Hill J., Hoskins B. E., Leitch C. C., et al. . (2003). Basal body dysfunction is a likely cause of pleiotropic Bardet-Biedl syndrome. Nature 425, 628–633. 10.1038/nature02030 - DOI - PubMed
    1. Bates D., Mächler M., Bolker B., Walker S. (2015). Fitting linear mixed-effects models using lme4. J. Stat. Softw. 67, 201–210. 10.18637/jss.v067.i01 - DOI