

Global, regional, and national dengue burden from 1990 to 2017: A systematic analysis based on the global burden of disease study 2017
- PMID: 33681736
- PMCID: PMC7910667
- DOI: 10.1016/j.eclinm.2020.100712
Global, regional, and national dengue burden from 1990 to 2017: A systematic analysis based on the global burden of disease study 2017
Abstract
Background: Dengue is one of the most common vector-borne diseases globally, however, its burden is poorly quantified. Hence, we aimed to report the dengue burden in 195 countries and territories between 1990 and 2017, using data from the Global Burden of Diseases, Injuries, and Risk Factors Study 2017.
Methods: Following the methodology framework and analytical strategies used in the Global Burden of Disease Study 2017, we analysed the incidence, mortality, and disability-adjusted life years (DALYs) of dengue in geographically defined populations worldwide between 1990 and 2017. We also determined the association between development levels and dengue burden. All estimates were reported as numbers and rates per 100 000 population, with 95% uncertainty intervals.
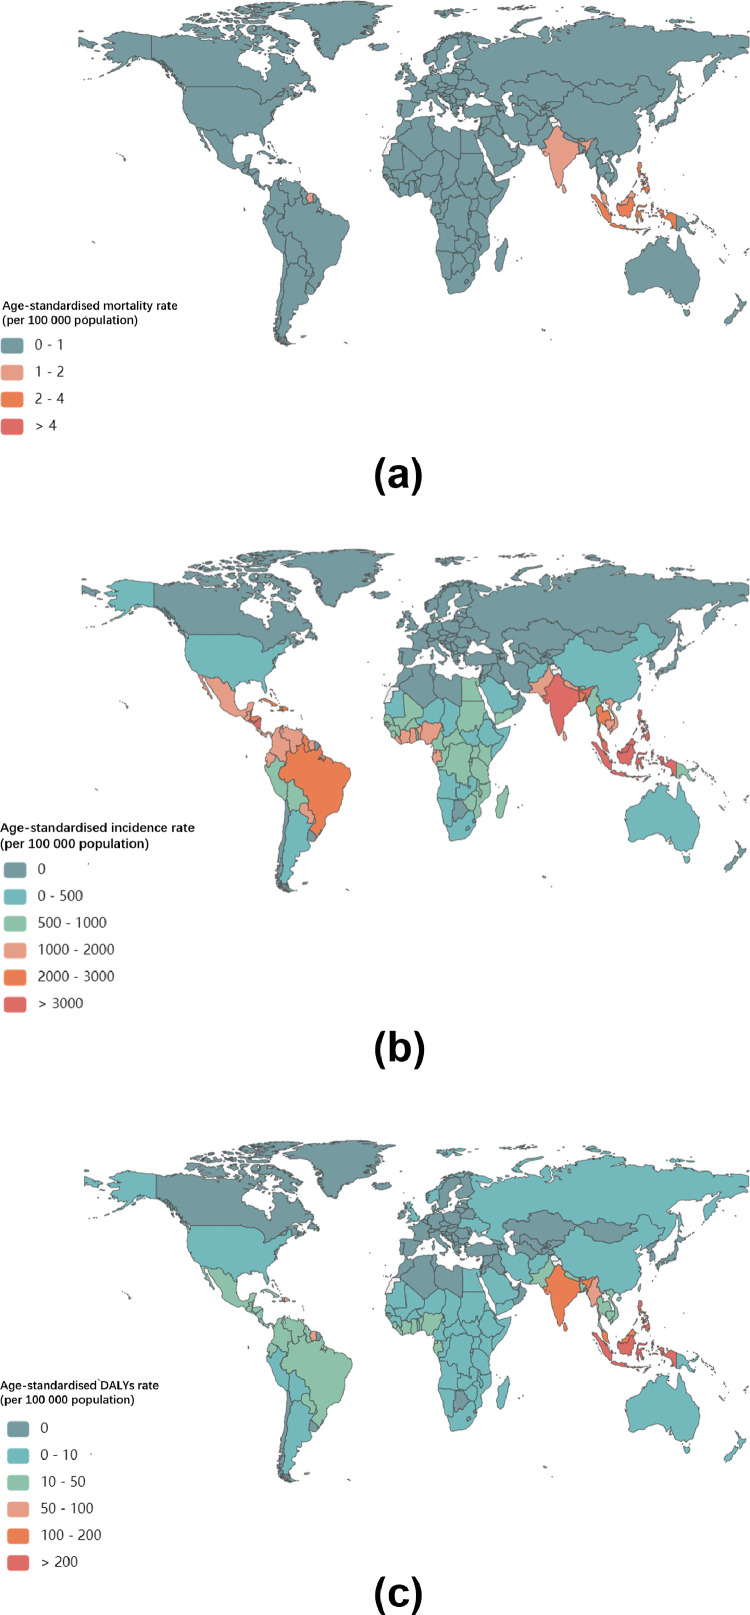
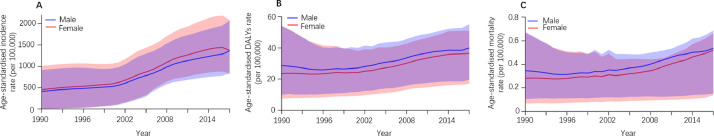
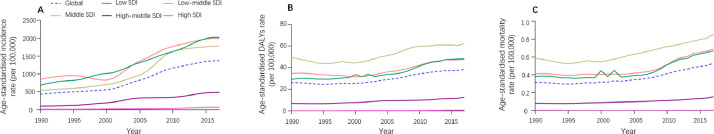
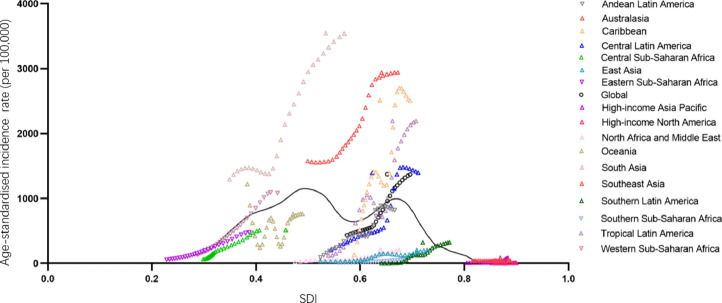
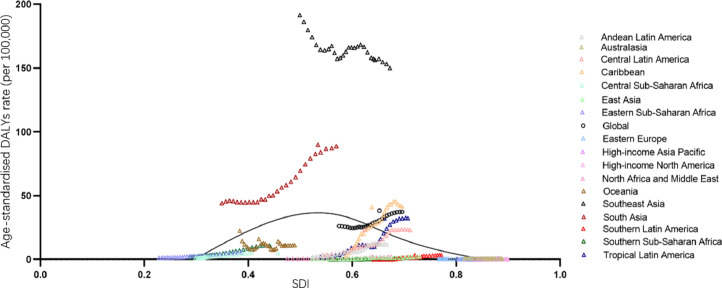
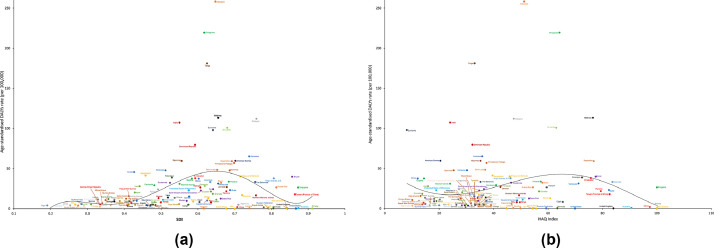
Findings: Globally, the total number of dengue cases increased from 23 283 274 (95% UI 453 180.7-51 840 670) in 1990 to 104 771 911 (95% UI 63 759 019-158 870 031) in 2017. The age-standardised incidence rate increased from 431.6 (8.4-961.0) per 100 000 population in 1990 to 1371.3 (834.5-2079.3) per 100 000 population in 2017. In addition, the number of deaths due to dengue increased from approximately16 957 (7 613-30 091) in 1990 to 40 467 (17 620-49 778) in 2017. Meanwhile, the global age-standardised death rate increased from 0.31 (0.14-0•56) per 100 000 population in 1990 to 0.53 (0.23-0•65) per 100 000 population in 2017. Overall, there were 2 922 630 DALYs (1 629 424-3 967 492) attributed to dengue in 2017 globally, an increase of 107.6% since 1990 (1 407 571 DALYs [624 016.4-2 510 025]), and the age-standardised DALY rate increased from 26.10 (11.57-46.53) per 100 000 population to 38.25 (21.33-51.93) per 100 000 population between 1990 and 2017. The association between socio-demographic index (SDI) and dengue-related DALYs suggested that the lowest age-standardised DALY rates were found in countries in the low and high-SDI quintile in 2017, and from 1990 to 2017, the age-standardized DALY rate tended to increase in regions with the lowest SDI but declined in regions with the highest SDI. There was a nonlinear association between the socio-demographic index and the healthcare access and quality index and age-standardised DALY rates.
Interpretation: Dengue is a major public health challenge worldwide. While there is remarkable international variation in its incidence, the dengue burden is increasing globally. The results of this study could be useful for policy makers to implement cost-effective interventions and reduce the dengue burden, particularly in countries with high incidence or increasing burden.
Funding: This work was supported by a grant from the National Natural Science Foundation of China (NSFC) (grant numbers 81,800,041 and 82,000,078).
Keywords: Burden; Dengue; GBD 2017; Incidence.
© 2020 The Author(s).
Conflict of interest statement
The authors declare no potential conflicts of interest with respect to the research, authorship, and/or publication of this article.
Figures
References
-
- Simmons C.P., Farrar J.J., Nguyen v.V., Wills B. Dengue. N Engl J Med. 2012;366(15):1423–1432. - PubMed
-
- World Health Organization. Dengue and severe dengue. https://www.who.int/news-room/fact-sheets/detail/dengue-and-severe-dengue. 2020.
-
- World Health Organization. Dengue: guidelines for diagnosis, treatment, prevention and control. https://www.who.int/neglected_diseases/resources/9789241547871/en/. 2009. - PubMed
-
- Wilder-Smith A., Ooi E.E., Horstick O., Wills B. Dengue. Lancet. 2019;393(10169):350–363. - PubMed
LinkOut - more resources
Full Text Sources
Other Literature Sources
