. 2021 Feb;2(2):141-156.
doi: 10.1038/s43018-020-00159-4. Epub 2021 Jan 11.

Pathway-based classification of glioblastoma uncovers a mitochondrial subtype with therapeutic vulnerabilities

Affiliations

Pathway-based classification of glioblastoma uncovers a mitochondrial subtype with therapeutic vulnerabilities

Luciano Garofano et al. Nat Cancer. 2021 Feb.

Abstract

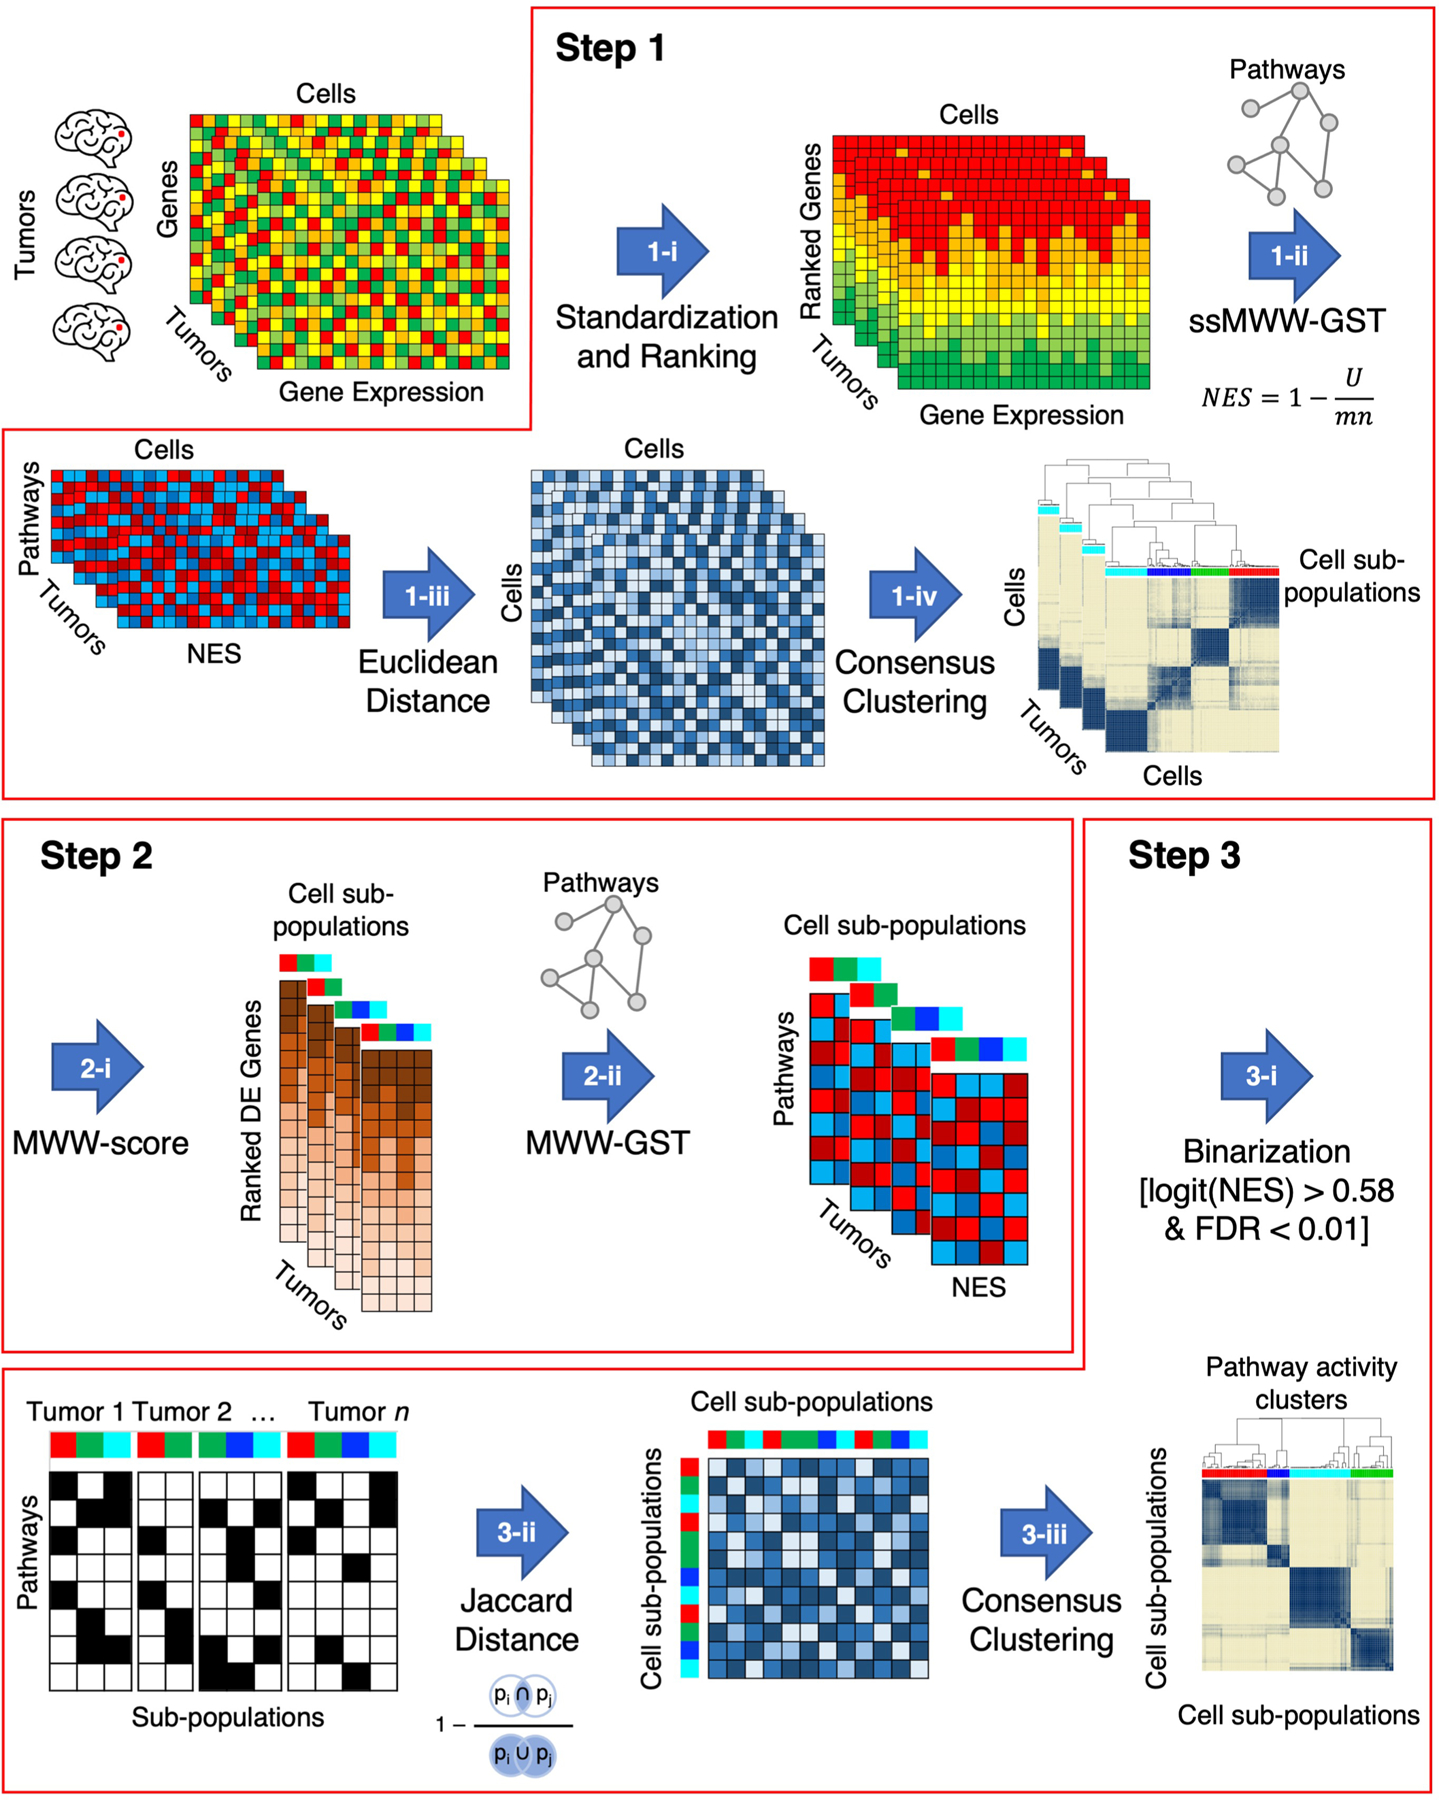
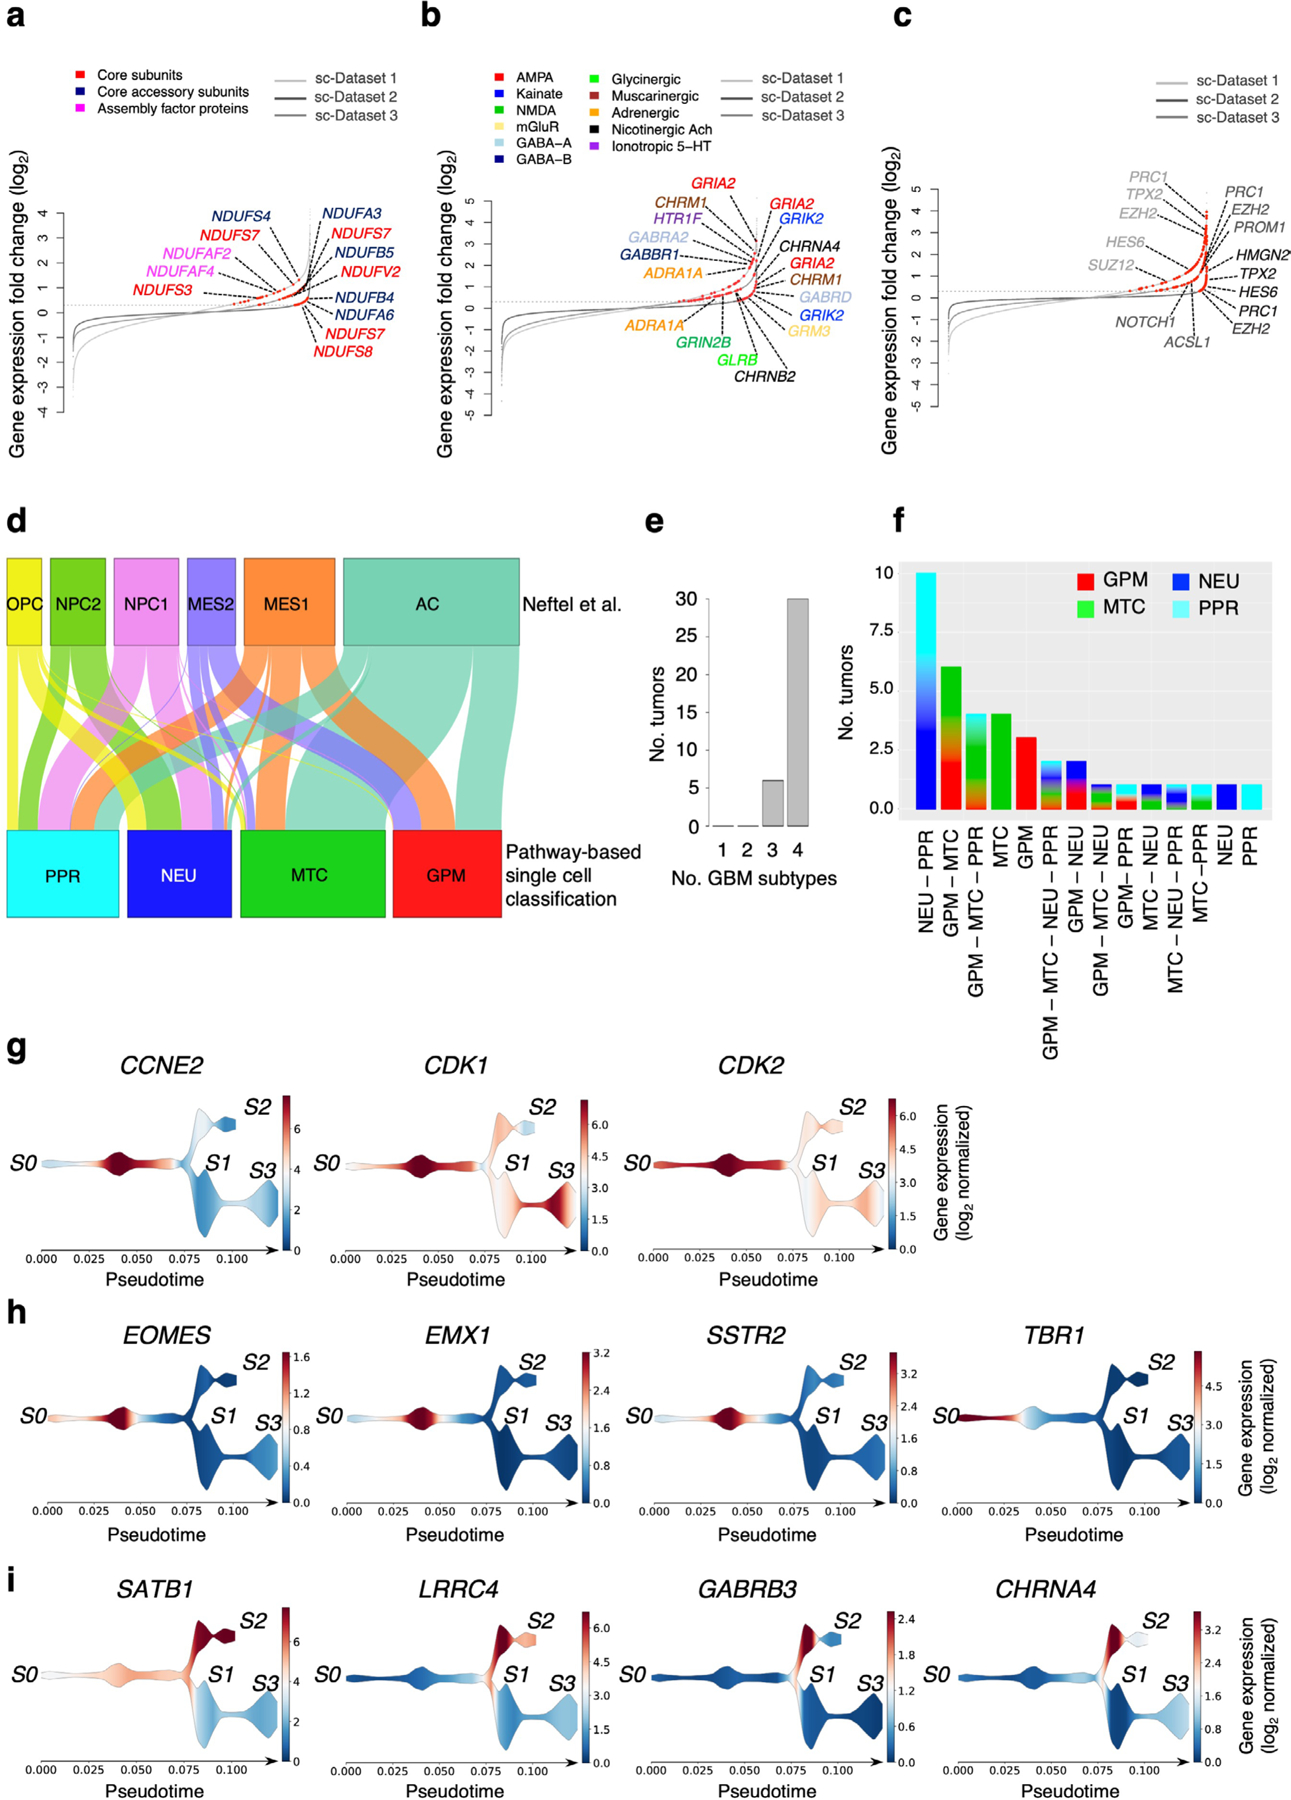
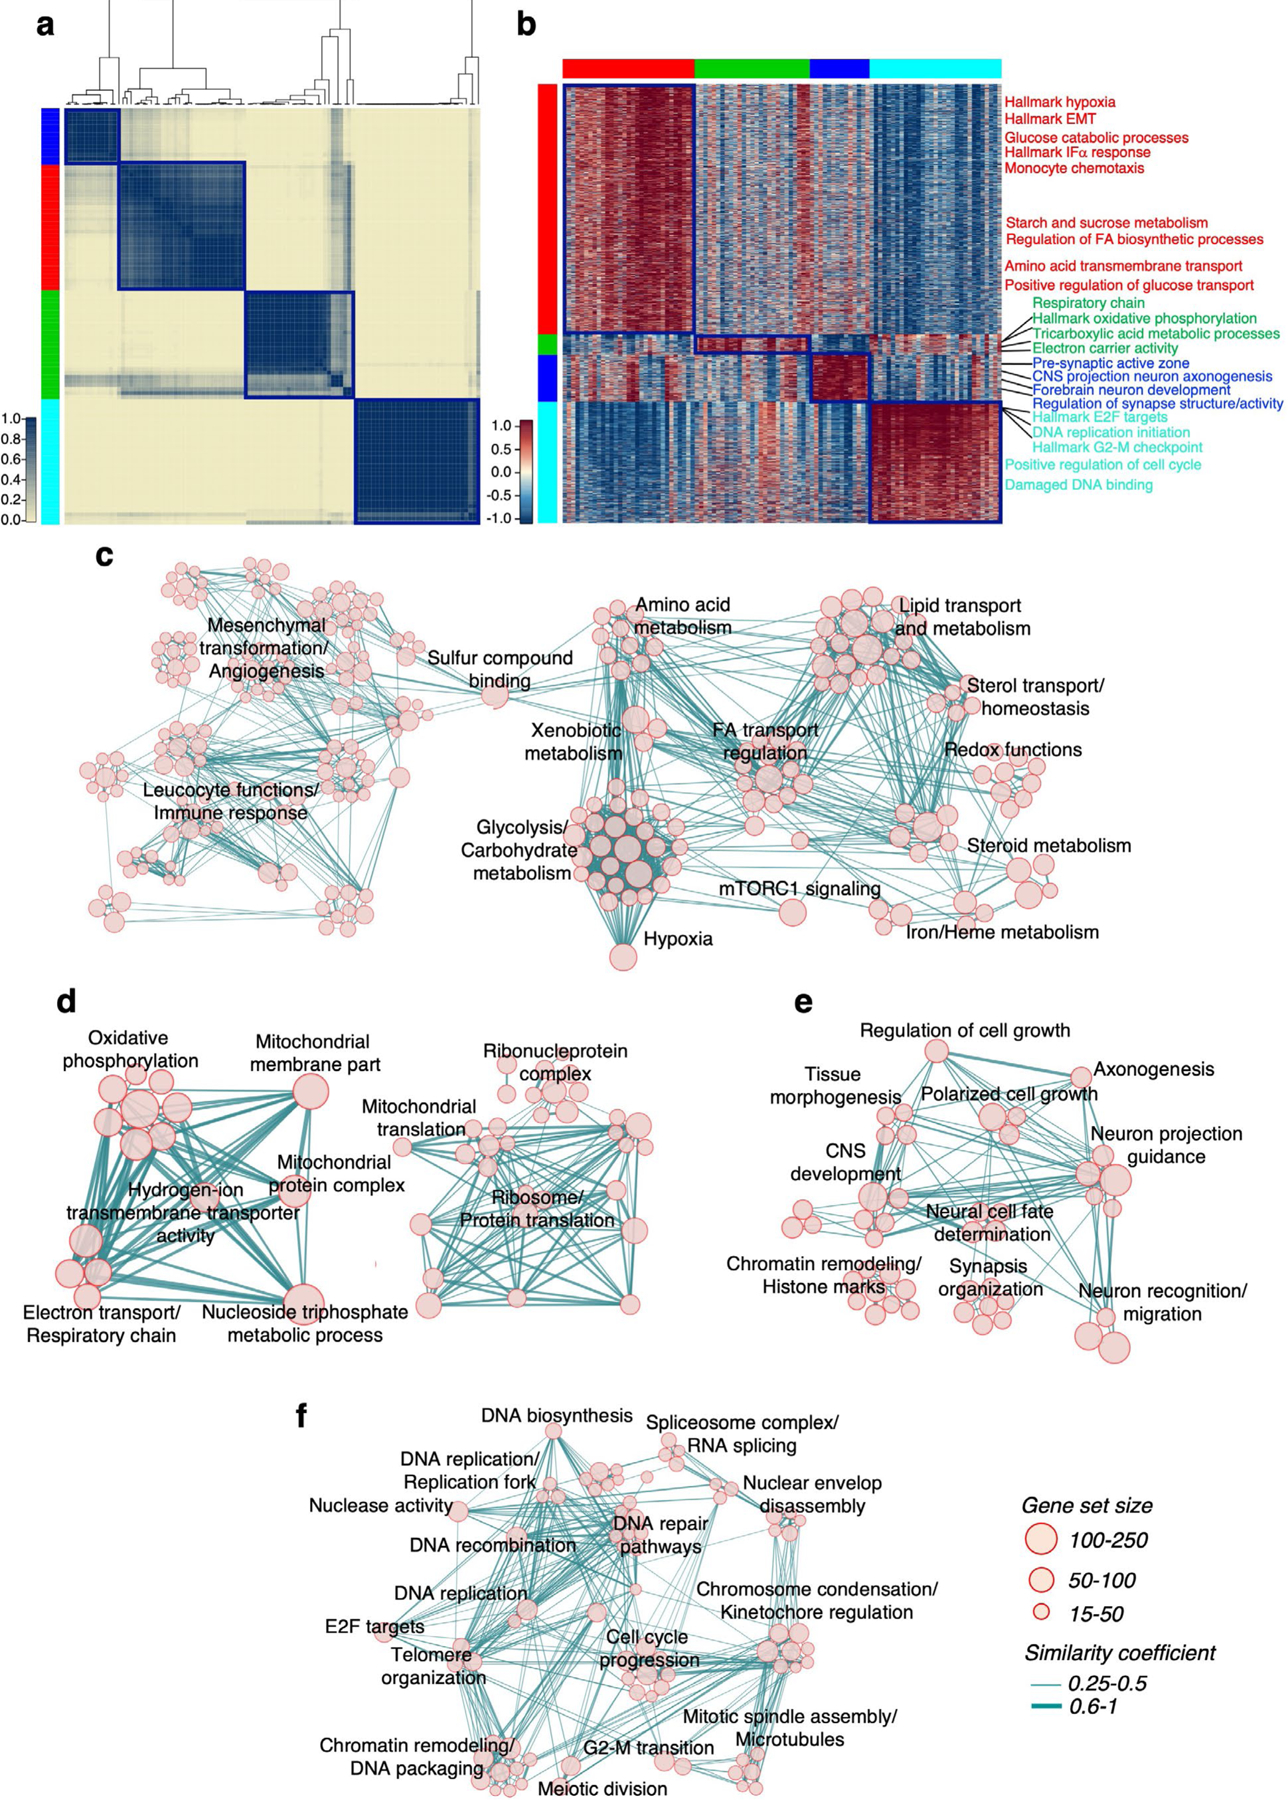
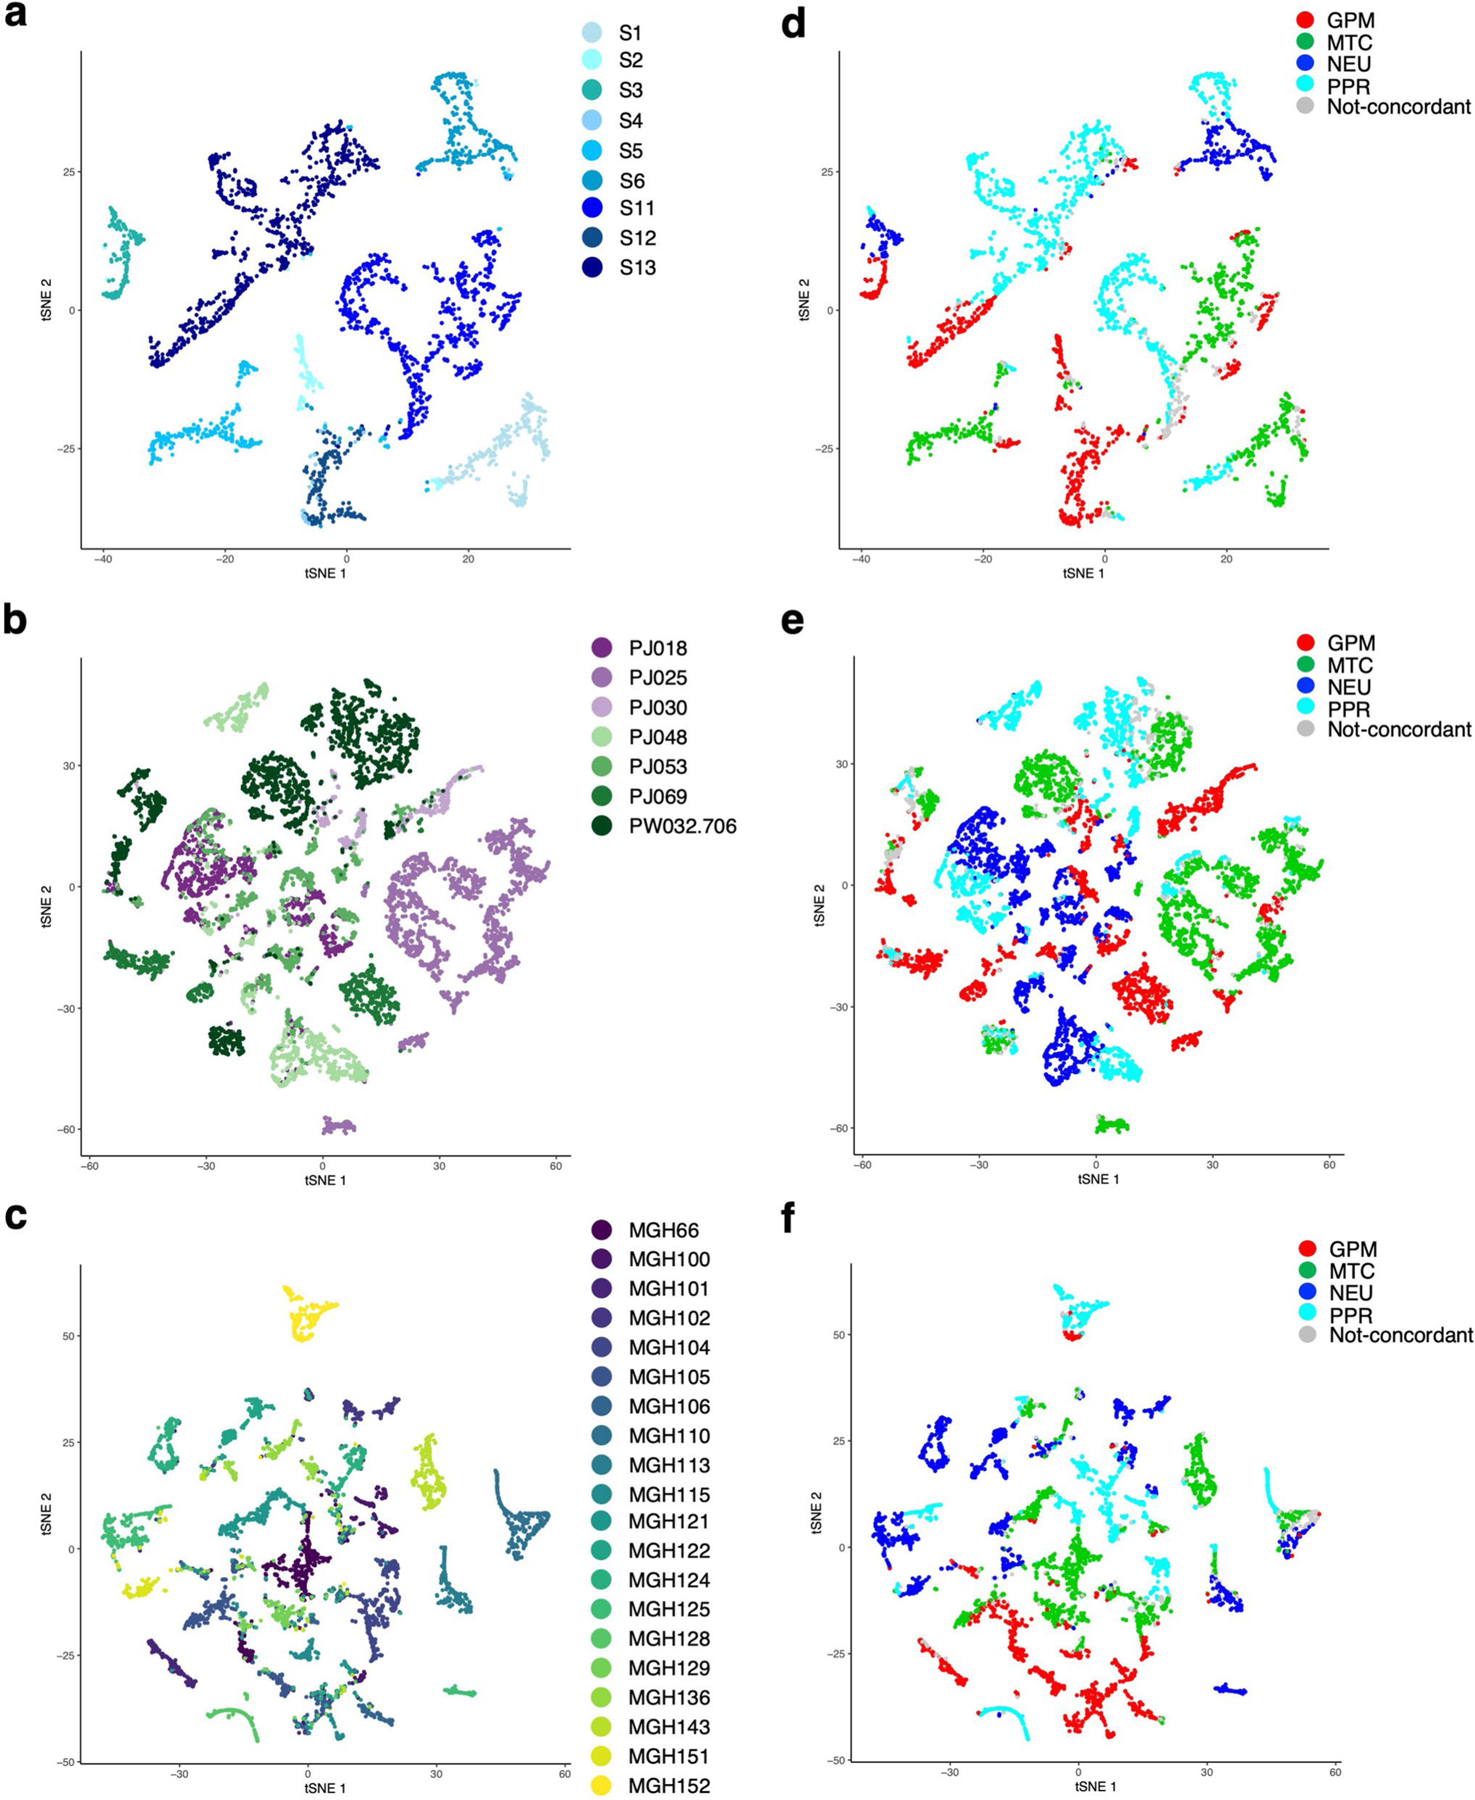
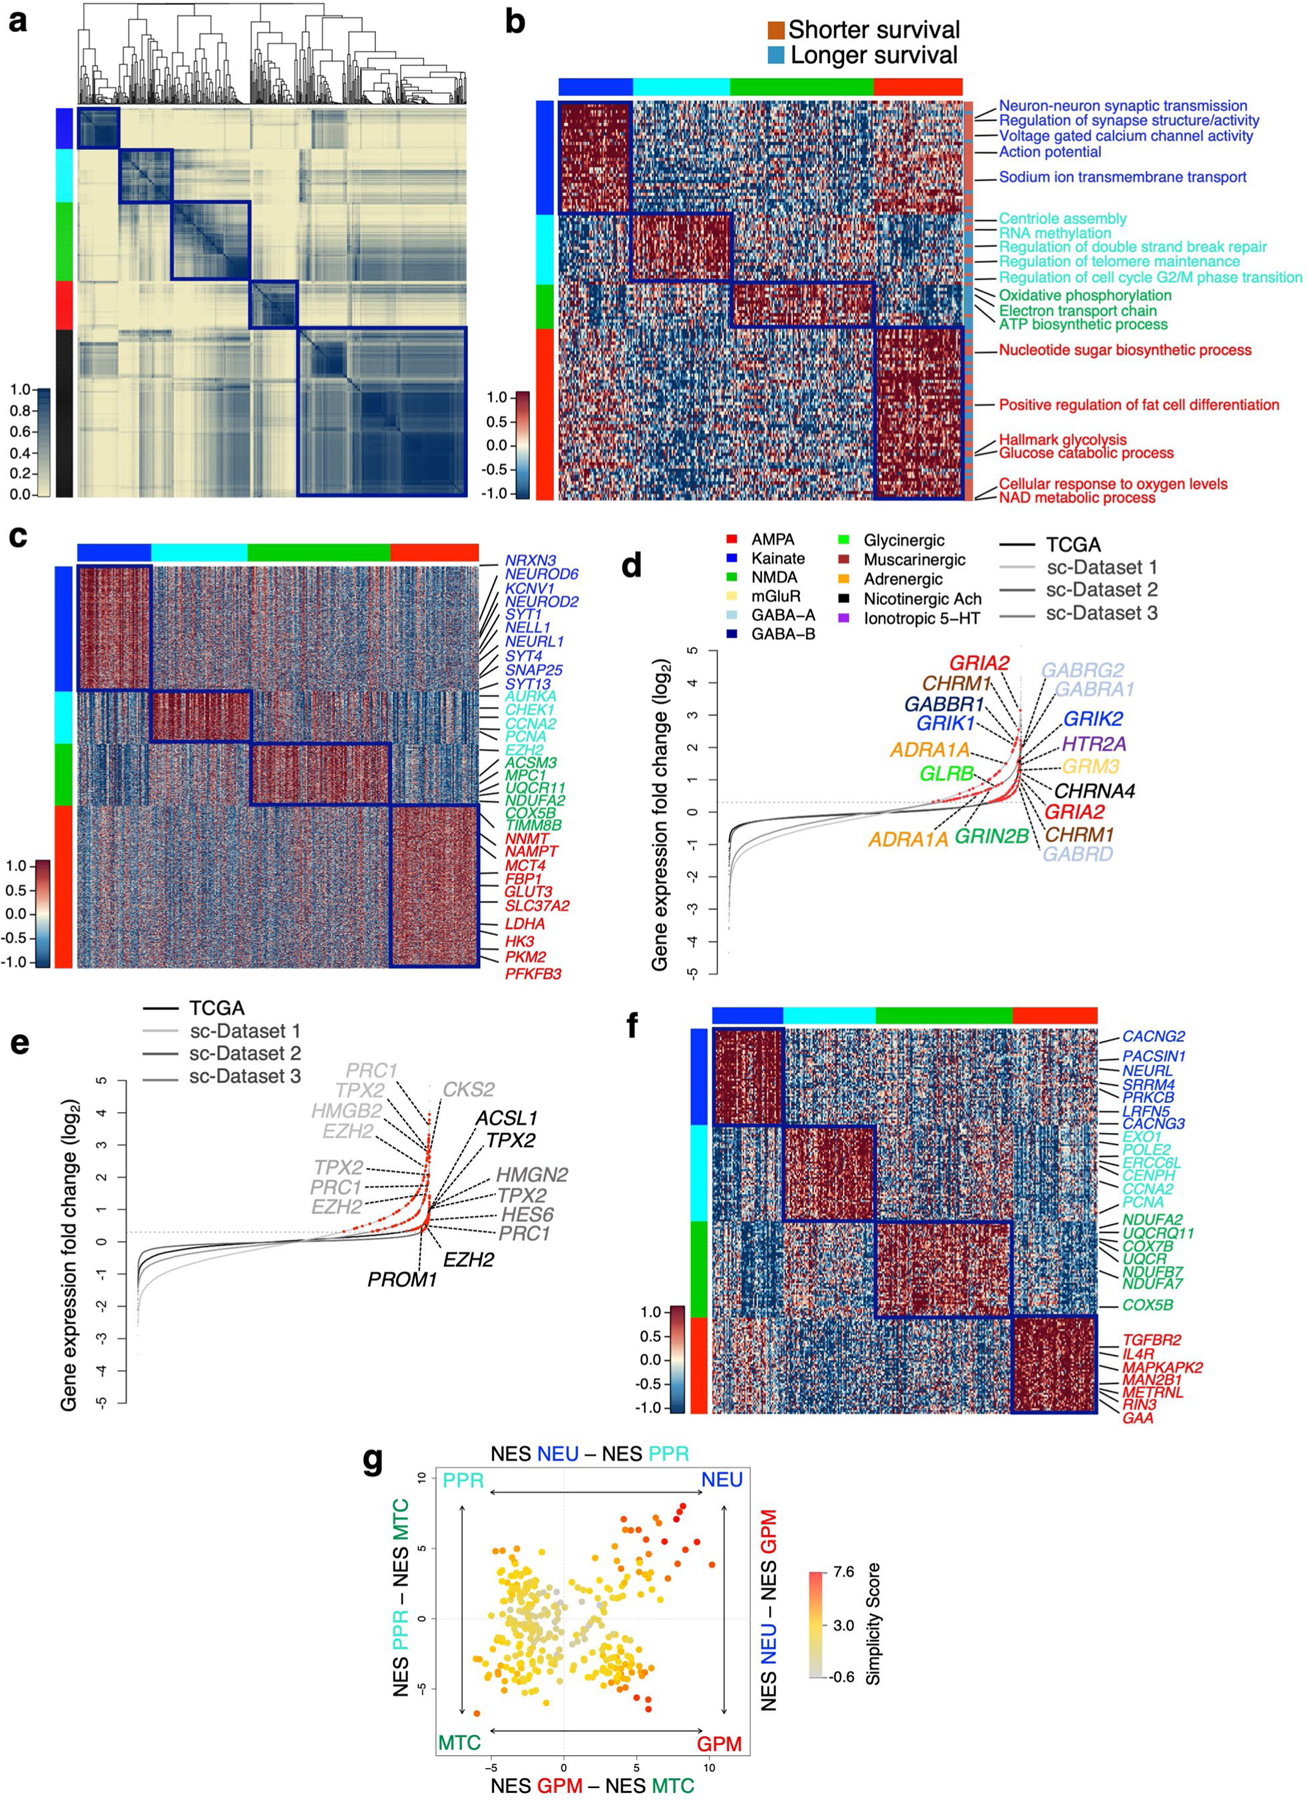
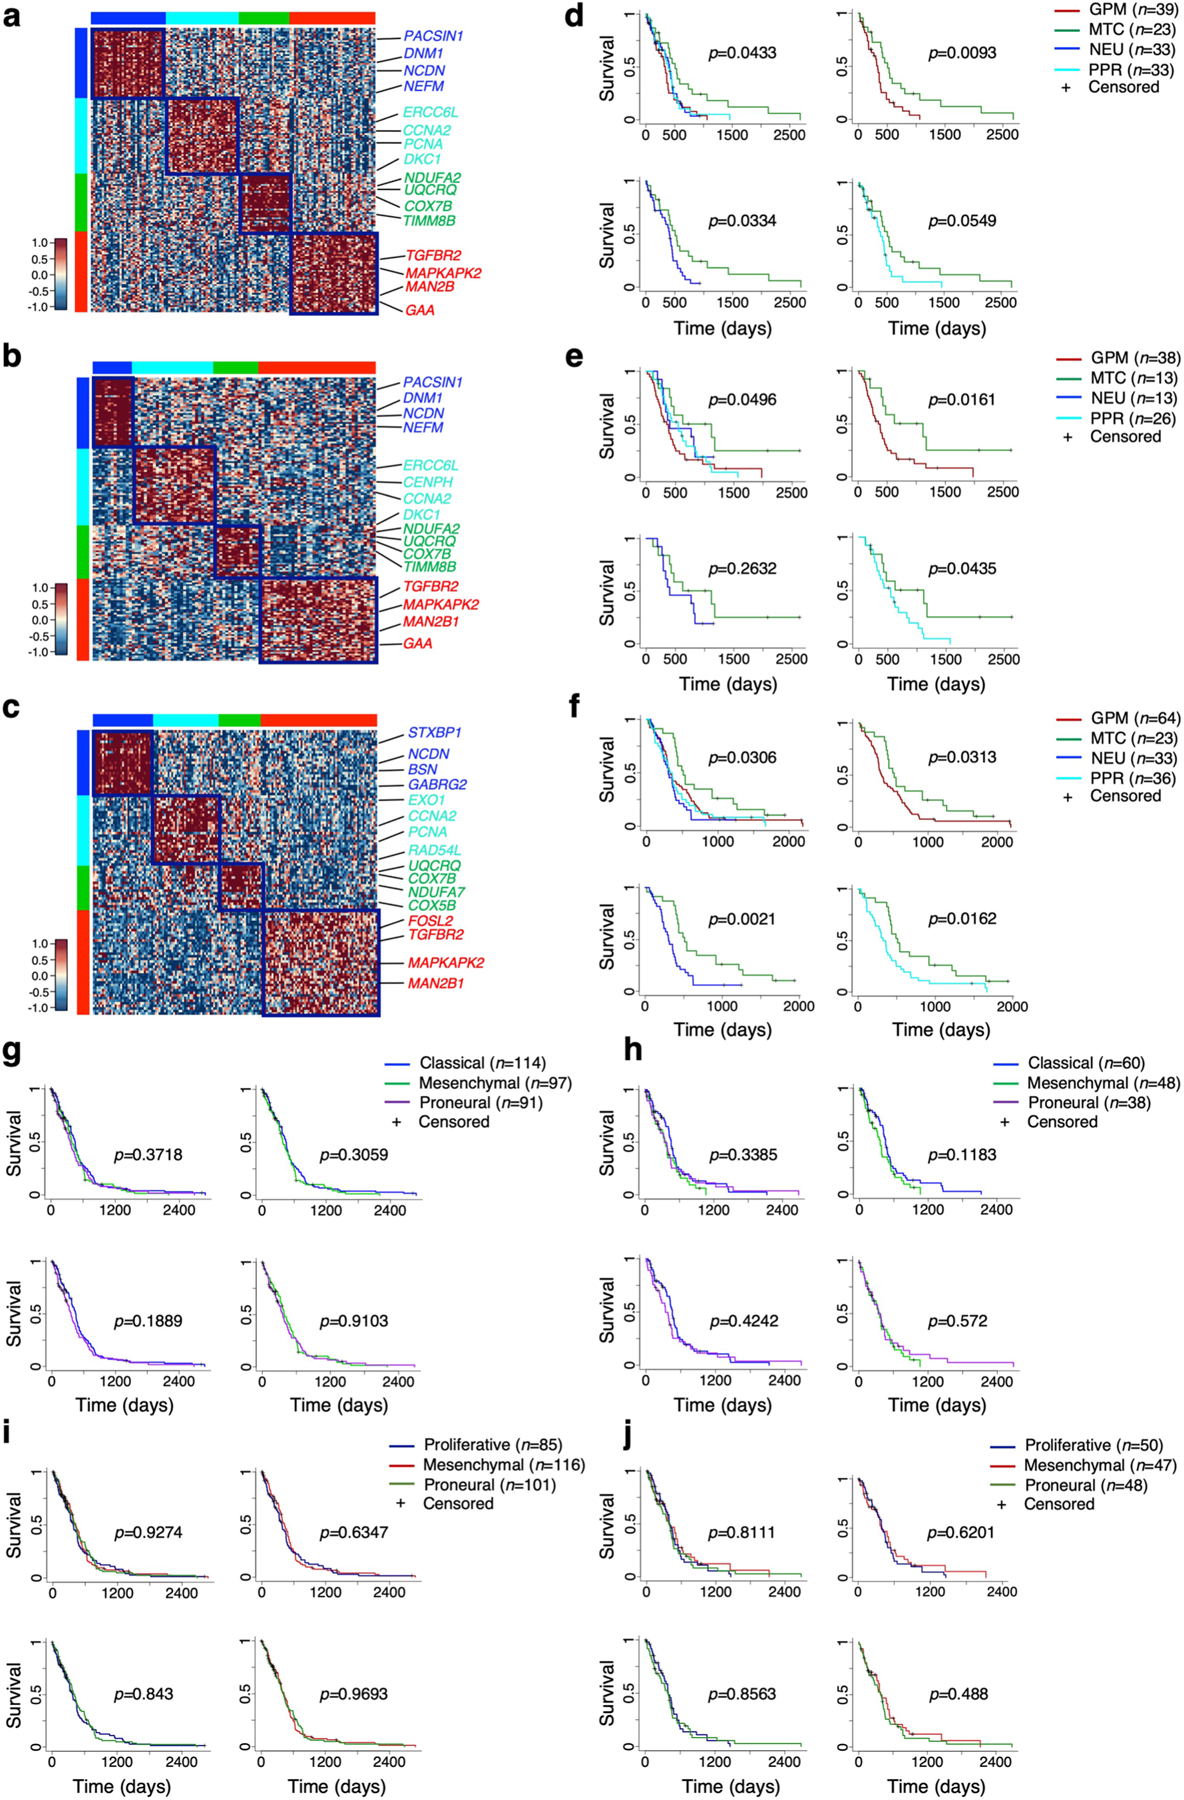
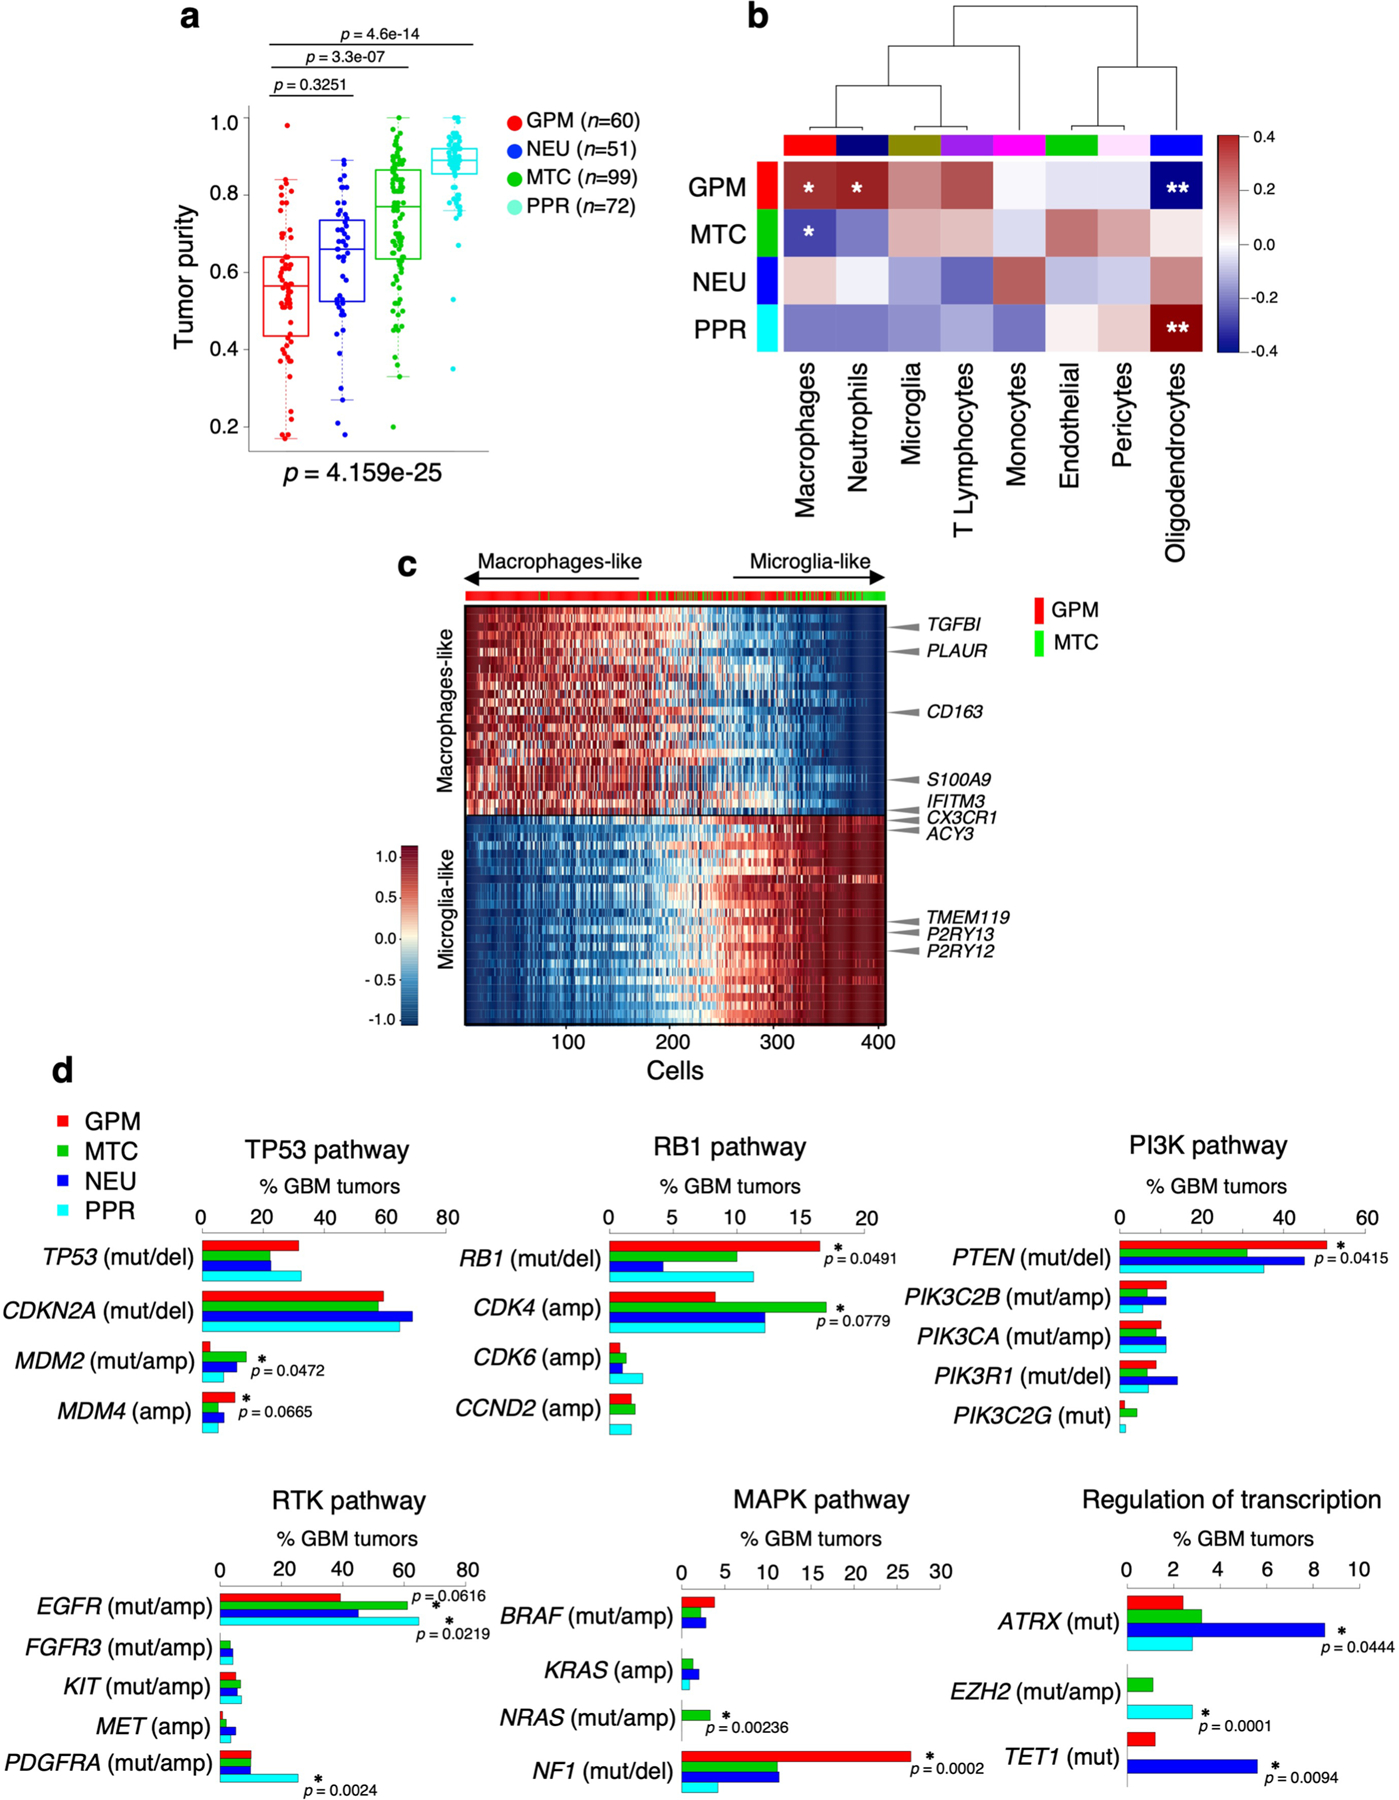
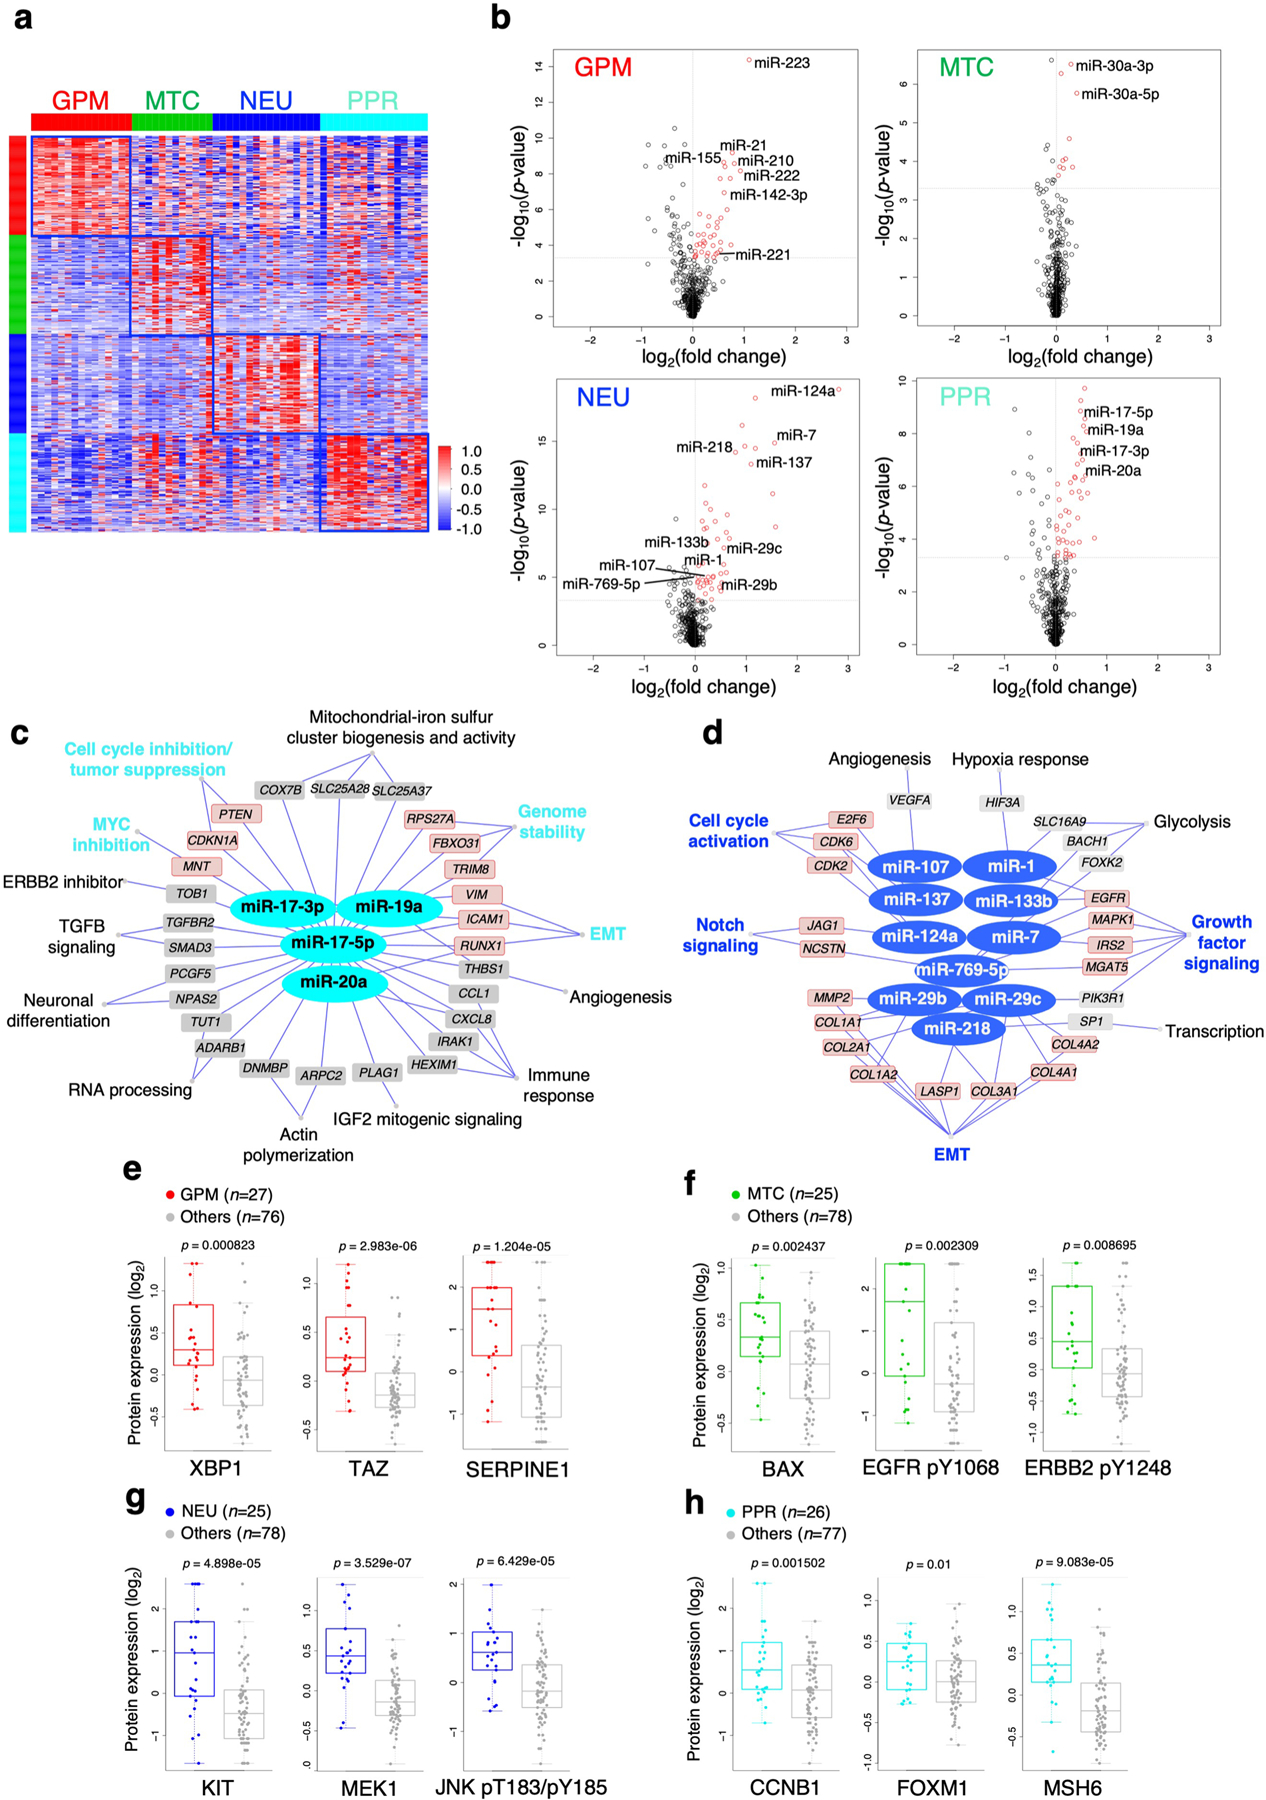
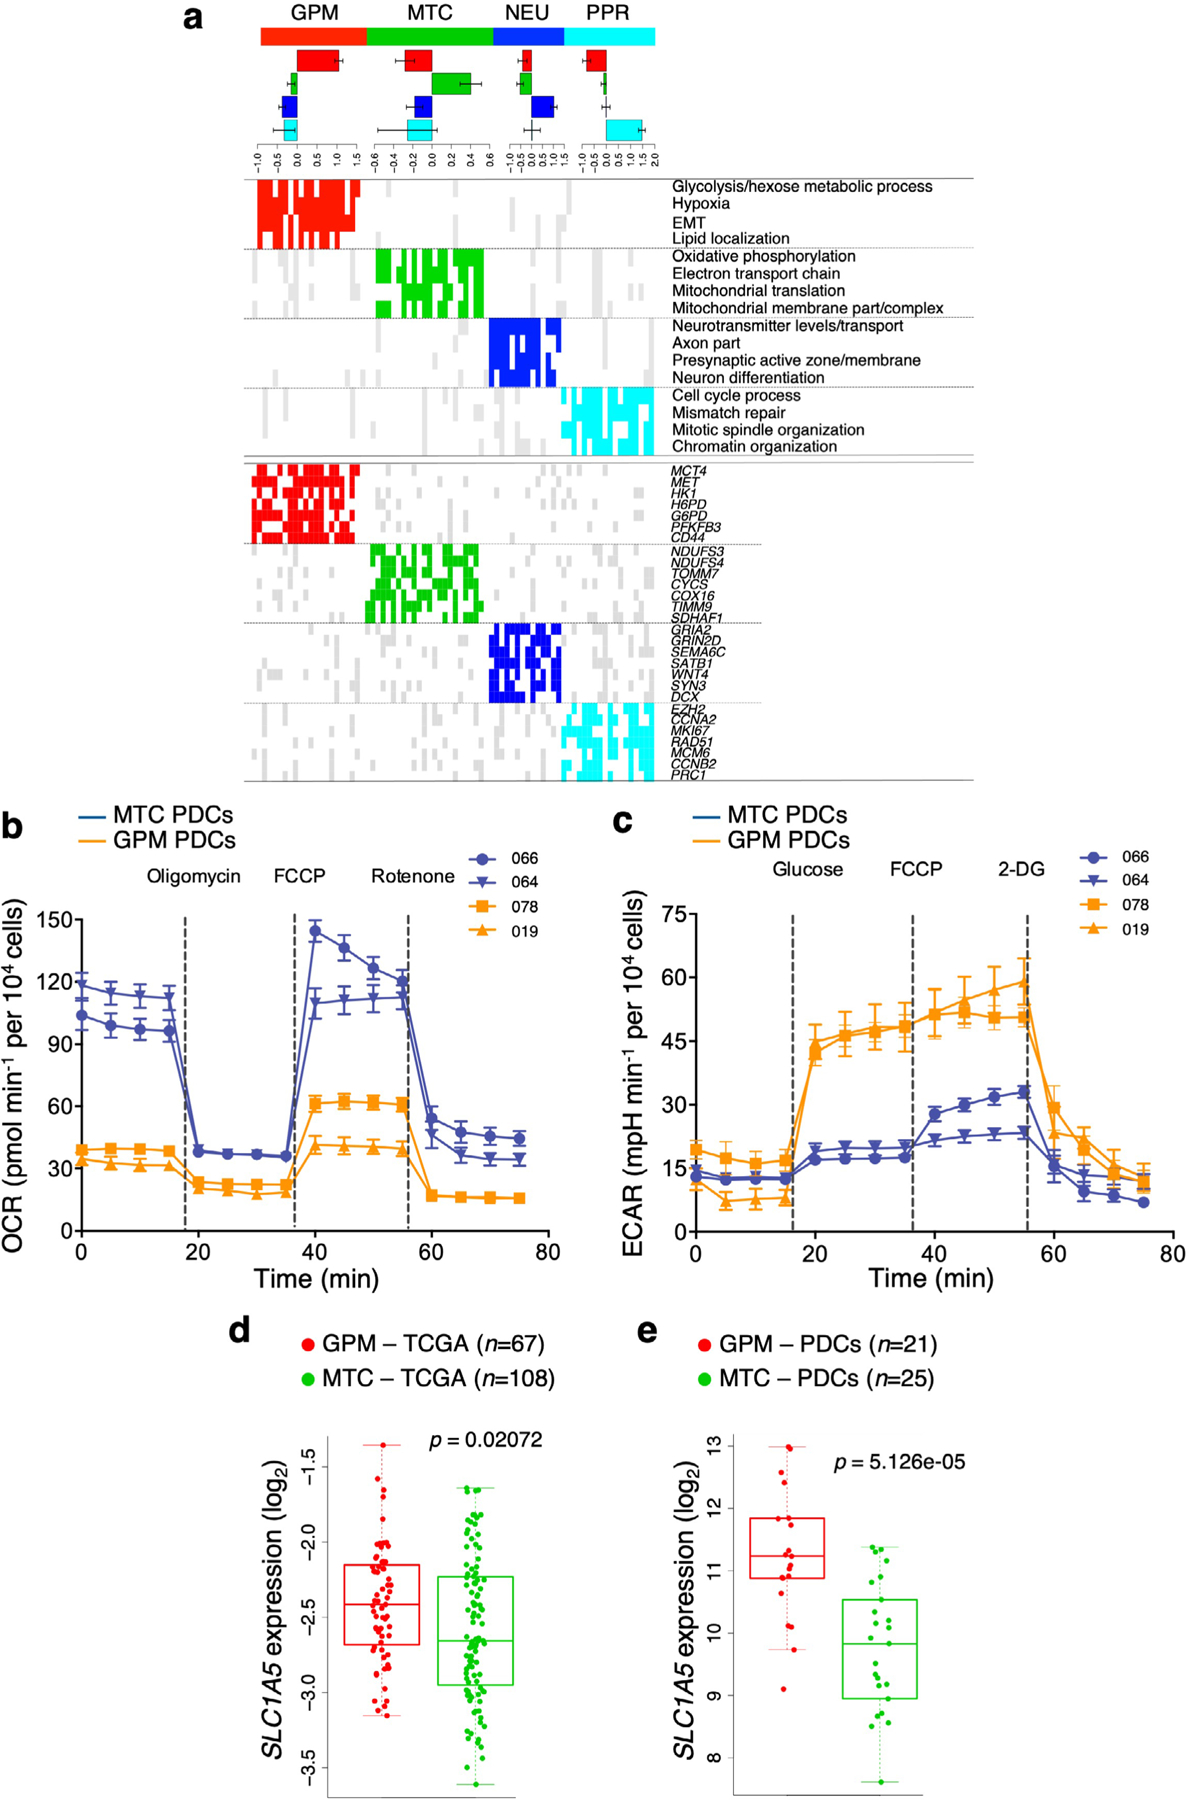
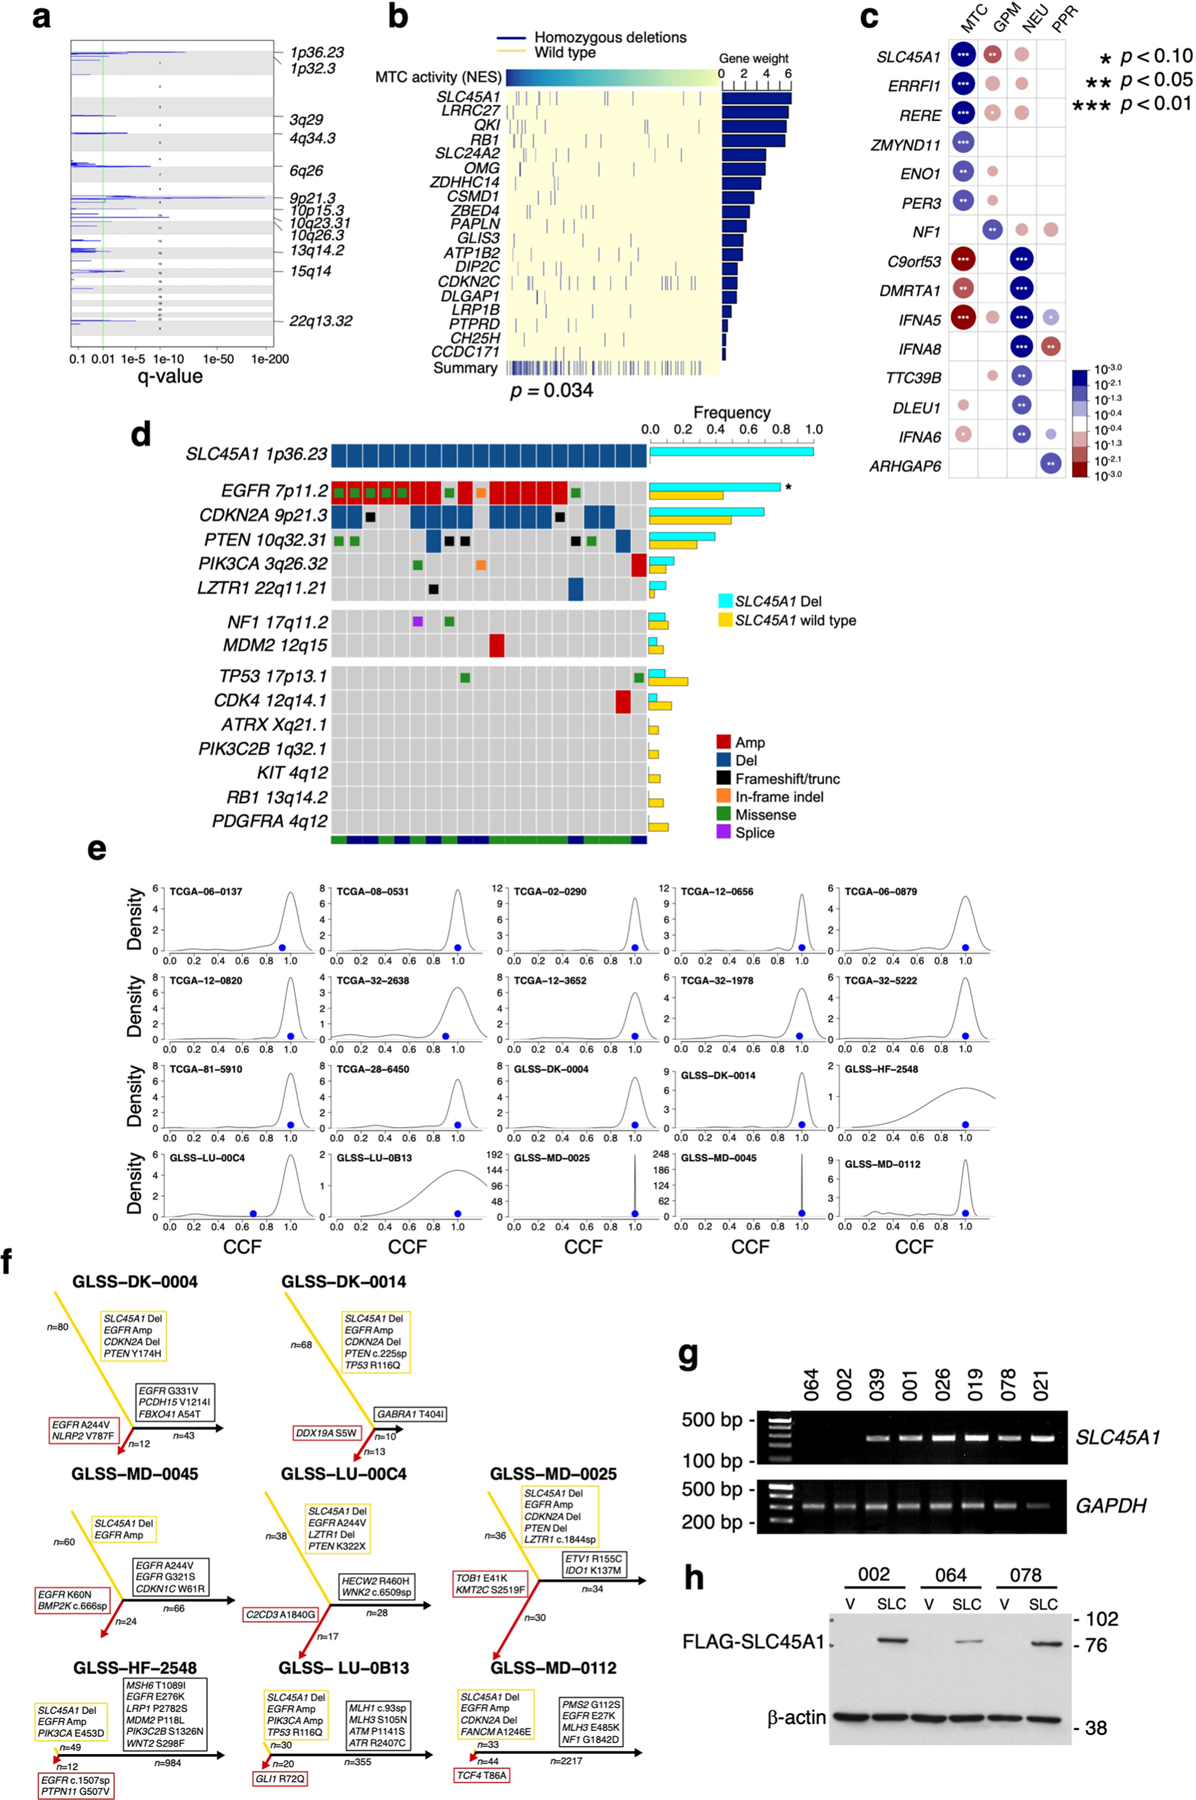
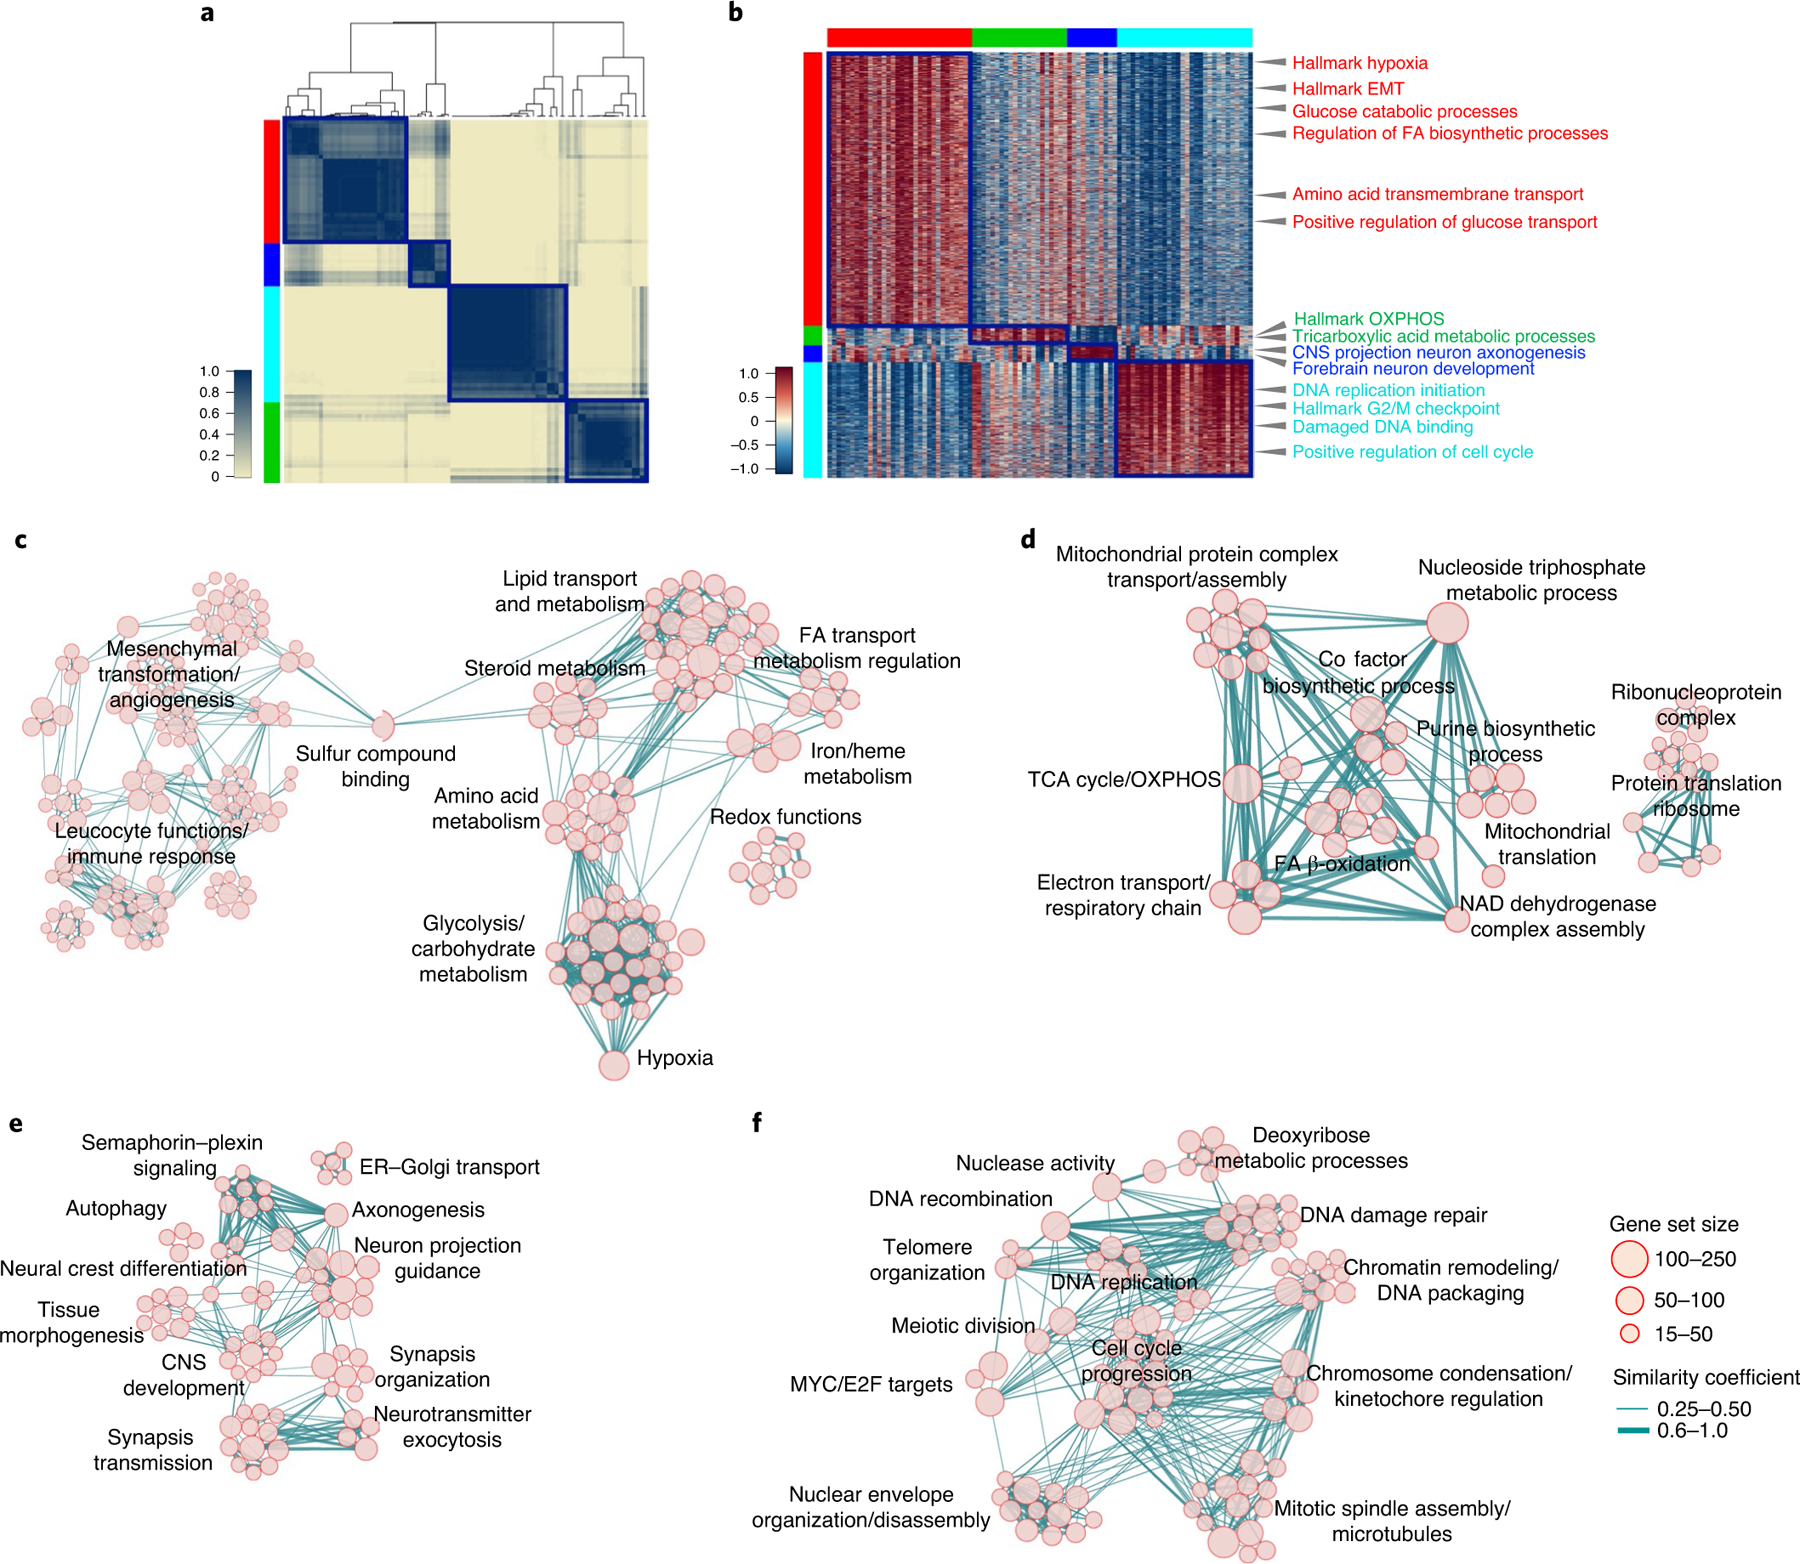
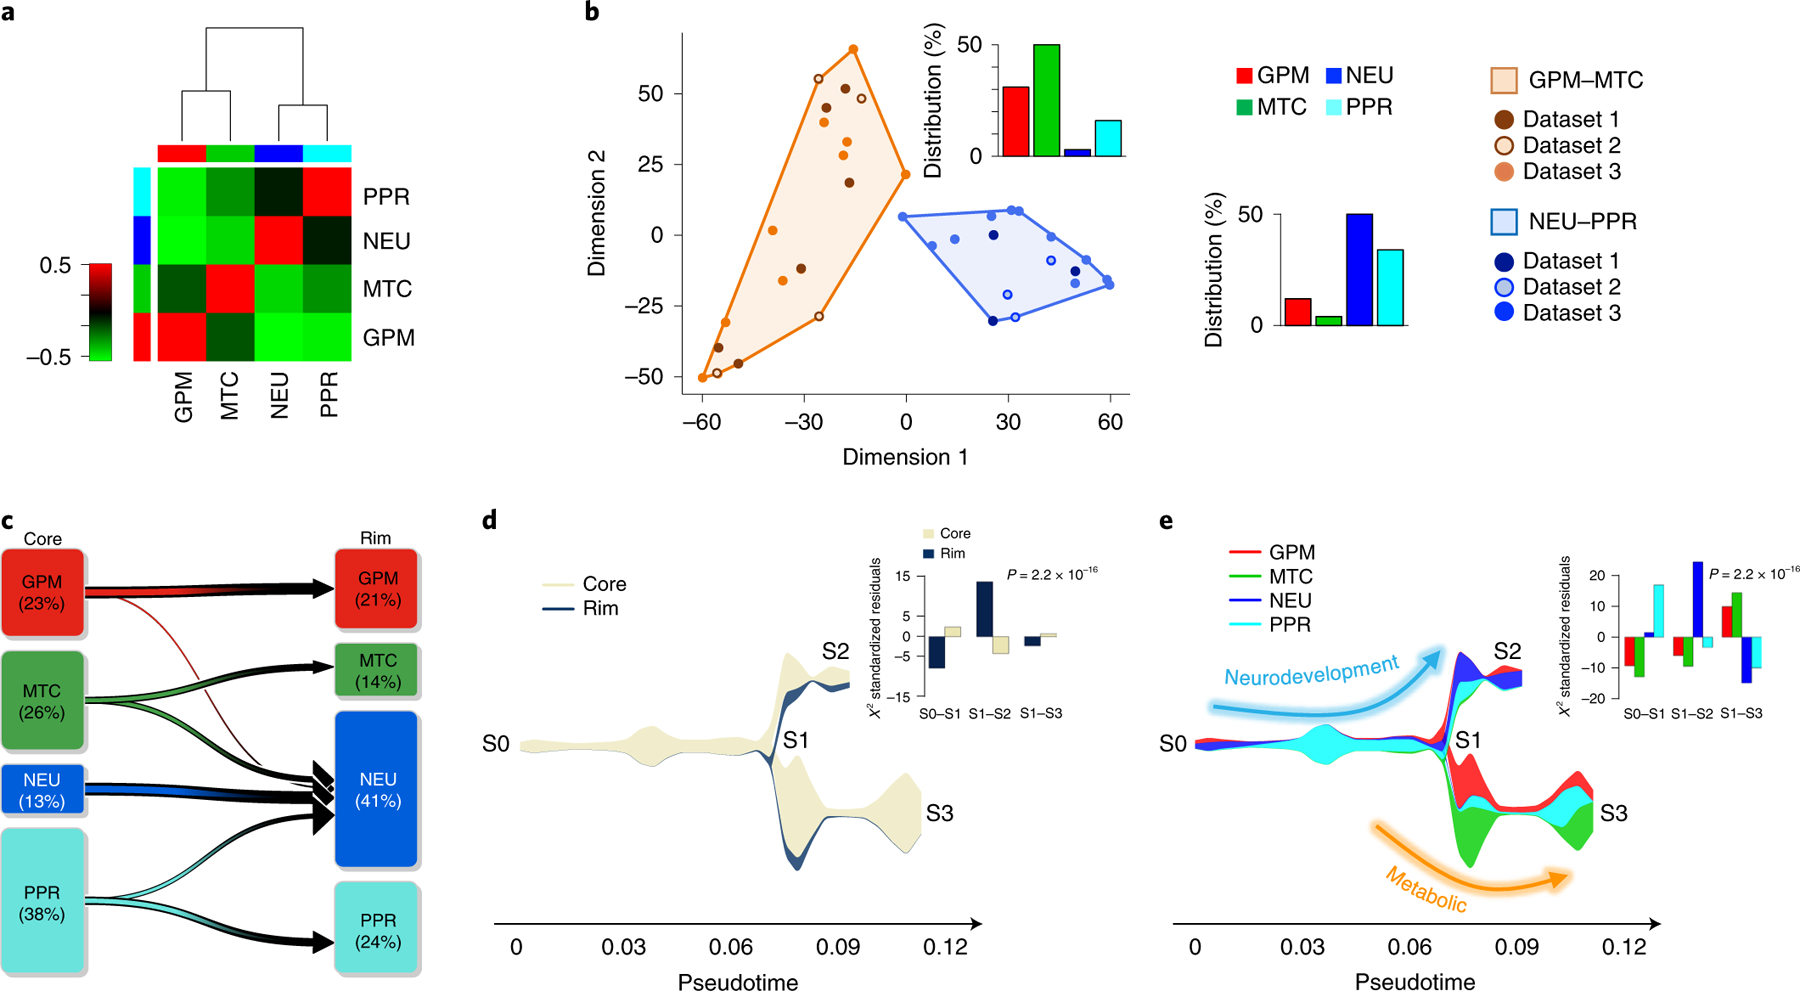
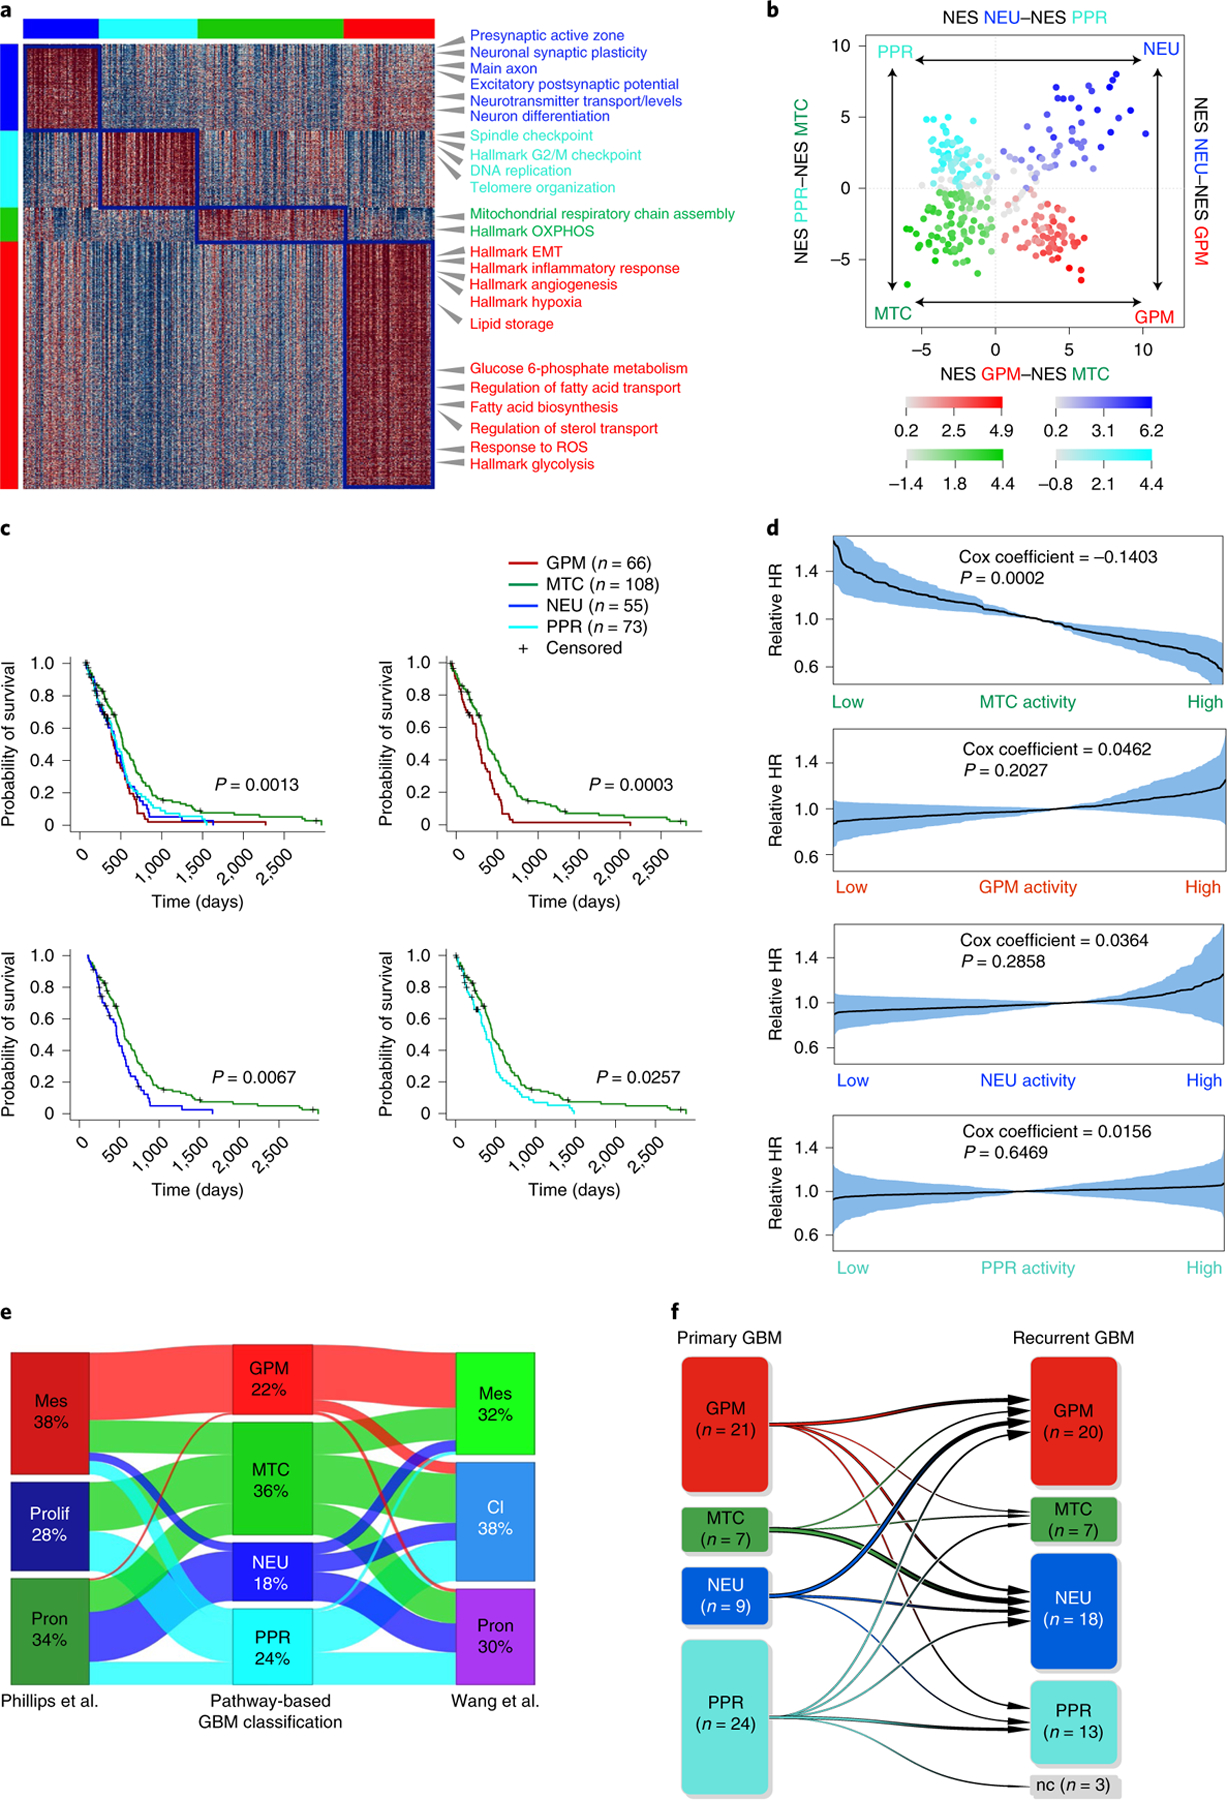
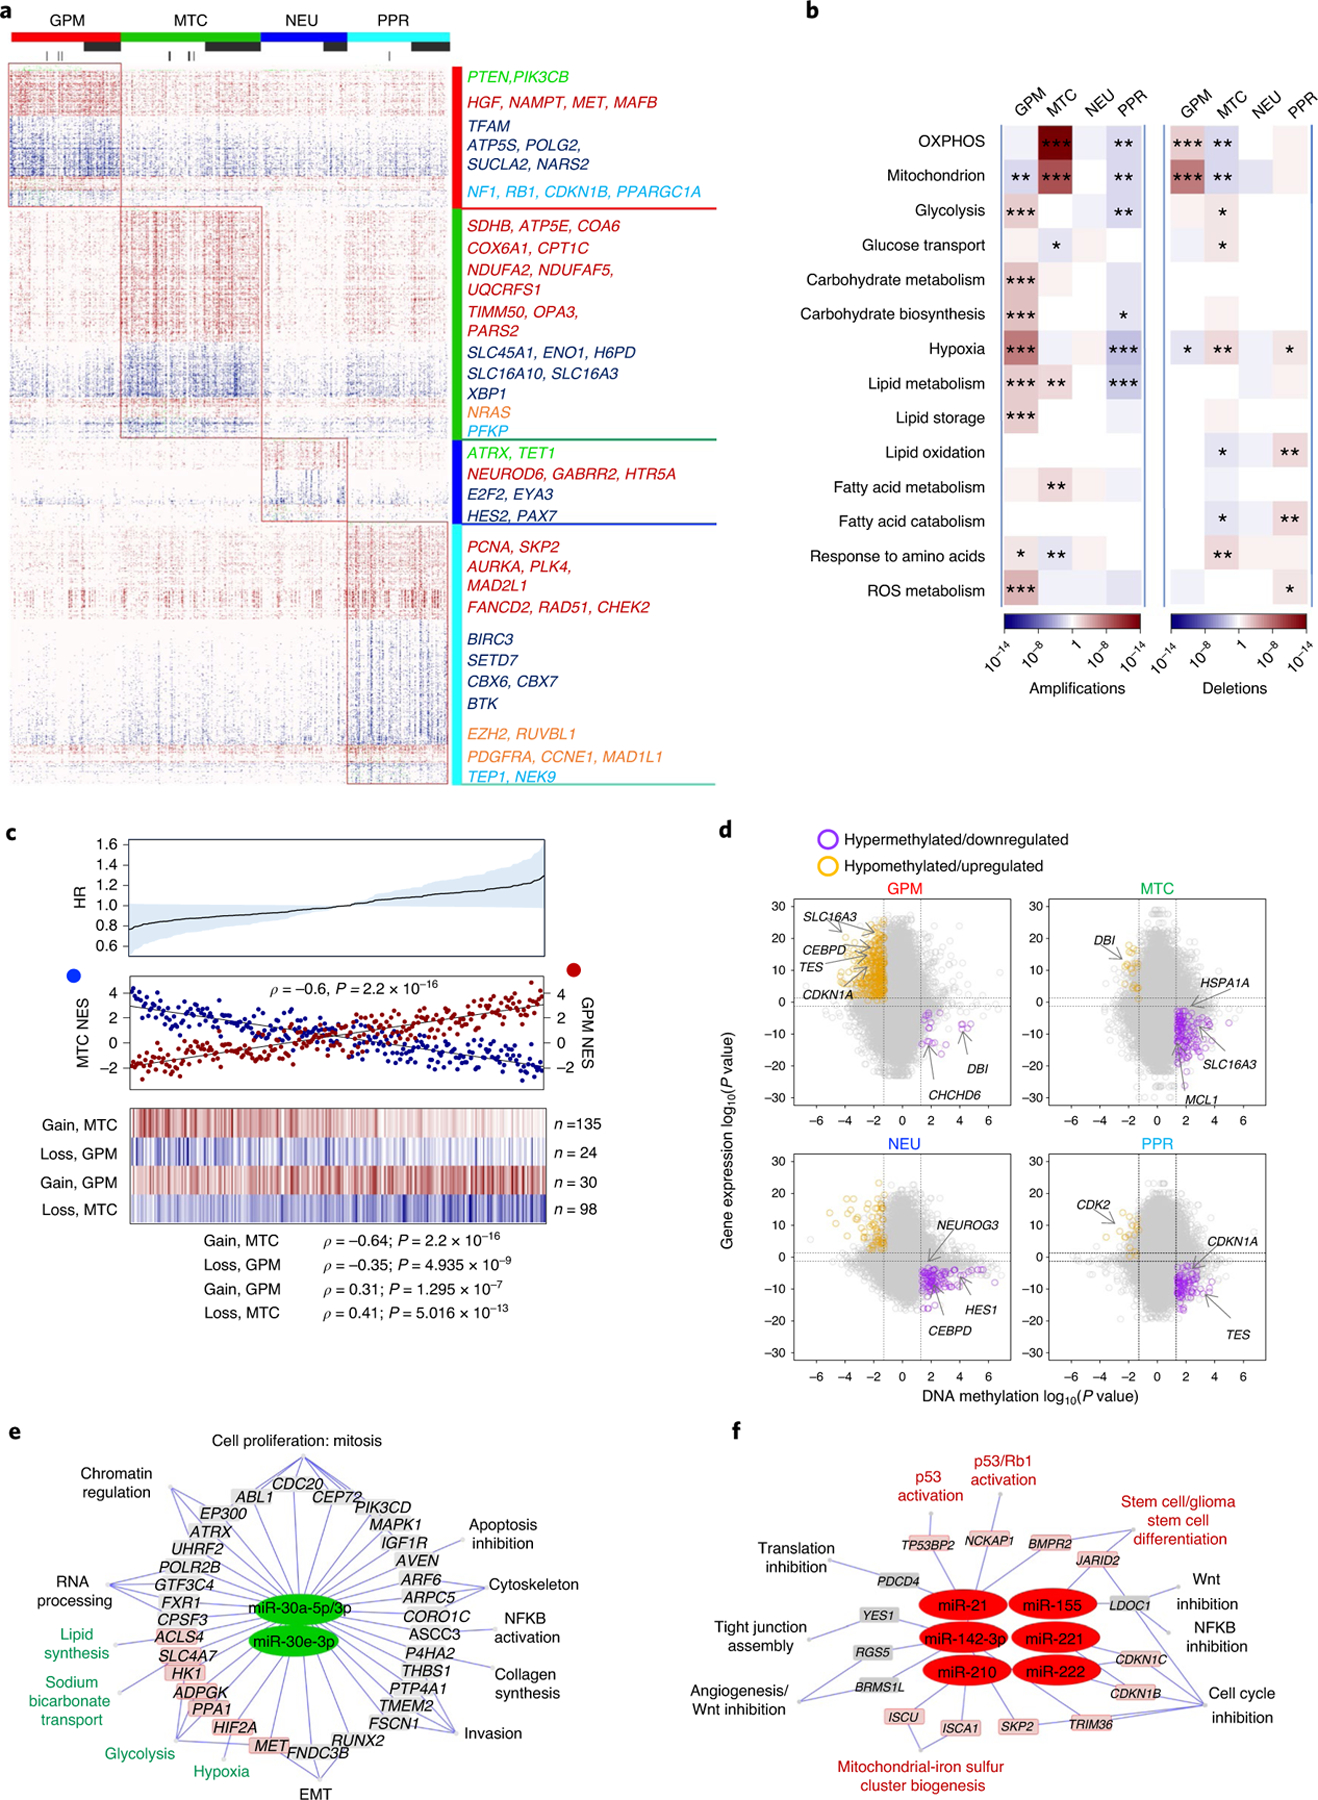
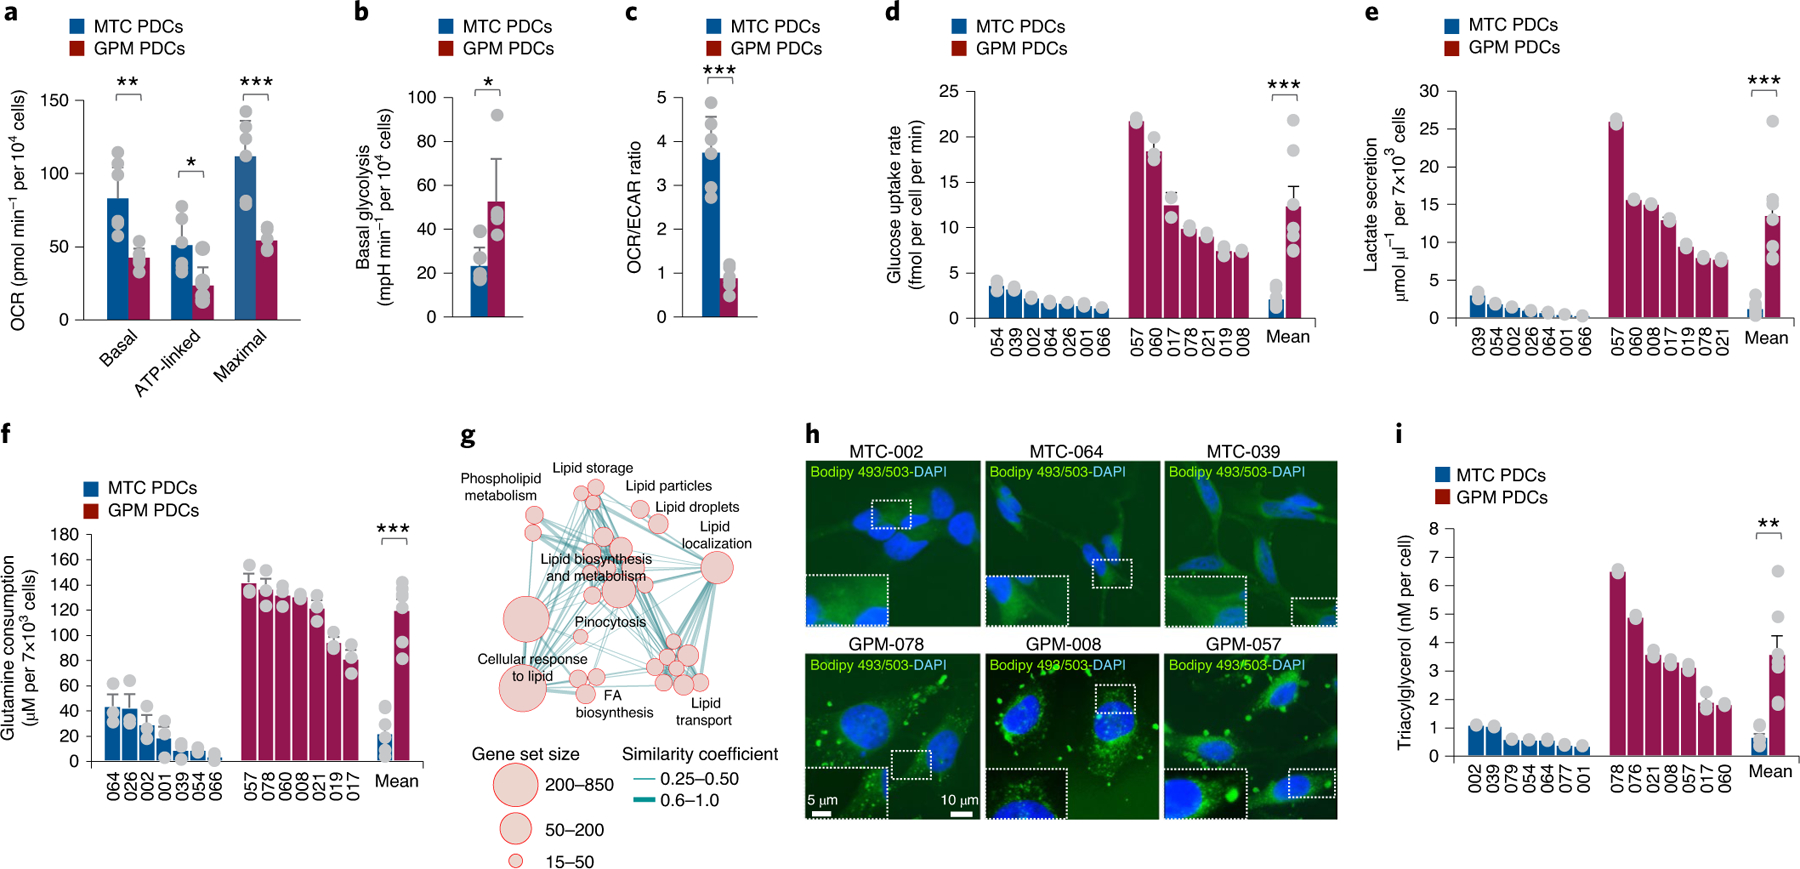
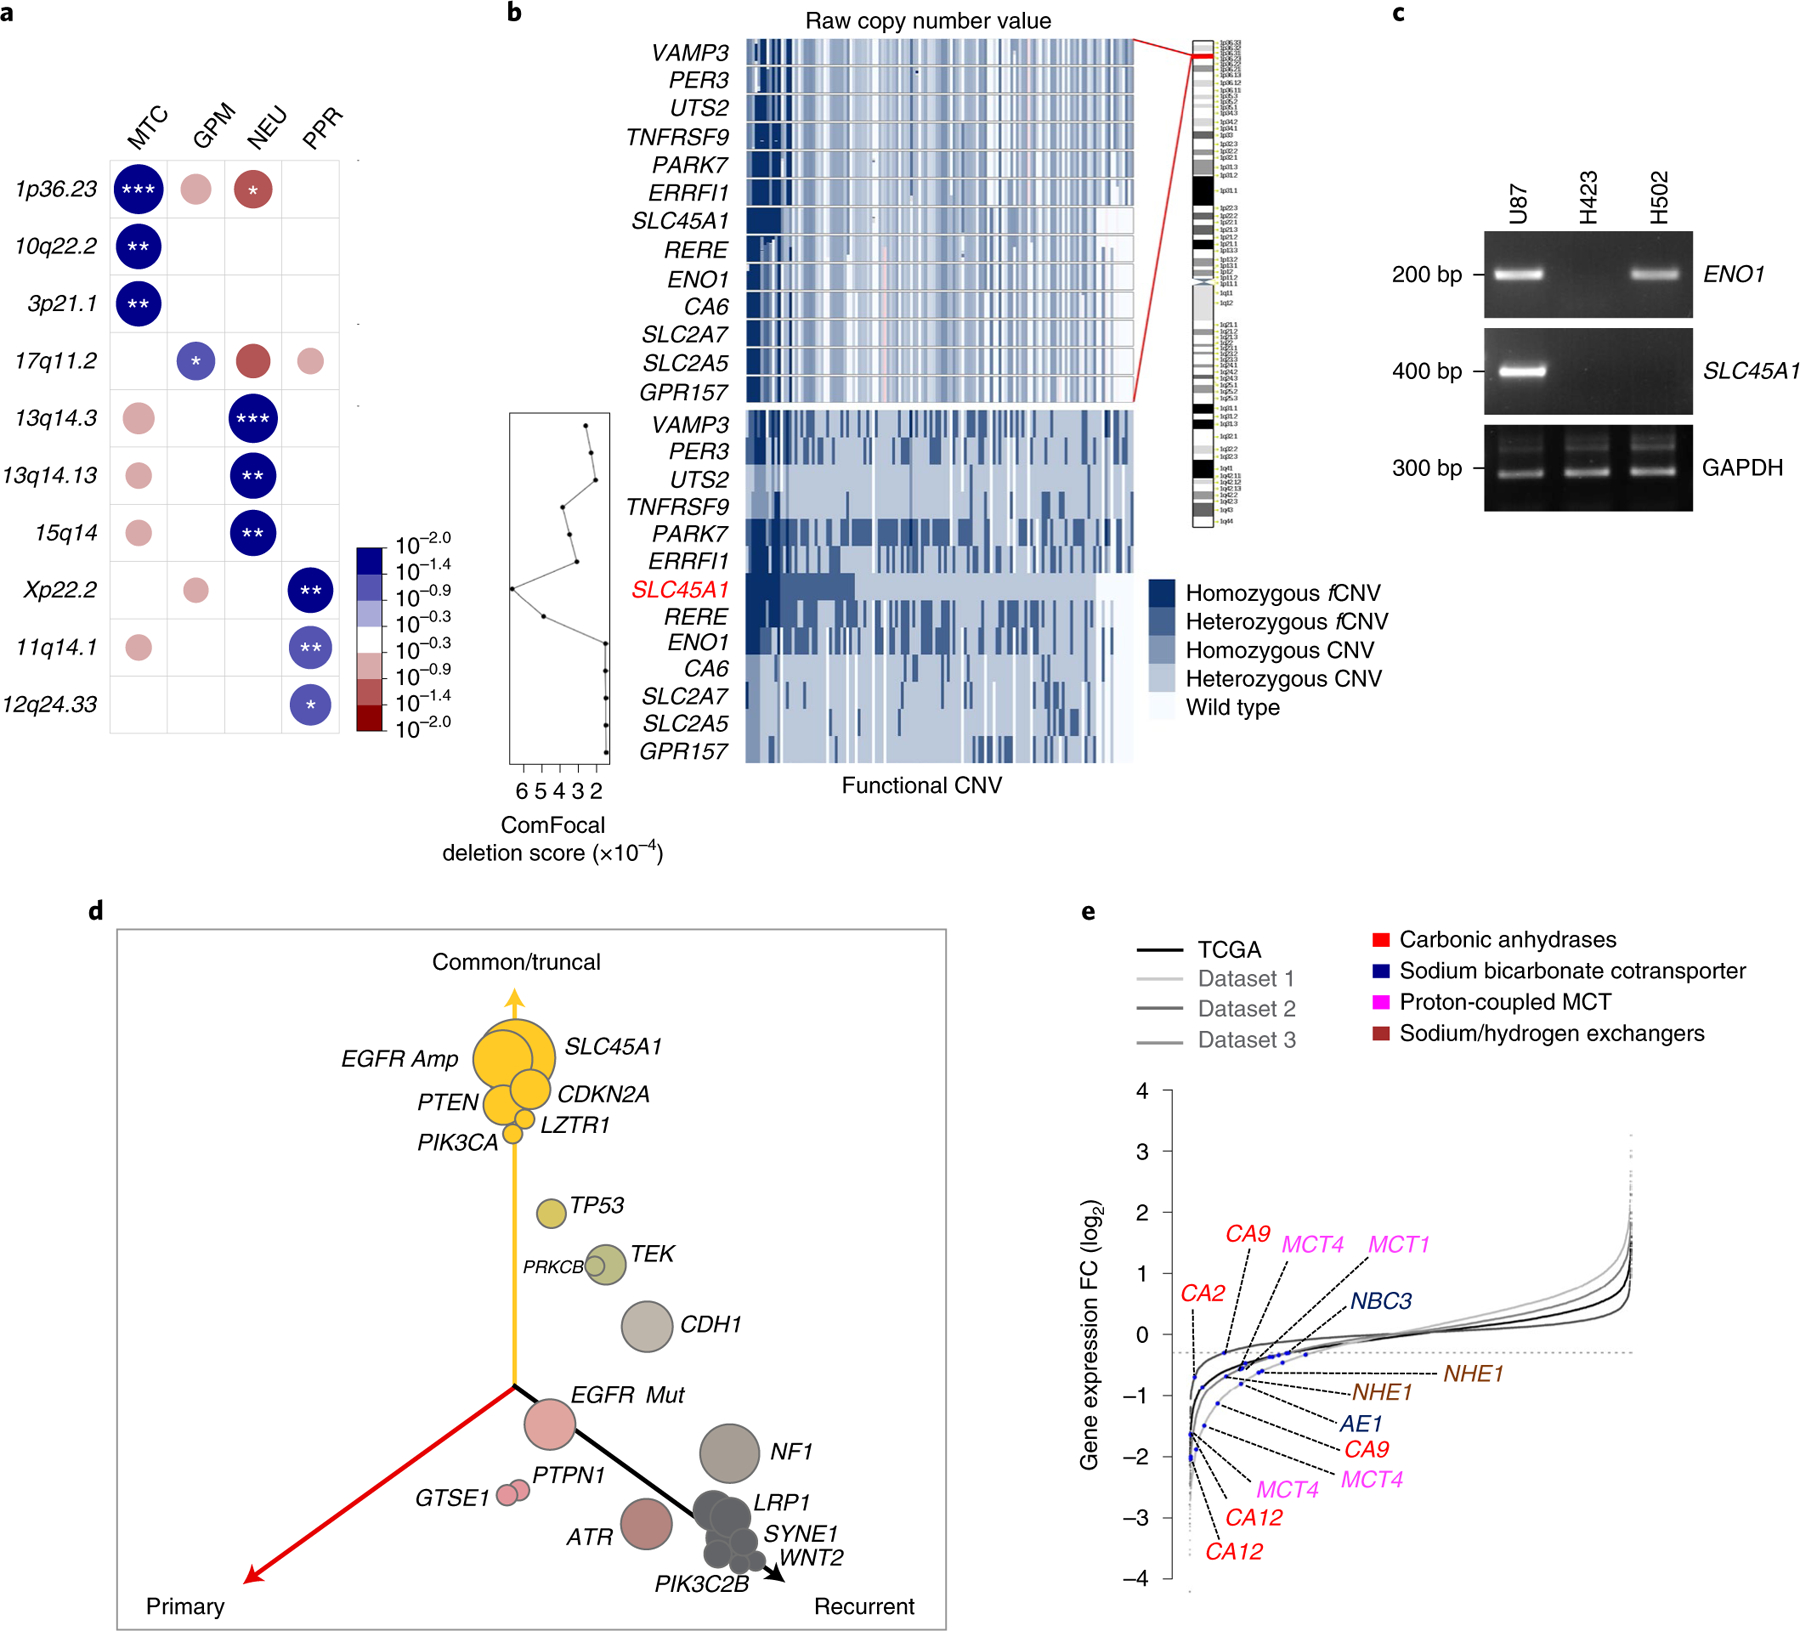
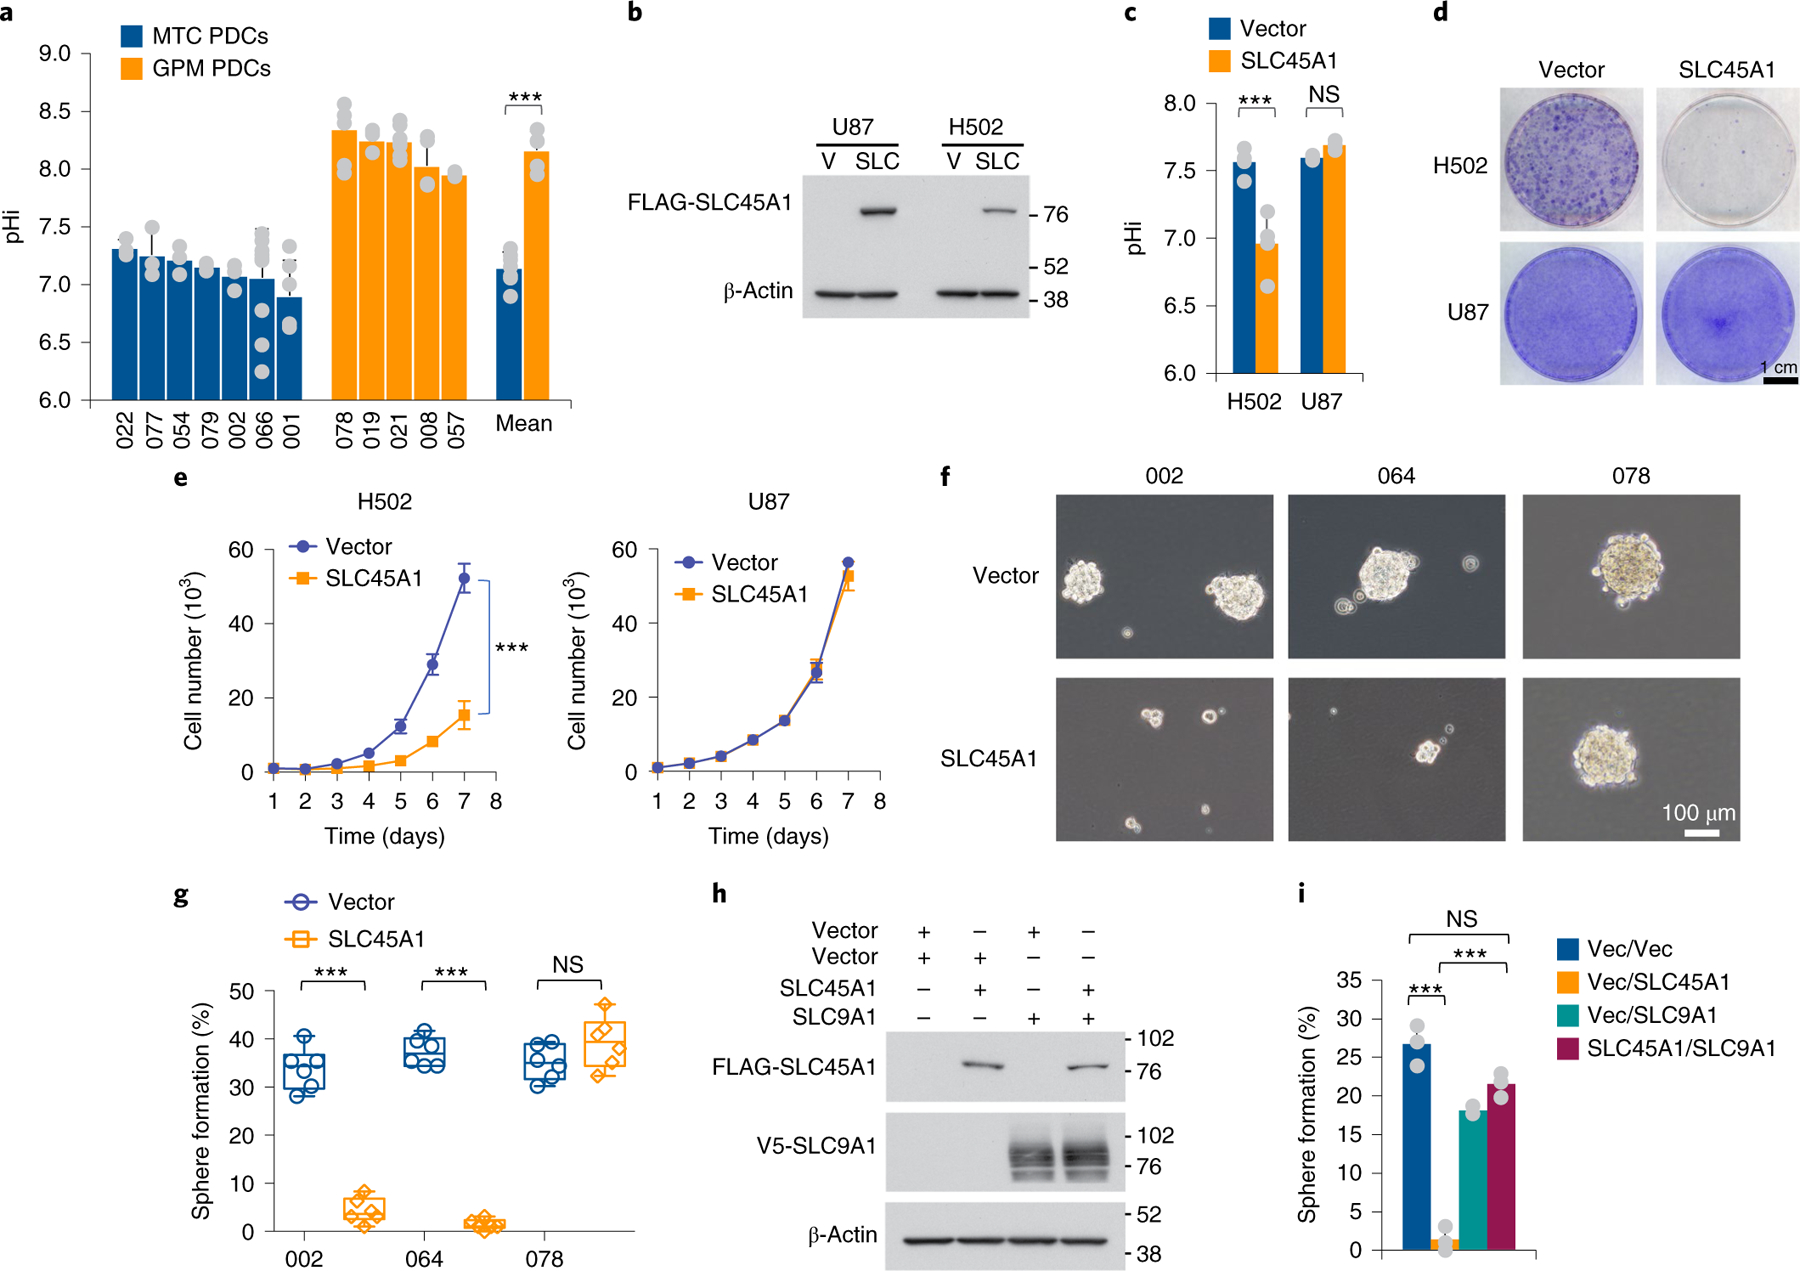
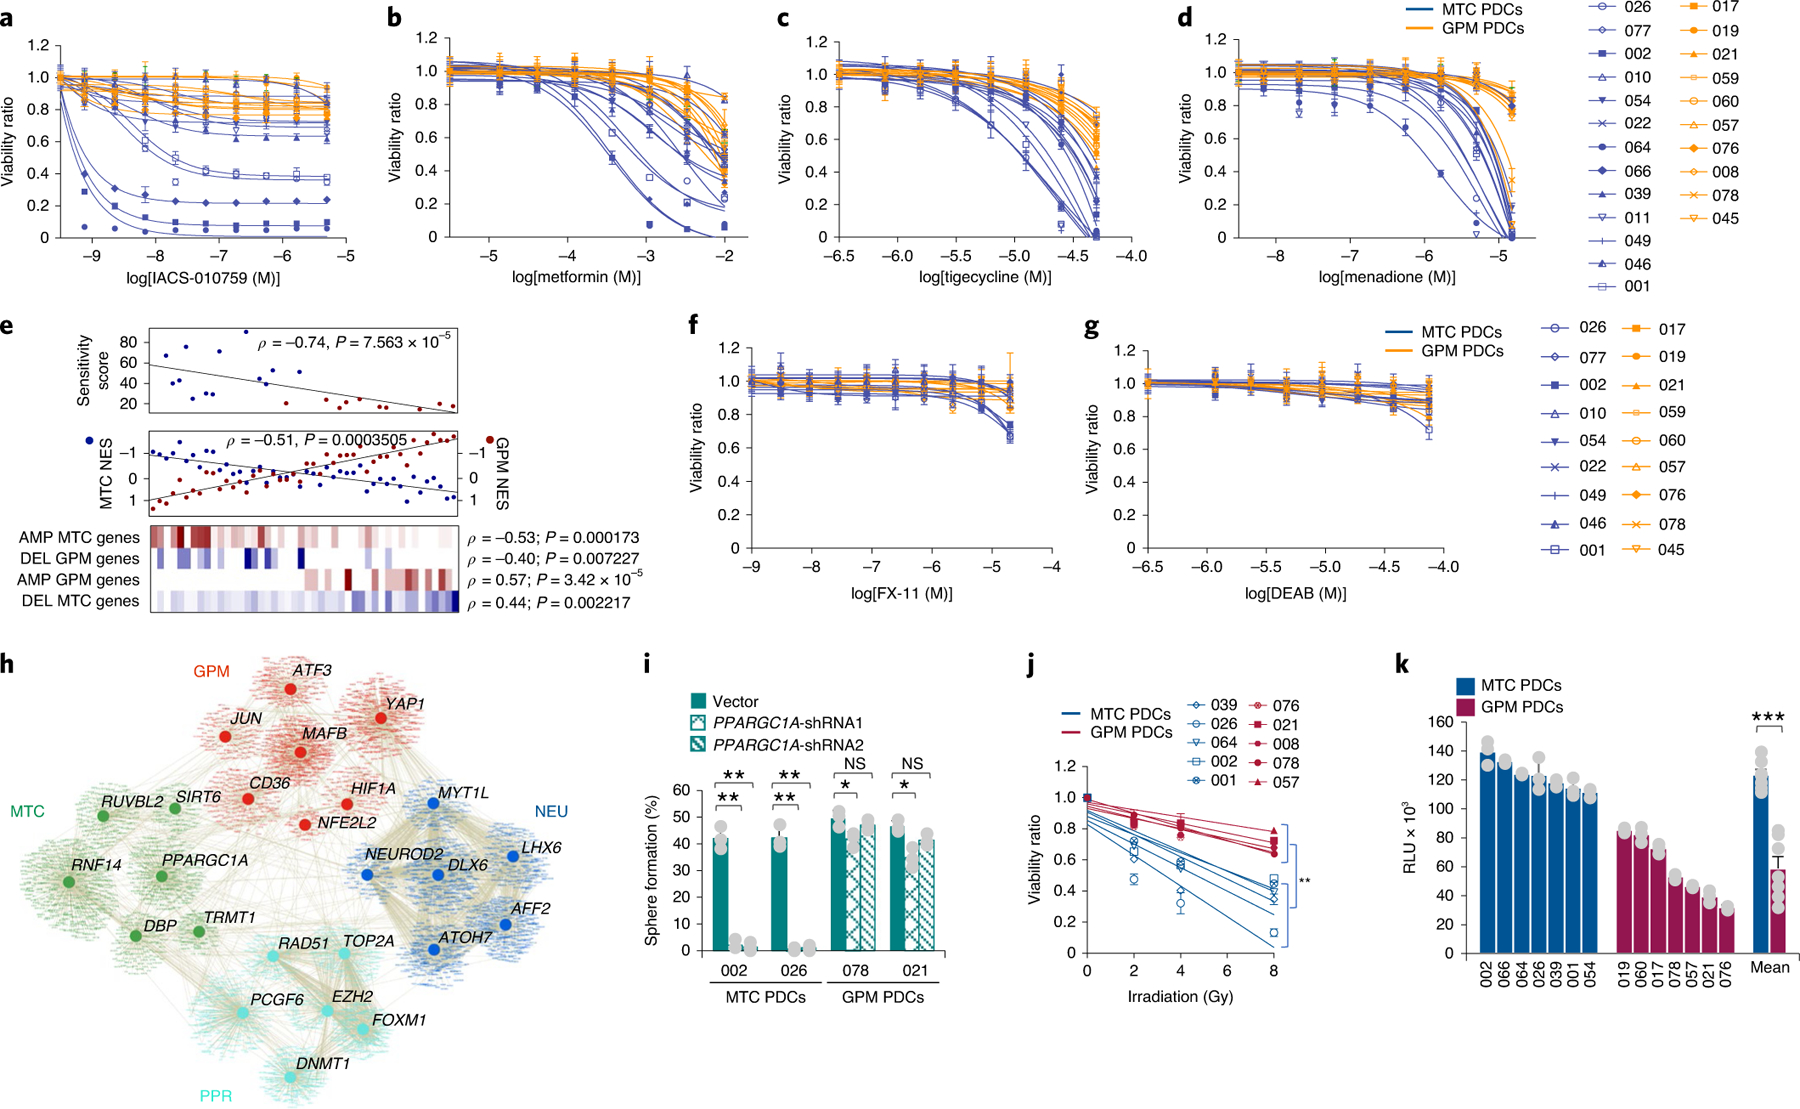
The transcriptomic classification of glioblastoma (GBM) has failed to predict survival and therapeutic vulnerabilities. A computational approach for unbiased identification of core biological traits of single cells and bulk tumors uncovered four tumor cell states and GBM subtypes distributed along neurodevelopmental and metabolic axes, classified as proliferative/progenitor, neuronal, mitochondrial and glycolytic/plurimetabolic. Each subtype was enriched with biologically coherent multiomic features. Mitochondrial GBM was associated with the most favorable clinical outcome. It relied exclusively on oxidative phosphorylation for energy production, whereas the glycolytic/plurimetabolic subtype was sustained by aerobic glycolysis and amino acid and lipid metabolism. Deletion of the glucose-proton symporter SLC45A1 was the truncal alteration most significantly associated with mitochondrial GBM, and the reintroduction of SLC45A1 in mitochondrial glioma cells induced acidification and loss of fitness. Mitochondrial, but not glycolytic/plurimetabolic, GBM exhibited marked vulnerability to inhibitors of oxidative phosphorylation. The pathway-based classification of GBM informs survival and enables precision targeting of cancer metabolism.


Conflict of interest statement

Competing interests A.L. and A.I. are inventors of a biomarker technology that has been licensed to QIAGEN. A.I. received sponsored research funding from AstraZeneca and Taiho Pharmaceutical and has served as a paid consultant/advisor to AIMEDBIO Inc. A.L. received sponsored research funding from Celgene. All other authors declare no competing interests.

Figures

Extended Data Fig. 1 |
Extended Data Fig. 1 |. The computational framework of scBiPaD.
Step 1: identification of cell sub-populations of cells in each individual tumor that share activation of similar biological functions; Step 2: determination of enriched biological pathways in each cell sub-population by defining cluster-specific ranked-lists; Step 3: identification of cell sub-populations that share coherent biological functions across multiple tumors. In Step 1-i, the ranked list for each cell in each tumor is obtained by standardizing and ranking genes. The activity matrix (NES) of all cells composing each tumor is obtained by calculating the single-sample activity of all the 5,032 biological pathways with ssMWW-GST (Step 1-ii) and used to generate the Euclidean distance between every pair of cells in each tumor (Step 1-iii). Finally, the cell sub-populations of each tumor are identified by applying the consensus clustering on the basis of the Euclidean distance of the NES (Step 1-iv). In the following step (Step 2-i), the MWW-score is used to generate a cluster-specific ranked-list of genes for each cell sub-population by comparing the expression profiles of the cells in the cluster with all other cells in the same tumor. The enriched biological pathways of each cell sub-populations are derived in Step 2-ii by using MWW-GST as in Step 1-ii. Each cell sub-population is then represented by a binary vector, with 1 indicating the enriched biological pathways (Step 3-i) and the binary matrix is used in Step 3-ii to derive the Jaccard distance. In the last step, 3-iii, cell sub-populations are clustered by Jaccard distance using consensus clustering.
Extended Data Fig. 2 |
Extended Data Fig. 2 |. expression of subtype associated markers and mapping of marker genes on the population structure of neurodevelopmental subtype.
a, Rank order plot of changes in genes expressed in MTC cells versus the other groups. Genes are ranked from left to right in increasing expression order. Red dots indicate mitochondrial respiratory complex I genes differentially expressed in each single cell dataset [n = 2,799 cells for dataset 1, n = 9,652 cells for dataset 2, n = 4,916 cells for dataset 3; log2(FC) > 0.3 and FDR < 0.05, two-sided MWW test]. Representative genes upregulated in at least two out of three datasets are shown. Colors indicate complex I structural classes. b, Rank order plot of changes of genes expressed in NEU cells versus the other groups. Genes are ranked as in a. Red dots indicate neurotransmitter receptors differentially expressed in each single cell dataset [n = 2,799 cells for dataset 1, n = 9,652 cells for dataset 2, n = 4,916 cells for dataset 3; log2(FC) > 0.3 and FDR < 0.05, two-sided MWW test]. For each dataset, upregulated genes representing distinct neurotransmitter receptor families are indicated by different colors. c, Rank order plot of changes of genes expressed in PPR cells versus the other groups. Genes are ranked as in a, b. Red dots indicate neural progenitor marker genes differentially expressed in each single cell dataset [n = 2,799 cells for dataset 1, n = 9,652 cells for dataset 2, n = 4,916 cells for dataset 3; log2(FC) > 0.3 and FDR < 0.05, two-sided MWW test]. Representative genes differentially expressed in at least two out of three single cell datasets are indicated. d, Sankey diagram showing subtype assignment of single glioma cells according to scBiPaD classification and the described cell states. e, Bar plot of the number of tumors and states in each of the 36 samples of the single cell cohort. f, Bar plot showing functional cell state (at least 15% of cells in the sample) composition of 36 GBM samples. g, Stream plots of proliferation markers expressed by the PPR cells at the tumor core. h, Stream plots of neural progenitor markers. Expression overlaps with proliferation markers and is excluded from the more differentiated cells at the tumor periphery. The newly born neuron marker TBR1 is expressed in a subset of cells of the neurodevelopment branch. i, Stream plots of synaptic and neurotransmitter receptor genes in non-proliferative cells at the invasive rim. Color scale indicates the log2 normalized expression of the indicated gene.
Extended Data Fig. 3 |
Extended Data Fig. 3 |. Analysis of survival-associated biological pathways in single glioma cells.
a, Consensus clustering of 103 cell sub-populations from the three single cell datasets obtained using 192 biological pathways significantly associated with patient survival. Columns and rows are cell sub-populations. Left track: red, GPM; green, MTC; blue, NEU; cyan, PPR. b, Heatmap of the biological activities of cell sub-populations in a. Each group was defined by shared activated pathways among the 5,032-pathway collection (n = 103 cell sub-populations; effect size > 0.3, FDR < 0.0001, two-sided MWW test). Columns are cell sub-populations, rows are pathway activities. Pathway activity level is color-coded. Representative pathways specifically activated in each of the four functional subtypes are indicated. Left and top tracks are as in a. c, Enrichment map network of statistically significant and not redundant GO categories [logit(NES) > 0.58 and FDR < 0.05, two-sided MWW-GST] in GPM; d, MTC; e, NEU; f, PPR medoids. Nodes are GO terms and lines their connectivity. Node size is proportional to number of genes in the GO category; line thickness indicates similarity coefficient. The right-hand side of the network in c was magnified 1.5-fold for a better visualization of the significant activities.
Extended Data Fig. 4 |
Extended Data Fig. 4 |. t-SNe plot visualization of tumors and functional cell states in single glioma cells.
a, t-SNE plot of malignant cells colored by tumor from dataset 1; b, dataset 2; c, dataset 3. d, t-SNE plot of malignant cells from dataset 1 colored according to functional states; e, t-SNE plot of malignant cells from dataset 2 colored according to functional states; f, t-SNE plot of malignant cells from dataset 3 colored according to functional states. Cells concordantly classified using 5,032 or 192 pathways are colored: red, GPM; green, MTC; blue, NEU; cyan, PPR; grey, cells not concordantly classified.
Extended Data Fig. 5 |
Extended Data Fig. 5 |. Characterization of biological subtypes of bulk primary GBM.
a, Consensus clustering of 534 GBM on the activity of 192 survival-associated pathways (p < 0.05, log-rank test; p-value of individual pathways are reported in Supplementary Table 6b). Columns and rows are individual tumors. Left track: red, GPM; green, MTC; blue, NEU; cyan, PPR; black, unclassified. b, Heatmap of pathway activity in 304 classified GBM including 126 out of 192 survival-associated and differentially active pathways in the four GBM subtypes (effect size > 0.3 and FDR < 0.01, two-sided MWW test). Columns are individual tumors and rows are pathway activity. Pathways characteristically activated in each core subtype are indicated. Left and top tracks: red, GPM; green, MTC; blue, NEU; cyan, PPR. c, Heatmap of genes differentially expressed and upregulated in GBM subtypes (n = 304 tumors; Kruskal-Wallis analysis with post hoc correction by Nemenyi’s test for multiple comparison; FDR < 0.01 and log2(FC) > 0.5). Columns are individual tumors, rows are genes. Representative genes specifically upregulated in each GBM subtype are indicated. Tracks are as in b. d, Rank order plot of changes of genes expressed in GBM NEU. Genes are ranked from left to right in increasing expression order. Red dots indicate neurotransmitter receptors differentially expressed in NEU tumors and cells (n = 2,799 cells for dataset 1, n = 9,652 cells for dataset 2, n = 4,916 cells for dataset 3, n = 304 tumors for TCGA dataset; log2(FC) > 0.3, FDR < 0.05, two-sided MWW test). For each dataset, upregulated genes in neurotransmitter receptor families are indicated by colors. e, Rank order plot of changes of genes expressed in GBM PPR. Genes are ranked as in d. Red dots indicate neural progenitor genes differentially expressed in each dataset (n = 2,799 cells for dataset 1, n = 9,652 cells for dataset 2, n = 4,916 cells for dataset 3, n = 304 tumors for TCGA dataset; log2(FC) > 0.3, FDR < 0.05, two-sided MWW test). Representative genes differentially expressed in at least three datasets are indicated. f, Heatmap showing the 50 highest scoring genes of the four GBM subtypes-specific signatures. Rows are genes and columns are tumors (n = 304 tumors). Track are as in b, c. g, Two-dimensional representation of GBM subtype enrichment scores (n = 304 tumors). Quadrant are GBM subtypes, the position of dots (tumors) reflects the relative subtype-specific score of each tumor as indicated by x- and y-axes, and their color the subtype simplicity score. Gray, tumors that do not fall in the respective subtype quadrant.
Extended Data Fig. 6 |
Extended Data Fig. 6 |. Validation of the biological classification of GBM and comparison with established classifiers.
Subtype-specific gene signatures were used to classify GBM from independent cohorts. a, Heatmap of GBM from the TCGA cohort profiled by RNA-seq (n = 129 tumors). b, Heatmap of GBM from the CGGA cohort (n = 94 tumors). c, Heatmap of GBM (n = 158 tumors). d, Kaplan-Meier of patients in a (128 out of 129 patients with survival data available). e, Kaplan-Meier of patients in b (90 out of 94 patients with survival data available). f, Kaplan-Meier of patients in c (156 out of 158 patients with survival data available). Patients were stratified according to the four biological subtypes; survival differences were assessed using the log-rank test. g, Kaplan-Meier of patients with GBM from the TCGA cohort profiled by Agilent microarray (n = 302 patients, log-rank test) and h, Patients with GBM from the TCGA cohort profiled by RNA-seq (n = 145 patients, log-rank test) classified according to mesenchymal, proneural and classical subtype. i, Kaplan-Meier of GBM patients as in g and j, patients as in h classified according to mesenchymal, proneural and proliferative subtype.
Extended Data Fig. 7 |
Extended Data Fig. 7 |. Analysis of the tumor microenvironment and GBM driver alterations in the biological GBM subtypes.
a, Box plots of GBM subtypes tumor purity scores computed by ABSOLUTE; p-values: Kruskal-Wallis test with Nemenyi post hoc correction for multiple comparison (n = 282 tumors). Box plots span the first to third quartiles and whiskers show the 1.5× interquartile range. b, Correlation analysis of nontumor cell fraction in relationship with GBM cell state fraction (n = 36 tumors; Spearman’s correlation; p = 0.089 GPM versus macrophages; p = 0.067 GPM versus neutrophils; p = 0.017 GPM versus oligodendrocytes; p = 0.092 MTC versus macrophages; p = 0.026 PPR versus oligodendrocytes; *p < 0.10; **p < 0.05). Rows are GBM cell states. Columns are non-tumor cell types. Blue to red scale indicates negative to positive correlation. c, Heatmap of the expression of the top 25 microglia- and macrophage-specific genes in nontumor cells from two GPM and two MTC GBM from single cell dataset 1. Cells are ordered by gene expression fold-change of macrophage- versus microglia-specific genes. The top horizontal track shows in red and green nontumor cells from GBM whose tumor cells have a dominant GPM (S4_D1, n = 67 cells, and S12_D1, n = 246 cells) or MTC state (S1_D1, n = 65 cells, and S5_D1, n = 29 cells), respectively. Representative microglia and macrophages marker genes are indicated. d, Bar plots showing the frequency distribution of GBM driver genes grouped by signaling pathways across GBM subtypes. Asterisks indicate the statistical significance (n = 496 tumors; two-sided Fisher’s exact test).
Extended Data Fig. 8 |
Extended Data Fig. 8 |. Characterization of GBM biological states by multi-omics data analysis.
a, Heatmap of the M-values of the 100 probes most differentially methylated between GBM subtypes (n = 59 tumors; two-sided MWW test, p < 0.01 and absolute methylation log2(fold-change) > 0.58). b, Volcano plots of differentially expressed miRNA. Upregulated miRNAs in each GBM subtype are indicated in red [n = 294 tumors; log2(FC) ≥ 0 and p-value < 0.0005, two-sided MWW test]. Vertical and horizontal gray lines demarcate log2(FC) and p-value cutoff, respectively. Representative miRNAs upregulated in each functional subtype are indicated. c, Representative miRNA-gene targets networks significantly upregulated in PPR and d, NEU GBM subtypes [n = 294 tumors; log2(FC) > 0 and p < 0.0005, two-sided MWW test]. miRNA targets whose expression was anti-correlated with miRNA expression are listed (n = 294 tumors; Spearman’s correlation, ρ < 0 and p < 0.05) and biological pathways regulated by miRNA-target activity are indicated. Red nodes indicate miRNA targets of interest for the biology of the specific GBM subtype. p-values of individual genes in a-d are reported in Supplementary Table 14a, c, d, respectively. e-h, Box plots showing the expression of selected proteins or phosphoproteins significantly up-regulated (n = 103 tumors; two-sided MWW test) by RPPA in e, GPM; f, MTC; g, NEU; h, PPR GBM. Box plots span the first to third quartiles and whiskers show the 1.5× interquartile range.
Extended Data Fig. 9 |
Extended Data Fig. 9 |. Genomic and metabolic characterization of GBM PDCs.
a, Classification of PDCs by random forest. Upper panel, bar plot showing mean ± s.d. of NES of subtype-specific biological activity in each PDC subgroup. Middle panel, representative biological pathways exhibiting differential activity among subtypes [n = 79 PDCs; logit(NES) > 0.3 and FDR < 0.05, two-sided MWW test]. Bottom panel, representative genes differentially expressed in PDC subtypes (n = 79 PDCs; log2(FC) > 0.3 and FDR < 0.05, two-sided MWW test). Red, green, blue, and cyan indicate significant pathway activation/gene up-regulation in PDCs classified as GPM, MTC, NEU or PPR, respectively; gray, pathway activation/gene up-regulation in any other subtype; white, lack of activation or up-regulation. b, OCR kinetics in 2 MTC PDCs each derived from an independent patient and 2 GPM PDCs each derived from an independent patient shows elevated OCR in MTC PDCs. Data are mean ± s.d. from one representative experiment for each PDC including n ≥9 replicates (see Source Data Extended Data Fig. 9). c, ECAR kinetics in 2 MTC PDCs each derived from an independent patient and 2 GPM PDCs each derived from an independent patient shows elevated glycolysis in GPM PDCs. Data are mean ± s.d. from one representative experiment for each PDC including n ≥7 replicates (see Source Data Extended Data Fig. 9). mpH, milli pH unit. Experiments were repeated two times with similar results. d, Box plots showing the expression of SLC1A5 in GPM (n = 67 tumors) and MTC (n = 108 tumors) primary GBM. e, Box plots showing the expression of SLC1A5 in GPM and MTC PDCs (n = 21 GPM PDCs each derived from an independent patient and n = 25 MTC PDCs each derived from an independent patient); p-value: two-sided MWW test. Box plots span the first to third quartiles and whiskers show the 1.5× interquartile range.
Extended Data Fig. 10 |
Extended Data Fig. 10 |. SLC45A1 is the target of chromosome 1p36.23 deletion in MTC GBM.
a, Schematics of chromosome location peak deletions in MTC GBM (n = 153 tumors) identified using GISTIC2 (Benjamini Hochberg FDR q-value < 0.01; q-value of chromosome bands are reported in Supplementary Table 16b). b, The matrix of homozygous deleted genes identified by UNCOVER as associated with MTC NES in primary GBM (n = 487 tumors; p = 0.034, permutation test). Top row, blue to yellow: higher to lower NES values for samples (columns). Deletions in each sample are in dark blue; samples not deleted are in yellow. The last row shows the alteration profile from the entire analysis. The bar plot on the right side indicates the gene weight for each alteration. c, Association of homozygous deletions in each GBM subtype. Circles are color-coded and their dimension reflects the -log10(p-value) of the enrichment (n = 487 tumors; p-value, two-sided Fisher’s exact test; see Supplementary Table 16g). Blue to red scale indicates positive to negative association. d, Frequency of genetic alterations of GBM driver genes in SLC45A1-deleted (n = 20 tumors) compared to SLC45A1 wild-type GBM (n = 705 tumors). The bottom track indicates the dataset (green, TCGA; blue, GLASS). Asterisk, p = 2.33e-03, two-sided Fisher’s Exact test (n = 725 tumors). e, Sample density plot depicting the relative frequency distribution of CCF estimated for the genetic alterations occurring in SLC45A1-deleted GBM (n = 20 tumors). Blue dot, CCF of SLC45A1 deletion. f, Evolutionary trees of genetic alterations in primary and recurrent SLC45A1-deleted GBM (n = 8 matched primary and recurrent tumor pairs); yellow, red and black branches are truncal, primary private and recurrent private alterations, respectively; the length of branches is proportional to the number of genetic alterations. GBM driver genes are indicated. g, PCR amplification of genomic DNA shows deletion of SLC45A1 in PDC-002 and PDC-064. h, Immunoblot of FLAG-SLC45A1 in PDC-002, PDC-064 (harboring SLC45A1 deletion) and PDC-078 (SLC45A1 wild type). Experiments in g, h were repeated two times with similar results. See Source Data Extended Data Fig. 10.
Fig. 1 |
Fig. 1 |. Identification of four core functional states in single glioma cells.
a, Consensus clustering generated from clusters of 94 single-cell subpopulations from 17,367 cells (36 GBM tumors). Columns and rows represent cell subpopulations. Color bar on the left defines four cell clusters. Yellow-to-blue scale indicates low to high similarity. b, Heatmap of biological activities of 94 single-cell sub-populations grouped by common activated pathways (2,533 of 5,032 pathways; effect size >0.3, FDR < 0.0001, two-sided MWW test). Columns represent cell subpopulations; rows are biological activities. Pathway activity levels are color coded. Representative pathways specifically activated in each subtype are indicated. Left and top color bars: red, GPM; green, MTC; blue, NEU; cyan, PPR. c–f, Enrichment map network of statistically significant, nonredundant GO categories (logit(NES) > 0.58, FDR < 0.05, two-sided MWW–GST) in GPM (c), MTC (d), NEU (e) and PPR (f) medoids of each GBM state. c, The right-hand side of the network was magnified 1.5-fold for better visualization of significant activities. Nodes represent gene ontology (GO) terms and lines their connectivity. Node size is proportional to the number of genes in the GO category, with range indicated by keys and line thickness indicating similarity coefficient. EMT, epithelial–mesenchymal transition; FA, fatty acids; CNS, central nervous system; ER, endoplasmic reticulum; TCA, tricarboxylic acid; nc, not classified.
Fig. 2 |
Fig. 2 |. Glioma cell states converge on metabolic and neurodevelopmental axes.
a, Spearman’s correlation of GBM cell states within individual tumors. Rows and columns represent GBM cell states. The green-to-red scale indicates negative to positive correlation. Left and top color bars: red, GPM; green, MTC; blue, NEU; cyan, PPR. b, Multidimensional scaling of cellstate frequency in 36 tumors, discriminating two clusters according to similarity: GPM–MTC (orange) and NEU–PPR (blue). Bar plots: frequency distribution of cell states in each cluster. c, The percentage of cells in each subclass at the tumor core and periphery is indicated, and the variation between core and rim is represented by arrows. NEU cells are enriched at the rim (n = 2,799 cells; P = 2.2 × 10⁻¹⁶, χ2 test). d, Stream plot showing cell density at tumor core and periphery from samples in c. The thickness of each branch is proportional to the number of cells in the branch. Bar plot, significant enrichment of cells from tumor periphery in branch S1–S2 (n = 2,799 cells; P = 2.2 × 10⁻¹⁶, χ2 test). e, Stream plot showing subclasses of cells at tumor core and rim. Bar plot, significant enrichment of NEU cells at the tumor periphery (n = 2,799 cells; P = 2.2 × 10⁻¹⁶, χ2 test). Arrows depict two largely independent branches of cell states, NEU–PPR (neurodevelopment) and GPM–MTC (metabolic).
Fig. 3 |
Fig. 3 |. Classification of primary human GBM and clinical validation.
a, Heatmap of pathway activity in 304 GBM tumors using 2,792 of 5,032 pathways, showing differential activity in the four GBM subtypes (effect size >0.3 and FDR < 0.01, two-sided MWW test). Columns represent tumors; rows are pathway activities. Representative pathways specifically activated in each GBM subtype are indicated. Left and top color bars: red, GPM; green, MTC; blue, NEU; cyan, PPR. b, Two-dimensional plot of GBM subtype enrichment scores (n = 304 tumors). Each quadrant corresponds to one GBM subtype, and the position of dots (tumors) reflects the relative subtype-specific NES of each tumor as indicated on the x and y axes; color intensity reflects NES value. Tumors that do not fall within the corresponding subtype quadrant are colored gray. c, Kaplan–Meier curves of 302 patients with GBM stratified according to the four biological classes. Patients in the MTC subgroup exhibit significantly longer survival (log-rank test). d, Relative HR of 302 patients with GBM estimated by Cox’s proportional hazards model, including the activity of MTC, GPM, NEU and PPR as the covariate (shaded areas represent 95% CI). e, Sankey diagram of GBM subtype assignment (n = 304 tumors) according to either pathway-based or previously published classifications: left, Phillips et al.; right, Wang et al.. f, Functional subtyping of primary and recurrent GBM (n = 61 tumor pairs). The transition plot of primary and recurrent GBM subtypes shows an increased frequency of the NEU subtype at recurrence (P = 0.05, χ2 test). The number of GBM in each class at diagnosis and recurrence is indicated, and variations between primary and recurrent samples are represented by arrows. Mes, mesenchymal; prolif, proliferative; pron, proneural; cl, classical; nc, nonclassified.
Fig. 4 |
Fig. 4 |. Reciprocal MTC and GPM activities are associated with coherent gain- and loss-of-function genetic alterations and predict risk of failure.
a, Mutations and/or CNVs significantly associated with GBM subclasses (n = 496 tumors); P < 0.05, two-sided Fisher’s exact and χ2 test; P values of individual genes are reported in Supplementary Table 12b–u). Columns represent tumors and rows are genes. Horizontal top and vertical color bars: GBM subtypes; horizontal middle and bottom bars: white and gray, samples with or without mutation (middle) or CNV (bottom) data, respectively. Representative gene alterations specific to each GBM subtype are indicated by color: green, mutation; red, amplification; blue, deletion; orange, mutation/amplification; cyan, mutation/deletion. b, Metabolic pathway enrichment analysis of amplifications (left) and deletions (right) in GBM subtypes. Red-to-blue scale, positive to negative enrichment (P value) of gene alterations in the pathway; *P < 0.10, **P < 0.05, ***P < 0.01, two-sided Fisher’s exact test. c, Top: HR for patients with GBM according to Cox’s proportional hazards model, testing the difference between GPM and MTC activities as the covariate (n = 273 tumors, P = 0.05; shaded area represents 95% CI). Middle: correlation analysis of MTC (blue) and GPM (red) activities in individual GBM (n = 273 tumors, Spearman’s correlation, ρ = −0.6, P = 2.2 × 10⁻¹⁶). Bottom: fCNV gain and loss of mitochondrial- and glycolytic-related genes in MTC GBM and GPM GBM. The number of genes amplified/deleted in each tumor is color coded (amplifications, red to white; deletions, blue to white). In all panels, n = 153 MTC and n = 120 GPM tumors. d, Starburst plots comparing DNA methylation and gene expression for 10,337 unique genes. Dashed lines indicate P = 0.01 (n = 59 tumors, two-sided MWW test). The bottom right and top left areas of each plot include genes significantly hypermethylated and downregulated (purple) or hypomethylated and upregulated (orange), respectively, in the specific subtype. e,f, Micro RNA gene target networks were significantly changed in subtypes MTC (e, green nodes) and GPM (f, red nodes) (n = 294 tumors; log2(fold change (FC)) > 0, P < 0.0005, two-sided MWW test). For each miRNA, we report targets whose expression was anticorrelated with miRNA expression (n = 294 tumors; Spearman’s correlation, ρ < 0 and P < 0.05). Highlighted are miRNA targets of interest regarding the biology of subtypes MTC and GPM GBM. P values for miRNAs and targets are included in Supplementary Table 14c. NFKB, nuclear factor kappa B; Wnt, wingless-related integration site.
Fig. 5 |
Fig. 5 |. Divergent metabolic activities support MTC and GPM PDC subtypes.
a, Basal, ATP-linked and maximal OCR in MTC and GPM PDCs. Data are mean ± s.d. of one representative experiment, including n = 6 MTC PDCs, each derived from an independent patient, and n = 6 GPM PDCs, each derived from an independent patient; *P = 0.0165 for ATP-linked OCR, **P = 0.0063 for basal OCR and ***P = 0.0024 for maximal OCR. b, Basal glycolysis in MTC and GPM PDCs. Data are mean ± s.d. of one representative experiment, including n = 6 MTC PDCs, each derived from an independent patient, and n = 6 GPM PDCs, each derived from an independent patient; *P = 0.0129. mpH, milli-pH. c, OCR/ECAR ratio of MTC and GPM PDCs. Data are mean ± s.d. of one representative experiment, including n = 6 MTC PDCs, each derived from an independent patient, and n = 6 GPM PDCs, each derived from an independent patient; ***P = 0.0002. d, Rate of glucose uptake in MTC and GPM PDCs. Data are mean ± s.d. of n = 3 independent experiments for each PDC, each performed in triplicate. Bars on the right-hand side of the graph indicate mean ± s.e.m. of values observed in the two sets of PDCs; n = 7 MTC PDCs and n = 7 GPM PDCs, each derived from an independent patient; ***P = 0.0028. e, Lactate secretion by MTC and GPM PDCs. Data are mean ± s.d. of n = 3 independent experiments for each PDC, each performed in triplicate. Bars on the right-hand side of the graph indicate mean ± s.e.m. of values observed in the two sets of PDCs; n = 7 MTC PDCs and n = 7 GPM PDCs, each derived from an independent patient; ***P = 0.0020. f, Glutamine consumption by MTC and GPM PDCs. Data are mean ± s.e.m. of n = 3 independent experiments for each PDC, each performed in triplicate. Bars on the right-hand side of the graph indicate mean ± s.e.m. of values observed in the two sets of PDCs; n = 7 MTC PDCs and n = 7 GPM PDCs, each derived from an independent patient; ***P = 0.000002. g, Enrichment map network of statistically significant lipid metabolism-related GO categories (logit(NES) > 0.58 and FDR < 0.05, two-sided MWW–GST) in GPM GBM. Nodes represent GO terms and lines their connectivity. Node size is proportional to the number of genes in the GO category, while line thickness indicates similarity coefficient. h, Microphotographs of MTC (top) and GPM (bottom) PDCs stained by Bodipy 493/503 (green); nuclei were counterstained with DAPI (blue). Insets show higher-magnification images of the outlined areas. i, Concentration of triacylglycerol in MTC and GPM PDCs. Data are mean ± s.d. of n = 3 independent experiments for each PDC, each performed in triplicate. Bars on the right-hand side of the graph indicate mean ± s.e.m. of values observed in the two sets of PDCs; n = 7 MTC PDCs and n = 7 GPM PDCs each derived from an independent patient; **P = 0.0032. ac, Experiments were assessed with a minimum of four technical replicates for each PDC. Each of these experiments was repeated independently two times with similar results. In all experiments, significance was established by two-tailed t-test, unequal variance (Source data Fig. 5).
Fig. 6 |
Fig. 6 |. The SLC45A1 glucose-proton symporter on chromosome 1p36.23 has tumor suppressor activity in mitochondrial GBM.
a, Highest-scoring deletions of chromosomal regions significantly associated with GBM subclasses (n = 487 tumors). Circles are color coded and size reflects –log10(P value) of subtype enrichment; *P < 0.10, **P < 0.05, ***P < 0.02, two-sided Fisher’s exact test. P values for individual chromosome bands are reported in Supplementary Table 16e. Blue-to-red scale indicates positive to negative enrichment. b, Top: raw copy number values of genes located on 1p36.23; bottom: homozygous, heterozygous and functional or nonfunctional events colored on a blue scale (lower right). Columns represent samples harboring at least one deleted gene, ordered by SLC45A1 deletion status. Deletion score of each gene by ComFocal (lower left). c, Genomic DNA PCR for ENO1 and SLC45A1 in U87, H423 and H502 cells. GAPDH is shown as control (Source Data Fig. 6). d, Three-dimensional bubble plot showing the frequency of driver genetic alterations in primary and recurrent GBM harboring homozygous deletions of SLC45A1 (n = 8 matched primary and recurrent GBM tumor pairs); left and right axes represent alterations occurring in primary and recurrent tumors, respectively; top axis, alterations shared by both tumors. The size of each bubble is proportional to the number of alterations. e, Rank order plot of genes expressed in MTC versus GPM groups. Genes are ranked from left to right in increasing expression order. Blue dots indicate acid–base transporters differentially downregulated in TCGA GBM and single-cell datasets (n = 175 tumors; n = 1,338 cells from dataset 1; n = 5,604 cells from dataset 2; n = 2,429 cells from dataset 3; log2(FC) < −0.3 and FDR < 0.05, two-sided MWW test). bp, base pairs.
Fig. 7 |
Fig. 7 |. Analysis of SLC45A1 function in GBM cells.
a, Quantification of pHi in MTC and GPM PDCs. Data are mean ± s.d. of n ≥ 3 independent experiments performed in seven MTC and five GPM PDCs, each derived from an independent patient and each assessed by four technical replicates (Source Data Fig. 7). Bars on the right-hand side of the graph indicate mean ± s.d. of the values observed in the two sets of PDCs; n = 7 MTC and n = 5 GPM PDCs, each derived from an independent patient; ***P = 0.000004. b, Immunoblot of FLAG-SLC45A1 in U87 (SLC45A1 wild type) and H502 cells (SLC45A1-deleted). V, vector; SLC, SLC45A1. c, Quantification of pHi in H502 and U87 cells expressing either SLC45A1 or the empty vector. Data are mean ± s.d. from n = 3 independent experiments for U87 and n = 4 independent experiments for H502, each performed with three technical replicates (***P = 0.0078 for vector versus SLC45A1 in H502 cells; NS, not significant). d, Representative images of colony formation of H502 and U87 cells treated as in c. e, Growth curves of independent cultures of cells expressing either SLC45A1 or the empty vector. Data are mean ± s.d from one experiment (n = 4 independent cultures; ***P = 0.00001 for vector versus SLC45A1 in H502 cells. f, Representative microphotographs of PDC-002 and −064 (SLC45A1-deleted) and PDC-078 (SLC45A1 wild type) following ectopic expression of SLC45A1 or the empty vector. g, Quantification of sphere-forming assay for cells treated as described in f. Data are from two independent experiments, each performed with three independent infections (n = 6 independent infections); ***P = 0.0000005 for vector versus SLC45A1 in PDC-002 and ***P = 0.0000001 in PDC-064). Box plots span the first to third quartiles, and whiskers show 1.5× interquartile range. h, Immunoblot of FLAG-SLC45A1 and V5-SLC9A1 in PDC-002 (SLC45A1-deleted) expressing either SLC45A1, SLC9A1, SLC45A1 plus SLC9A1 or the empty vector. i, Quantification of sphere-forming assay for cells described in h. Data are mean ± s.d. from one representative experiment; n = 3 independent infections; ***P = 0.0004, vector (vec) versus SLC45A1; ***P = 0.0001, vector/SLC45A1 versus SLC45A1/SLC9A1. The experiment was repeated two times with similar results. In all experiments, significance was established by two-tailed t-test, unequal variance (Source Data Fig. 7).
Fig. 8 |
Fig. 8 |. MTC PDCs are distinctly sensitive to mitochondrial inhibition.
a–d, Viability curves of 13 MTC and ten GPM PDCs each derived from an independent patient treated with either IACS-010759 (a), metformin (b), tigecycline (c) or menadione (d). Data are mean ± s.d. of n ≥ 3 replicates for each PDC from one representative experiment. e, Top: mitochondrial inhibitor sensitivity score for MTC (blue dots) and GPM (red dots) PDCs (n = 13 MTC PDCs and n = 10 GPM PDCs; Spearman’s correlation, ρ = −0.74, P = 7.563 × 10⁻⁵). Middle: correlation analysis of MTC (blue) and GPM (red) activity in PDCs (n = 25 MTC PDCs and n = 21 GPM PDCs; Spearman’s correlation, ρ = −0.51, P = 0.0003). Bottom: enrichment of fCNV gain and loss of mitochondrial and glycolytic-related genes in MTC PDCs (n = 25) and GPM PDCs (n = 21). The number of genes amplified/deleted in each tumor is color coded (amplifications, red to white; deletions, blue to white). f,g, Viability curves of nine MTC PDCs and nine GPM PDCs, each derived from an independent patient, treated with either FX-11 (f) or DEAB (g). Data are mean ± s.d. from n ≥ 4 replicates for each PDC from one representative experiment. h, Transcriptional regulatory network of GBM subtypes. Representative MRs with differential activity (n = 304 tumors, n = 2,799 cells from dataset 1, n = 9,652 cells from dataset 2 and n = 4,916 cells from dataset 3; two-sided MWW test, FDR < 0.01) in TCGA and at least two out of three single-cell datasets are shown (two-sided MWW–GST test, logit(NES) > 0.58, FDR < 0.01). Nodes represent MRs and target genes, while lines represent interactions. i, Quantification of sphere-forming assay for two MTC and two GPM PDCs, each derived from an independent patient expressing two different short-hairpin RNAs for either PPARGC1A or the empty vector. Data are mean ± s.d. from one representative experiment including n = 3 independent infections for each PDC; **P = 0.0010 and 0.0013 for PDC-002 shRNA1 and shRNA2 versus vector, respectively; **P = 0.0030 and 0.0023 for PDC-026 shRNA1 and shRNA2 versus vector, respectively; *P = 0.0285 for PDC-078 shRNA1 versus vector; *P = 0.0142 for PDC-021 shRNA1 versus vector. j, Cell viability after irradiation of five MTC and five GPM PDCs, each derived from an independent patient. Data are mean ± s.d. of one representative experiment assessed by n = 30 replicates for each PDC; **P = 0.0022. k, ROS quantification in MTC and GPM PDCs. Data are mean ± s.d. of n = 3 independent experiments for each PDC, each performed in triplicate. Bars on the right-hand side of the graph indicate mean ± s.e.m. of values observed in the two sets of PDCs; n = 7 MTC PDCs and n = 7 GPM PDCs, each derived from an independent patient; ***P = 0.00006. Experiments in a–d, f, g, i and j were repeated two times with similar results. In all experiments, significance was evaluated by two-tailed t-test, unequal variance (Source Data Fig. 8).

Comment in

References

    1. Cieslik M & Chinnaiyan AM Cancer transcriptome profiling at the juncture of clinical translation. Nat. Rev. Genet 19, 93–109 (2018). - PubMed
    1. Verhaak RG et al. Integrated genomic analysis identifies clinically relevant subtypes of glioblastoma characterized by abnormalities in PDGFRA, IDH1, EGFR, and NF1. Cancer Cell 17, 98–110 (2010). - PMC - PubMed
    1. Wang Q et al. Tumor evolution of glioma-intrinsic gene expression subtypes associates with immunological changes in the microenvironment. Cancer Cell 32, 42–56 (2017). - PMC - PubMed
    1. Neftel C et al. An integrative model of cellular states, plasticity, and genetics for glioblastoma. Cell 178, 835–849 (2019). - PMC - PubMed
    1. Kim S, Kon M & DeLisi C Pathway-based classification of cancer subtypes. Biol. Direct 7, 21 (2012). - PMC - PubMed

Publication types