

Contrasting transcriptional responses to Fusarium virguliforme colonization in symptomatic and asymptomatic hosts
- PMID: 33681966
- PMCID: PMC8136916
- DOI: 10.1093/plcell/koaa021
Contrasting transcriptional responses to Fusarium virguliforme colonization in symptomatic and asymptomatic hosts
Abstract
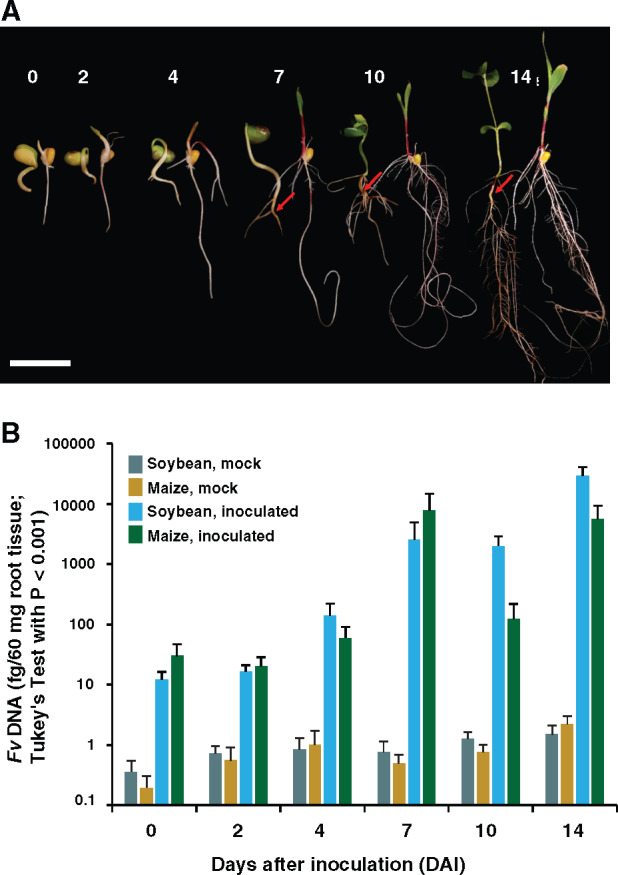
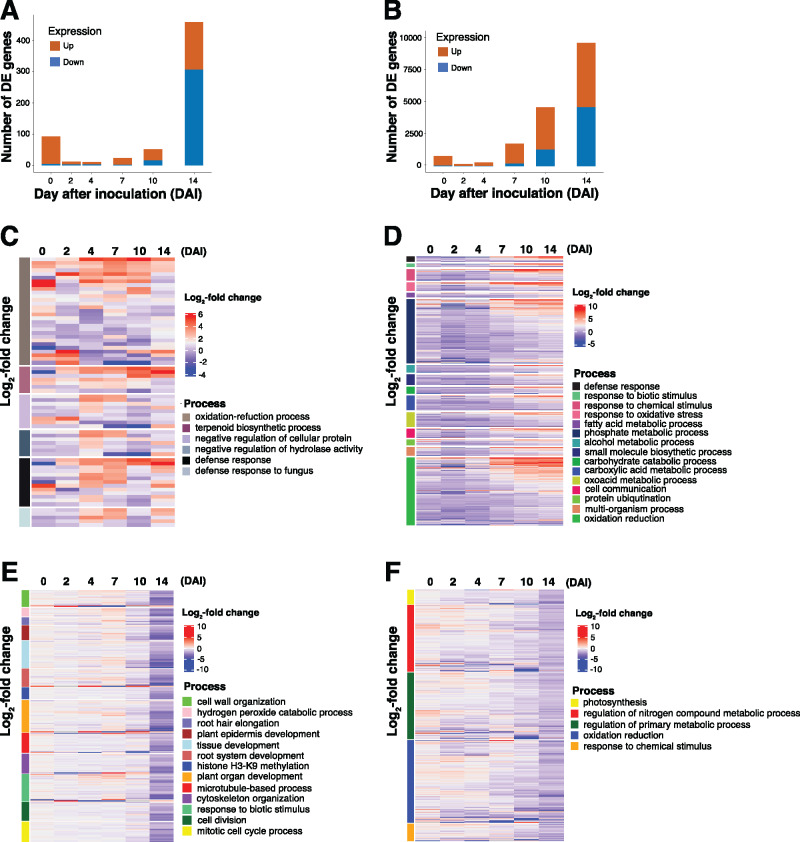
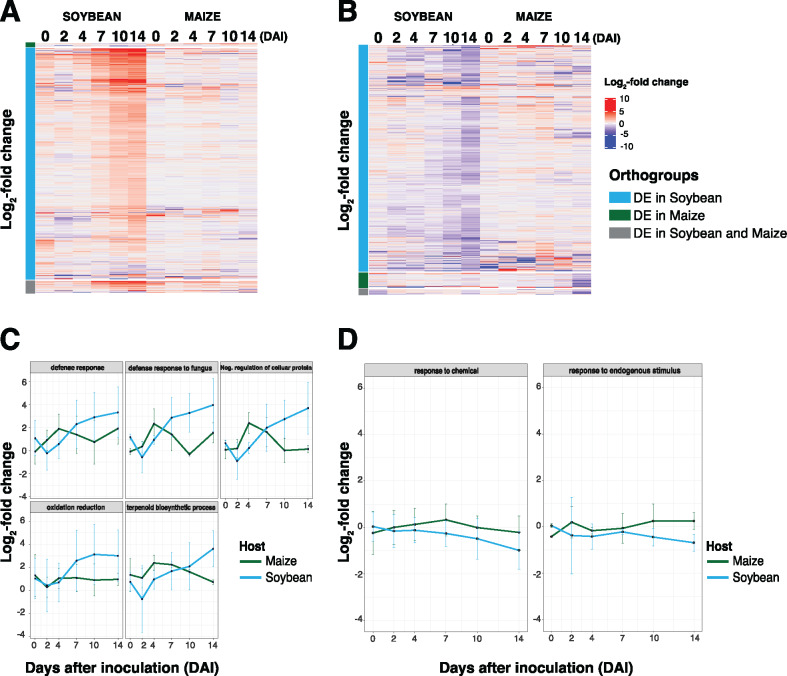
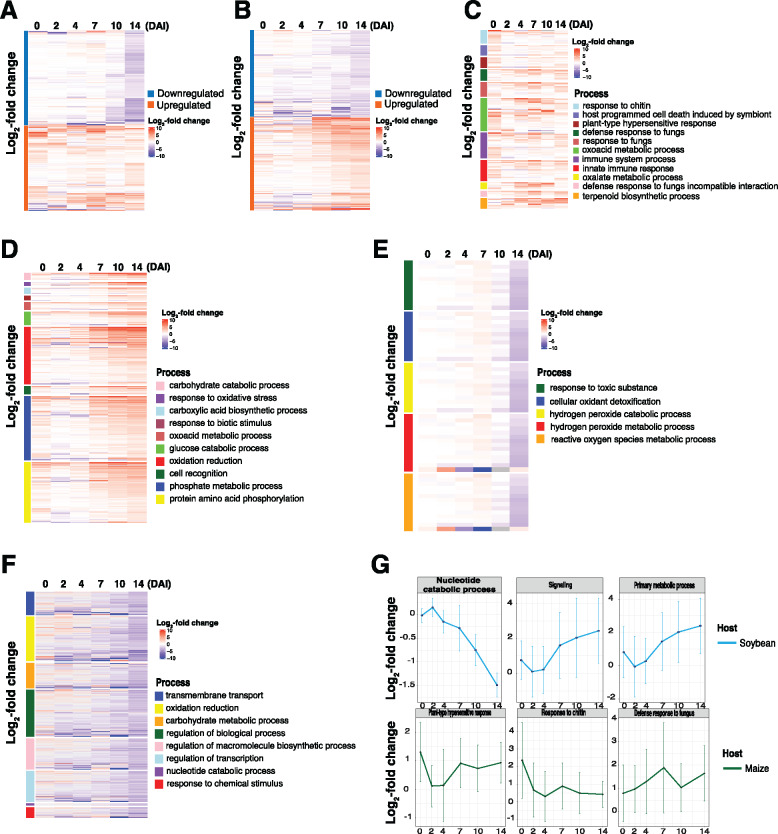
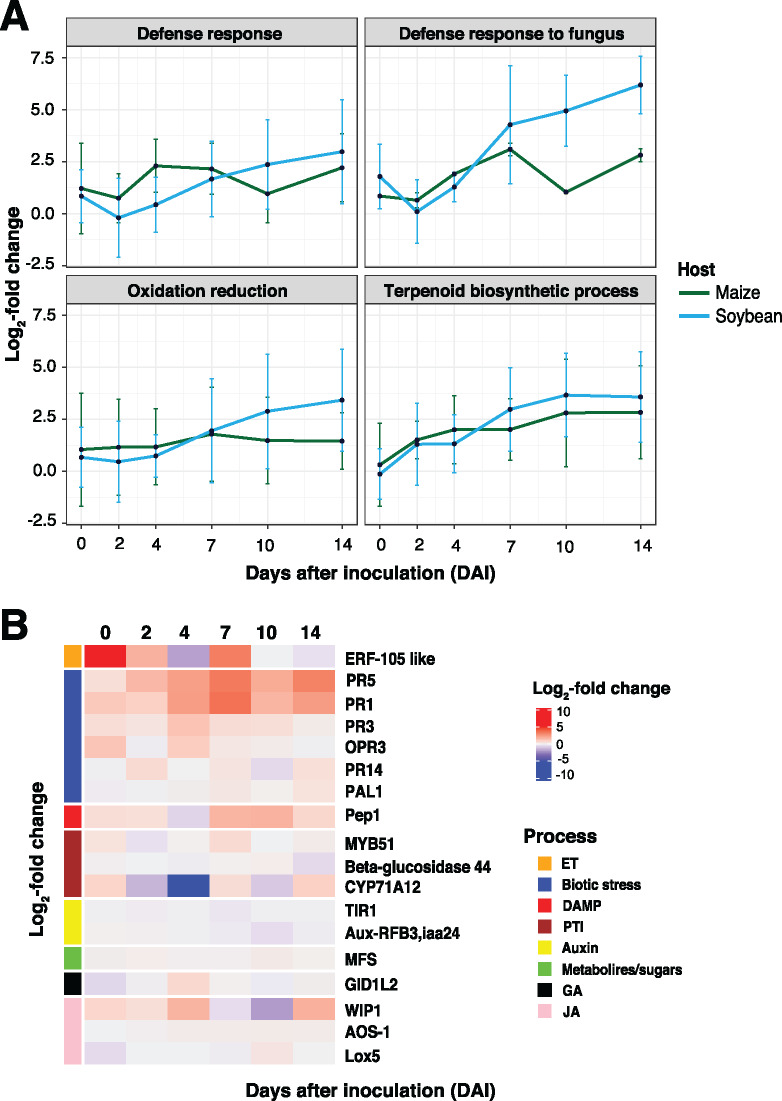
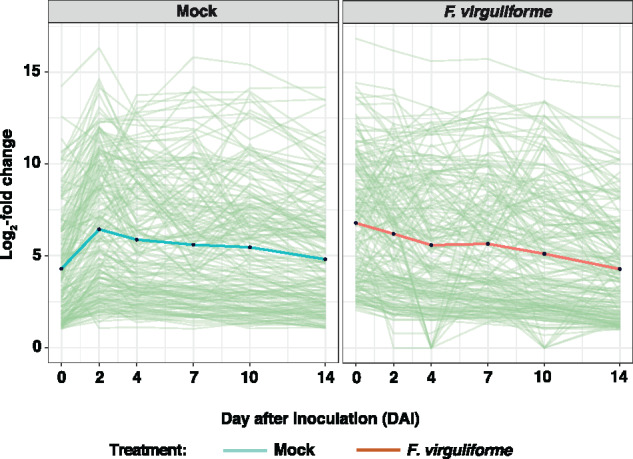
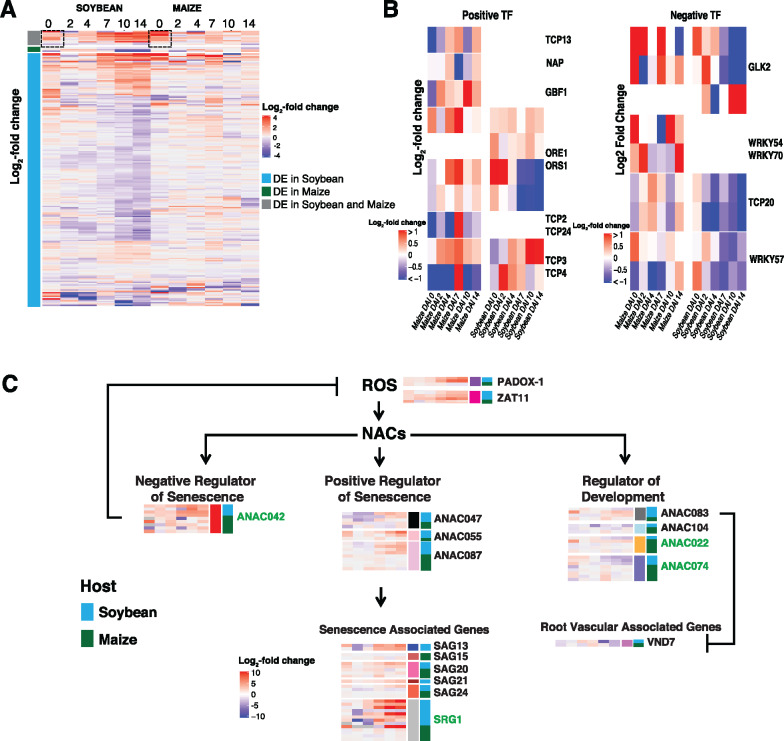
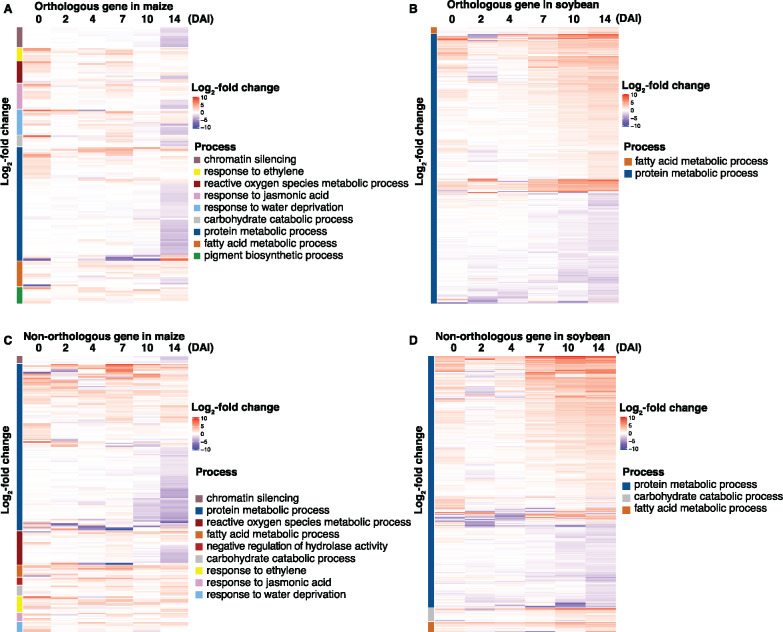
The broad host range of Fusarium virguliforme represents a unique comparative system to identify and define differentially induced responses between an asymptomatic monocot host, maize (Zea mays), and a symptomatic eudicot host, soybean (Glycine max). Using a temporal, comparative transcriptome-based approach, we observed that early gene expression profiles of root tissue from infected maize suggest that pathogen tolerance coincides with the rapid induction of senescence dampening transcriptional regulators, including ANACs (Arabidopsis thaliana NAM/ATAF/CUC protein) and Ethylene-Responsive Factors. In contrast, the expression of senescence-associated processes in soybean was coincident with the appearance of disease symptom development, suggesting pathogen-induced senescence as a key pathway driving pathogen susceptibility in soybean. Based on the analyses described herein, we posit that root senescence is a primary contributing factor underlying colonization and disease progression in symptomatic versus asymptomatic host-fungal interactions. This process also supports the lifestyle and virulence of F. virguliforme during biotrophy to necrotrophy transitions. Further support for this hypothesis lies in comprehensive co-expression and comparative transcriptome analyses, and in total, supports the emerging concept of necrotrophy-activated senescence. We propose that F. virguliforme conditions an environment within symptomatic hosts, which favors susceptibility through transcriptomic reprogramming, and as described herein, the induction of pathways associated with senescence during the necrotrophic stage of fungal development.
© The Author(s) 2020. Published by Oxford University Press on behalf of American Society of Plant Biologists.
Figures
Similar articles
-
Fusarium virguliform e Transcriptional Plasticity Is Revealed by Host Colonization of Maize versus Soybean.Plant Cell. 2020 Feb;32(2):336-351. doi: 10.1105/tpc.19.00697. Epub 2019 Dec 18. Plant Cell. 2020. PMID: 31852777 Free PMC article.
-
Influence of Fusarium virguliforme Temporal Colonization of Corn, Tillage, and Residue Management on Soybean Sudden Death Syndrome and Soybean Yield.Plant Dis. 2021 Oct;105(10):3250-3260. doi: 10.1094/PDIS-09-20-1964-RE. Epub 2021 Oct 26. Plant Dis. 2021. PMID: 33406860
-
Arabidopsis nonhost resistance gene PSS1 confers immunity against an oomycete and a fungal pathogen but not a bacterial pathogen that cause diseases in soybean.BMC Plant Biol. 2012 Jun 13;12:87. doi: 10.1186/1471-2229-12-87. BMC Plant Biol. 2012. PMID: 22694952 Free PMC article.
-
Transcriptomics of cereal-Fusarium graminearum interactions: what we have learned so far.Mol Plant Pathol. 2018 Mar;19(3):764-778. doi: 10.1111/mpp.12561. Epub 2017 Jun 7. Mol Plant Pathol. 2018. PMID: 28411402 Free PMC article. Review.
-
Transcripts and tumors: regulatory and metabolic programming during biotrophic phytopathogenesis.F1000Res. 2018 Nov 19;7:F1000 Faculty Rev-1812. doi: 10.12688/f1000research.16404.1. eCollection 2018. F1000Res. 2018. PMID: 30519451 Free PMC article. Review.
Cited by
-
Albedo- and Flavedo-Specific Transcriptome Profiling Related to Penicillium digitatum Infection in Citrus Fruit.Foods. 2021 Sep 16;10(9):2196. doi: 10.3390/foods10092196. Foods. 2021. PMID: 34574307 Free PMC article.
-
A fungal sesquiterpene biosynthesis gene cluster critical for mutualist-pathogen transition in Colletotrichum tofieldiae.Nat Commun. 2023 Sep 6;14(1):5288. doi: 10.1038/s41467-023-40867-w. Nat Commun. 2023. PMID: 37673872 Free PMC article.
-
Cell wall-related genes and lignin accumulation contribute to the root resistance in different maize (Zea mays L.) genotypes to Fusarium verticillioides (Sacc.) Nirenberg infection.Front Plant Sci. 2023 Jun 27;14:1195794. doi: 10.3389/fpls.2023.1195794. eCollection 2023. Front Plant Sci. 2023. PMID: 37441182 Free PMC article.
-
Transcriptome Analysis of Fusarium Root-Rot-Resistant and -Susceptible Alfalfa (Medicago sativa L.) Plants during Plant-Pathogen Interactions.Genes (Basel). 2022 Apr 28;13(5):788. doi: 10.3390/genes13050788. Genes (Basel). 2022. PMID: 35627172 Free PMC article.
References
-
- Alexa A, Rahnenfuhrer J (2018) topGO: Enrichment analysis for gene ontology. R package version 2.36.0
-
- Allardyce JA, Rookes JE, Hussain HI, Cahill DM (2013) Transcriptional profiling of Zea mays roots reveals roles for jasmonic acid and terpenoids in resistance against Phytophthora cinnamomi. Funct Integr Genom 13: 217–228 - PubMed
-
- Allen TW, Bradley CA, Sisson AJ, Byamukama E, Chilvers MI, Coker CM, Collins AA, Damicone JP, Dorrance AE, Dufault NS, et al. (2017) Soybean yield loss estimates due to diseases in the United States and Ontario, Canada, from 2010 to 2014. Plant Health Prog 18: 19–27
Publication types
MeSH terms
Substances
Grants and funding
LinkOut - more resources
Full Text Sources
