

Genetic characterization of a Sorghum bicolor multiparent mapping population emphasizing carbon-partitioning dynamics
- PMID: 33681979
- PMCID: PMC8759819
- DOI: 10.1093/g3journal/jkab060
Genetic characterization of a Sorghum bicolor multiparent mapping population emphasizing carbon-partitioning dynamics
Abstract
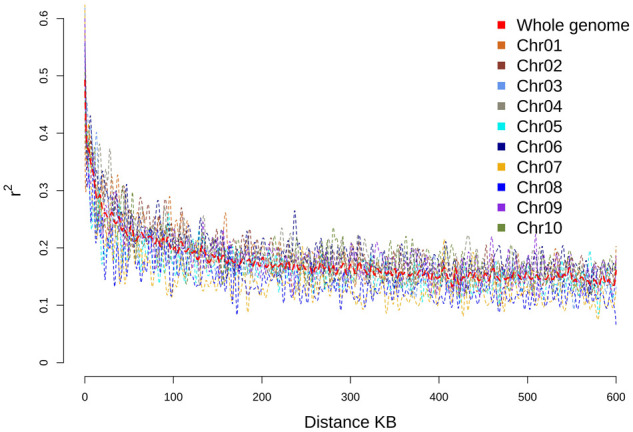
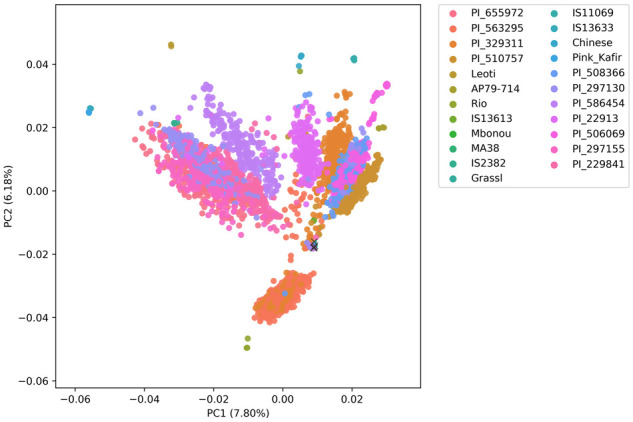
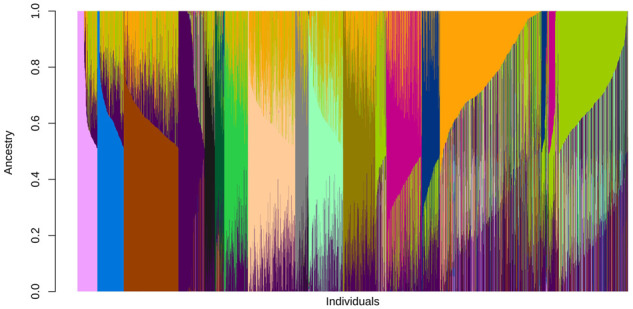
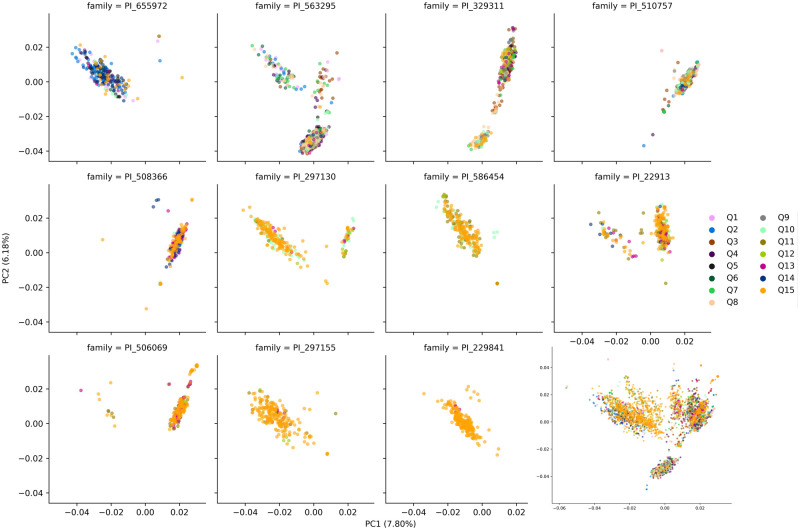
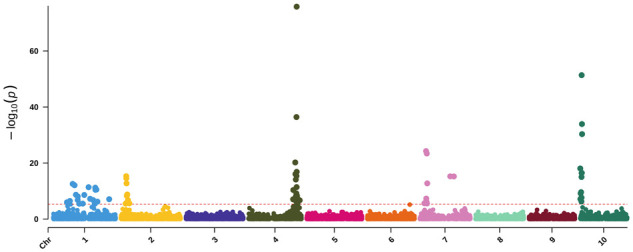
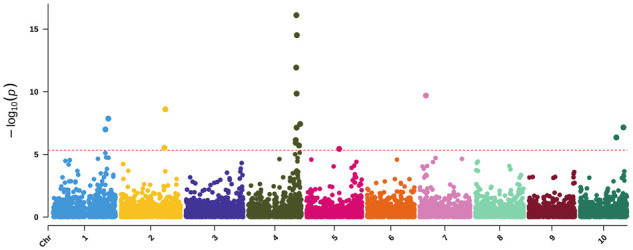
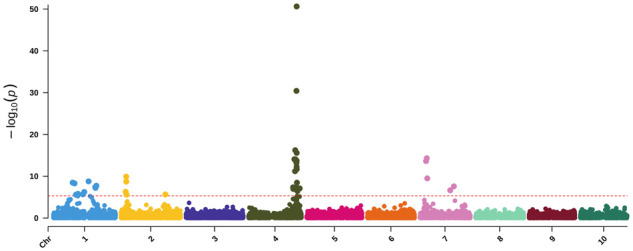
Sorghum bicolor, a photosynthetically efficient C4 grass, represents an important source of grain, forage, fermentable sugars, and cellulosic fibers that can be utilized in myriad applications ranging from bioenergy to bioindustrial feedstocks. Sorghum's efficient fixation of carbon per unit time per unit area per unit input has led to its classification as a preferred biomass crop highlighted by its designation as an advanced biofuel by the U.S. Department of Energy. Due to its extensive genetic diversity and worldwide colonization, sorghum has considerable diversity for a range of phenotypes influencing productivity, composition, and sink/source dynamics. To dissect the genetic basis of these key traits, we present a sorghum carbon-partitioning nested association mapping (NAM) population generated by crossing 11 diverse founder lines with Grassl as the single recurrent female. By exploiting existing variation among cellulosic, forage, sweet, and grain sorghum carbon partitioning regimes, the sorghum carbon-partitioning NAM population will allow the identification of important biomass-associated traits, elucidate the genetic architecture underlying carbon partitioning and improve our understanding of the genetic determinants affecting unique phenotypes within Poaceae. We contrast this NAM population with an existing grain population generated using Tx430 as the recurrent female. Genotypic data are assessed for quality by examining variant density, nucleotide diversity, linkage decay, and are validated using pericarp and testa phenotypes to map known genes affecting these phenotypes. We release the 11-family NAM population along with corresponding genomic data for use in genetic, genomic, and agronomic studies with a focus on carbon-partitioning regimes.
Keywords: MPP; carbon-partitioning; genome-wide association study; genotype-by-sequencing; multiparental populations; nested association mapping; pericarp color.
© The Author(s) 2021. Published by Oxford University Press on behalf of Genetics Society of America.
Figures
References
-
- Ali ML, Rajewski JF, Baenziger PS, Gill KS, Eskridge KM, et al. 2008. Assessment of genetic diversity and relationship among a collection of US sweet sorghum germplasm by SSR markers. Mol Breed. 21:497–509.
-
- Astle W, Balding DJ.. 2009. Population structure and cryptic relatedness in genetic association studies. Statist Sci. 24:451–471.
Publication types
MeSH terms
Substances
Associated data
LinkOut - more resources
Full Text Sources
Other Literature Sources
Miscellaneous