. 2021 Apr 20;143(16):1614-1628.
doi: 10.1161/CIRCULATIONAHA.120.051921. Epub 2021 Mar 8.

Sex-Specific Control of Human Heart Maturation by the Progesterone Receptor

Affiliations

Sex-Specific Control of Human Heart Maturation by the Progesterone Receptor

Choon Boon Sim et al. Circulation. .

Abstract

Background: Despite in-depth knowledge of the molecular mechanisms controlling embryonic heart development, little is known about the signals governing postnatal maturation of the human heart.

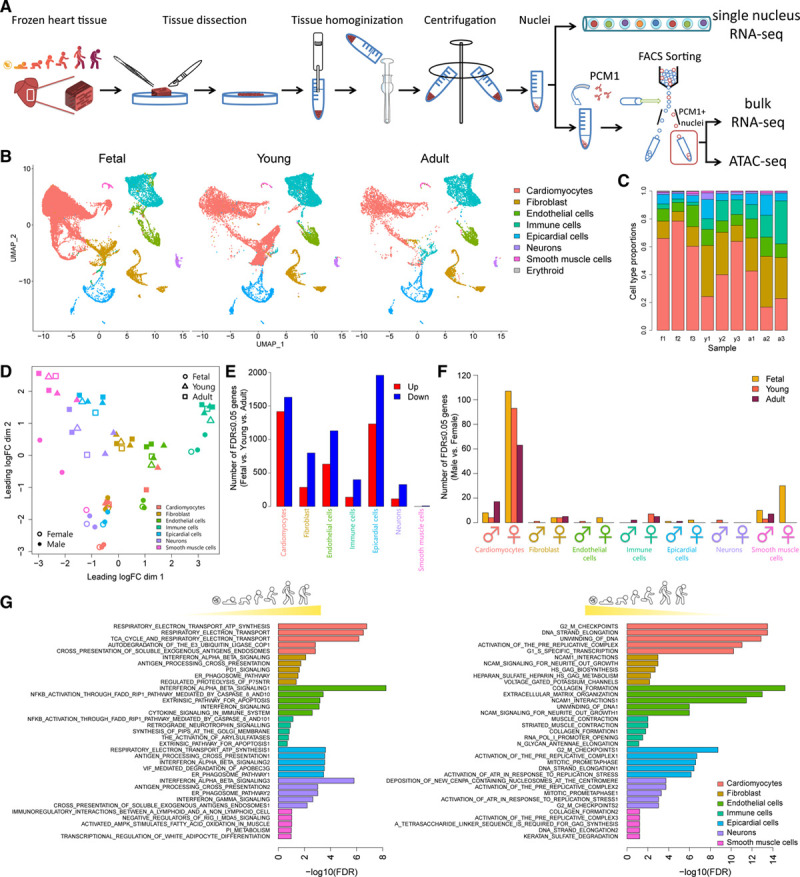
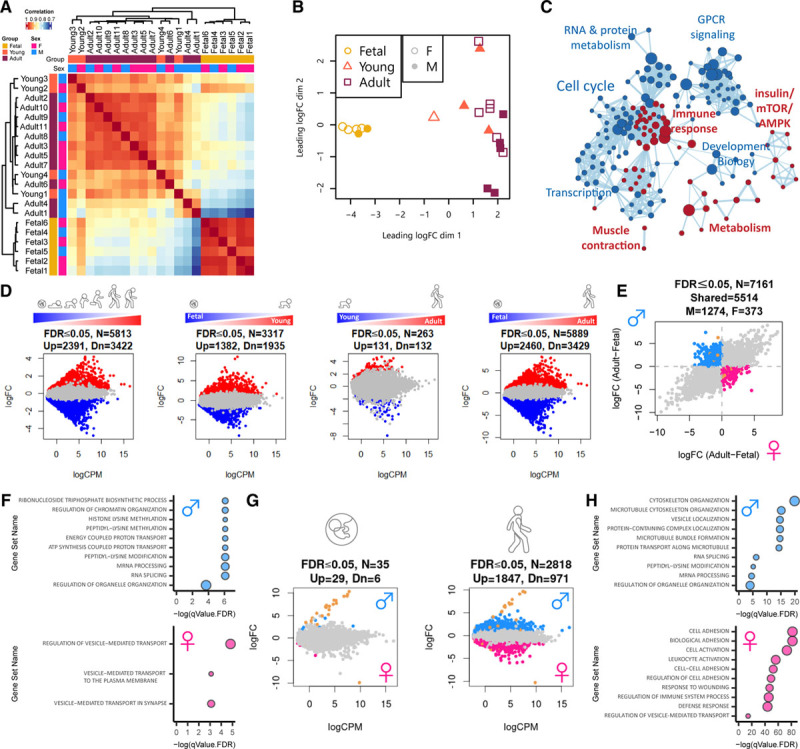
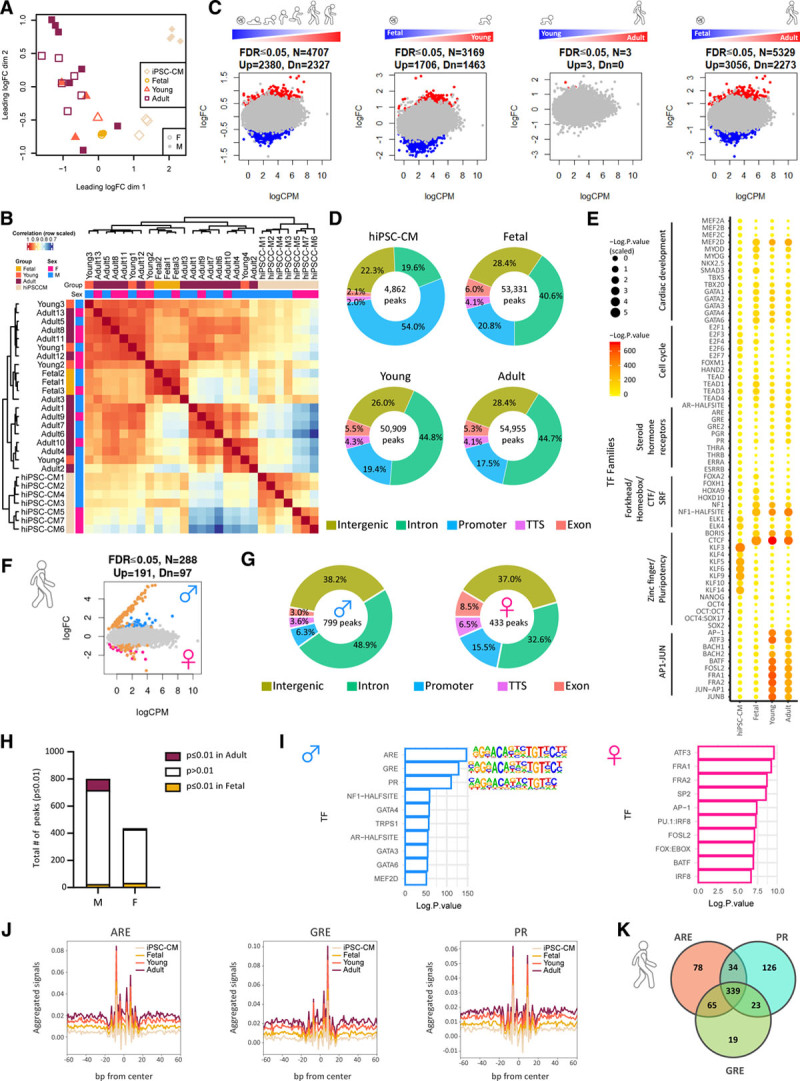
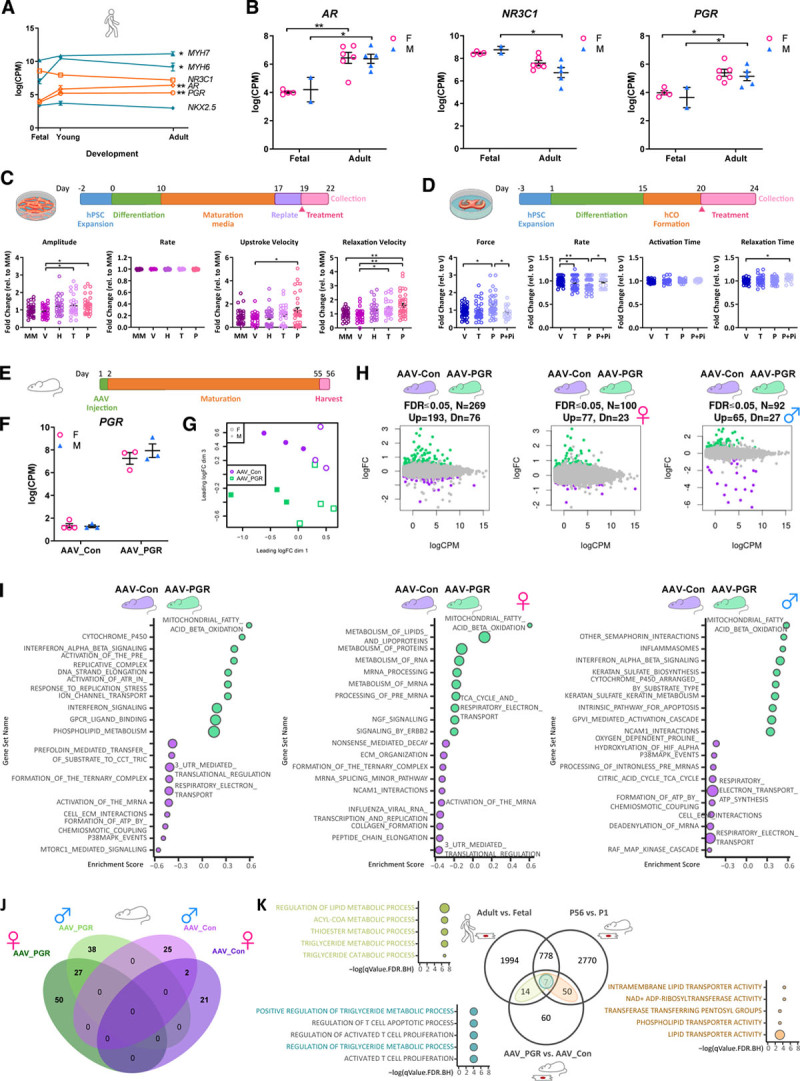
Methods: Single-nucleus RNA sequencing of 54 140 nuclei from 9 human donors was used to profile transcriptional changes in diverse cardiac cell types during maturation from fetal stages to adulthood. Bulk RNA sequencing and the Assay for Transposase-Accessible Chromatin using sequencing were used to further validate transcriptional changes and to profile alterations in the chromatin accessibility landscape in purified cardiomyocyte nuclei from 21 human donors. Functional validation studies of sex steroids implicated in cardiac maturation were performed in human pluripotent stem cell-derived cardiac organoids and mice.

Results: Our data identify the progesterone receptor as a key mediator of sex-dependent transcriptional programs during cardiomyocyte maturation. Functional validation studies in human cardiac organoids and mice demonstrate that the progesterone receptor drives sex-specific metabolic programs and maturation of cardiac contractile properties.

Conclusions: These data provide a blueprint for understanding human heart maturation in both sexes and reveal an important role for the progesterone receptor in human heart development.

Keywords: chromatin; hormone; human development; progesterone; sexual maturation; transcription factor.


Figures

Figure 1.
Figure 1.
SnRNA-seq reveals age- and sex-dependent maturation of cardiac cells during human development. A, Schematic of nuclei isolation for snRNA-seq, bulk RNA-seq, and ATAC-seq. B, UMAP plot of nuclei showing distinct clusters of cardiac cell types at different stages of human heart development. C, Bar plot of cell type proportions for each biological replicate (f = fetal, y = young, a = adult, 1–3 denote biological replicate). D, MDS plot displaying pseudobulk profiles of cell types in samples. The largest projection of expression variation is shown on the x axis, and the second largest orthogonal projection is on the y axis. E, Bar plot of the number of DE genes in each cell type showing the number of DE genes that are progressively upregulated (red) or downregulated (blue) during human heart development from fetal to adult stages. F, Bar plot showing the number of DE genes between males and females across different cell types in fetal (gold), young (orange), and adult (maroon). G, GSEA reactome analysis of developmentally upregulated (left) and downregulated (right) genes for each cardiac cell type. Top 5 gene sets displayed for each cell type. ATAC-seq indicates Assay for Transposase-Accessible Chromatin using sequencing; DE, differentially expressed; GSEA, gene set enrichment analysis; MDS, multidimensional scaling; snRNA-seq, single-nucleus RNA sequencing; and UMAP, Uniform Manifold Approximation and Projection.
Figure 2.
Figure 2.
Cardiomyocytes undergo sex-specific transcriptional maturation during human development. A, Pearson correlation heat map of bulk RNA-seq showing distinct clustering of PCM1-purified cardiomyocytes from fetal versus young and adult samples. B, MDS plot illustrating the largest source of variation in the data are between fetal (gold circles) versus young (orange triangles) and adult (maroon squares) cardiomyocytes with some separation of female versus male (open versus closed) cardiomyocytes evident in adult samples. C, Cytoscape representation of GSEA reactome analysis of genes that are progressively upregulated (red) or downregulated (blue) during human cardiomyocyte maturation from fetal to adult stages. D, Mean-difference scatter plots highlighting differentially expressed genes (both sexes) for all comparisons including dynamically regulated genes (fetal>young>adult), fetal versus young, young versus adult, and fetal versus adult cardiomyocytes. Genes that are significantly upregulated (red) or downregulated (blue) are highlighted (FDR≤0.05). E, Log-fold change scatter plot of developmentally regulated genes (fetal versus adult) displaying reciprocal regulation during cardiomyocyte maturation in males and females. Genes that are upregulated in males and downregulated in females (blue), upregulated in females and downregulated in males (pink), or on chromosome X or Y (gold) are highlighted. F, Gene ontology analysis for genes that are upregulated in males and downregulated in females (blue) or upregulated in females and downregulated in males (pink). G, Mean-difference scatter plots comparing male versus female cardiomyocytes at fetal (left) and adult (right) stages. Genes that are upregulated in males (blue), upregulated in females (pink), or on chromosome X or Y (gold) are highlighted (FDR≤0.05). H, Gene ontology analysis of differentially expressed genes between adult male (blue) and female (pink) cardiomyocytes. An FDR≤0.05 using the correction procedure of Benjamini and Hochberg was used. FDR indicates false discovery rate; GSEA, gene set enrichment analysis; and MDS, multidimensional scaling.
Figure 3.
Figure 3.
Cardiomyocyte maturation is associated with sex-specific chromatin remodeling around steroid hormone nuclear receptor motifs during human heart development. A, MDS plot shows that the largest source of variation in the ATAC-seq data are between the hiPSC-CM (apricot) and fetal (gold), young (orange), and adult (maroon) samples. Female samples are indicated with open plotting characters and male closed. B, Pearson correlation heat map of bulk ATAC-seq illustrating distinct clustering of PCM1-purified cardiomyocytes from hiPSC-CM versus fetal, young, and adult samples. C, Mean-difference scatter plots of differentially regulated open chromatin regions for all comparisons including dynamically regulated regions (fetal>young>adult), fetal versus young, young versus adult, and fetal versus adult cardiomyocytes. Regions that are more accessible (red) or less accessible (blue) are highlighted (FDR≤0.05). D, Genomic distribution of ATAC-seq peaks in each group. E, TF motif predictions for open chromatin regions in hiPSC-CM, fetal, young, and adult cardiomyocytes. Circle size and color denotes the statistical significance of enriched TFs at each specific time point. F, Mean-difference scatter plot of open chromatin regions in adult male versus female cardiomyocytes. Regions that are more accessible in females (pink), more accessible in males (blue), or on chromosome X or Y (gold) are highlighted. G, Genomic distribution of differentially regulated open chromatin regions in adult male and female cardiomyocytes. H, Bar plot showing number of developmentally regulated ATAC-seq peaks (fetal = gold, adult = maroon) for differentially open chromatin regions in adult male (M) and female (F) cardiomyocytes. I, Bar plot showing significantly enriched TF binding motifs in differentially regulated open chromatin regions between adult male (blue) and female (pink) cardiomyocytes. J, TF footprinting for ARE, GRE, and PR confirming increased binding to open chromatin regions in adult (maroon) and young (orange) cardiomyocytes versus fetal (gold) and iPSC-derived (apricot) cardiomyocytes. Venn diagram showing shared and unique transcription factor binding sites for ARE, GRE, and PR in open chromatin regions of adult cardiomyocytes compared with fetal. An FDR≤0.05 with the correction procedure of Benjamini and Hochberg was used. ARE indicates androgen response element; ATAC-seq, Assay for Transposase-Accessible Chromatin using sequencing; FDR, false discovery rate; GRE, glucocorticoid response element; hiPSC-CM, human induced pluripotent stem cell cardiomyocyte; iPSC, induced pluripotent stem cell; MDS, multidimensional scaling; PR, progesterone receptor; and TF, transcription factor.
Figure 4.
Figure 4.
The progesterone receptor augments cardiac contractility and activates sex-specific metabolic networks associated with cardiomyocyte maturation. A, Gene expression (log CPM reads) showing developmental regulation of sarcomeric genes (MYH6, MYH7), cardiac TFs (NKX2.5), and nuclear steroid hormone receptors (AR, NR3C1, PGR) during human cardiomyocyte maturation. Data are mean±SEM. *FDR≤0.05; **FDR≤0.001. B, Gene expression (log CPM reads) for nuclear steroid hormone receptors (AR, GR, PGR) in male (blue) versus female (pink) cardiomyocytes at fetal and adult stages. Data are mean±SEM. *FDR≤0.05, **FDR≤0.001. C, Progesterone treatment increases contractile force of 2-dimensional hESC-CMs. Dot plots showing baseline-normalized functional readouts for HES3 NKX2-5eGFP/w cardiomyocytes cultured in MM and treated with vehicle (V: 0.1% ethanol), glucocorticoids (G: 1 µM hydrocortisone), testosterone (T: 1 µmol/L of testosterone), or progesterone (P: 10 µmol/L of progesterone). Data are presented as fold change for n=5 independent experiments with >27 replicates per condition. A 1-way ANOVA followed by a Tukey posttest was used. Data are mean±SEM. *P≤0.05, **P≤0.001. D, Progesterone treatment increases contractile force and decreases spontaneous beating rate of hCOs. Dot plots showing functional readouts of H9 hCOs cultured in MM and treated with vehicle (V: 0.1% ethanol), progesterone (P: 10 µmol/L of progesterone), or progesterone inhibitor (P+Pi: 10 µmol/L of progesterone + 10µM RU-486). Data are presented as fold change for n=6 independent experiments with n>19 tissues per group, respectively. Data are mean±SEM. A 1-way ANOVA followed by a Tukey posttest was used. *P≤0.05, **P≤0.001. E, Schematic overview of AAV-PGR gain-of-function experiment in mice. F, Gene expression (log CPM reads) for PGR in PCM1-purified cardiomyocytes from AAV-PGR and AAV-Con treated adult female (pink) and male (blue) mice. Data are mean±SEM. G, MDS plot shows clear separation of female (open) and male (closed) PCM1-purified cardiomyocytes (dimension 1) from control AAV-Con (green) and AAV-PGR-treated (purple) mice (dimension 3). H, Mean-difference scatter plots of AAV-PGR versus AAV-Con (combined male and female, female only, and male only). Genes that are upregulated in AAV-PGR (green) or AAV-Con (purple) are highlighted (FDR≤0.05). I, GSEA reactome analysis of differentially expressed genes between AAV-PGR (green) and AAV-Con (purple) for combined male and female, female only, and male only samples. J, Venn diagram of differentially expressed genes in male and female AAV-Con and AAV-PGR–treated cardiomyocytes. Genes that are upregulated in AAV-PGR (green), upregulated in AAV-Con (purple), upregulated in male (light shade), or upregulated in female (dark shade) are highlighted. K, Venn diagram and pathway analysis for mouse and human gene orthologs that are upregulated in 3 comparisons: 1) AAV-PGR versus AAV-Con, 2) adult (postnatal day [P] 56) versus neonatal (P1) mouse cardiomyocytes, and 3) adult versus fetal human cardiomyocytes. Genes/pathways that are shared between AAV-PGR upregulated and adult mouse upregulated are highlighted in brown, AAV-PGR upregulated and adult human upregulated are highlighted in green, and genes/pathways that are common across all 3 comparisons are highlighted in blue. An FDR≤0.05 with the correction procedure of Benjamini and Hochberg was used. AAV indicates adeno-associated viral vector; Con, control; CPM, count per million; FDR, false discovery rate; GSEA, gene set enrichment analysis; hCO, human cardiac organoid; hESC, human embryonic stem cell; MDS, multidimensional scaling; MM, maturation media; PGR, progesterone receptor; and TF, transcription factor.

Comment in

References

    1. Guo Y, Pu WT. Cardiomyocyte maturation: new phase in development. Circ Res. 2020;126:1086–1106. doi: 10.1161/CIRCRESAHA.119.315862 - PMC - PubMed
    1. Vivien CJ, Hudson JE, Porrello ER. Evolution, comparative biology and ontogeny of vertebrate heart regeneration. NPJ Regen Med. 2016;1:16012. doi: 10.1038/npjregenmed.2016.12 - PMC - PubMed
    1. Cui Y, Zheng Y, Liu X, Yan L, Fan X, Yong J, Hu Y, Dong J, Li Q, Wu X, et al. Single-cell transcriptome analysis maps the developmental track of the human heart. Cell Rep. 2019;26:1934–1950.e5. doi: 10.1016/j.celrep.2019.01.079 - PubMed
    1. DeLaughter DM, Bick AG, Wakimoto H, McKean D, Gorham JM, Kathiriya IS, Hinson JT, Homsy J, Gray J, Pu W, et al. Single-cell resolution of temporal gene expression during heart development. Dev Cell. 2016;39:480–490. doi: 10.1016/j.devcel.2016.10.001 - PMC - PubMed
    1. Lescroart F, Wang X, Lin X, Swedlund B, Gargouri S, Sànchez-Dànes A, Moignard V, Dubois C, Paulissen C, Kinston S, et al. Defining the earliest step of cardiovascular lineage segregation by single-cell RNA-seq. Science. 2018;359:1177–1181. doi: 10.1126/science.aao4174 - PMC - PubMed

Publication types

Substances