. 2021 Mar 8;6(5):e139019.
doi: 10.1172/jci.insight.139019.

Epithelial miR-141 regulates IL-13-induced airway mucus production

Affiliations

Epithelial miR-141 regulates IL-13-induced airway mucus production

Sana Siddiqui et al. JCI Insight. .

Abstract

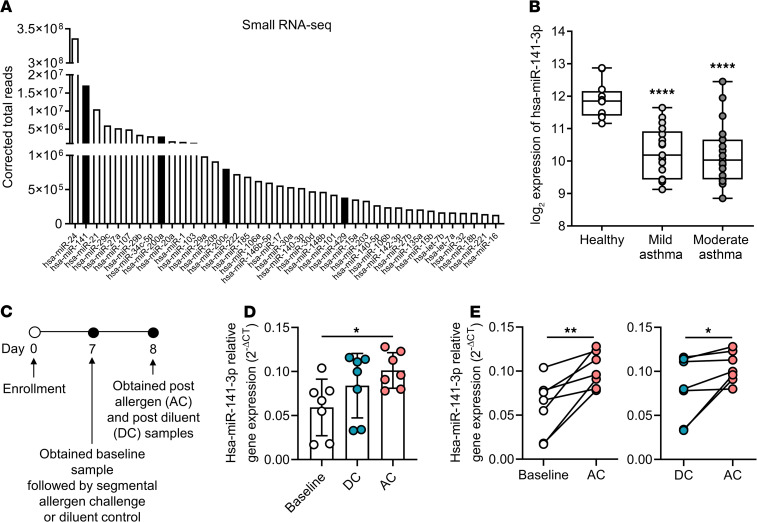
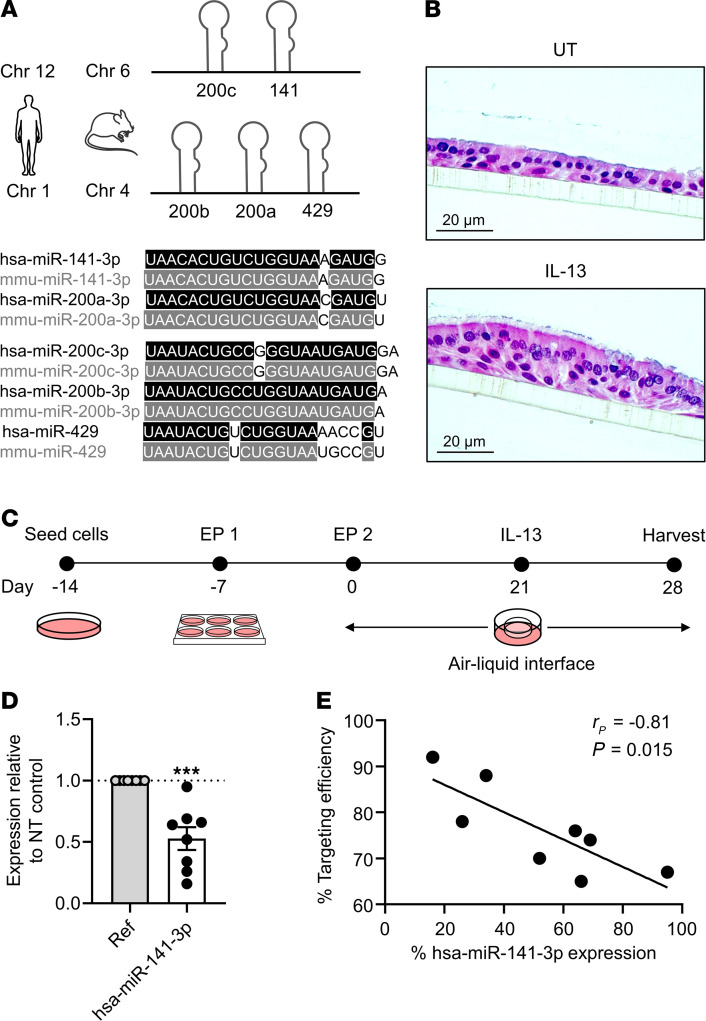
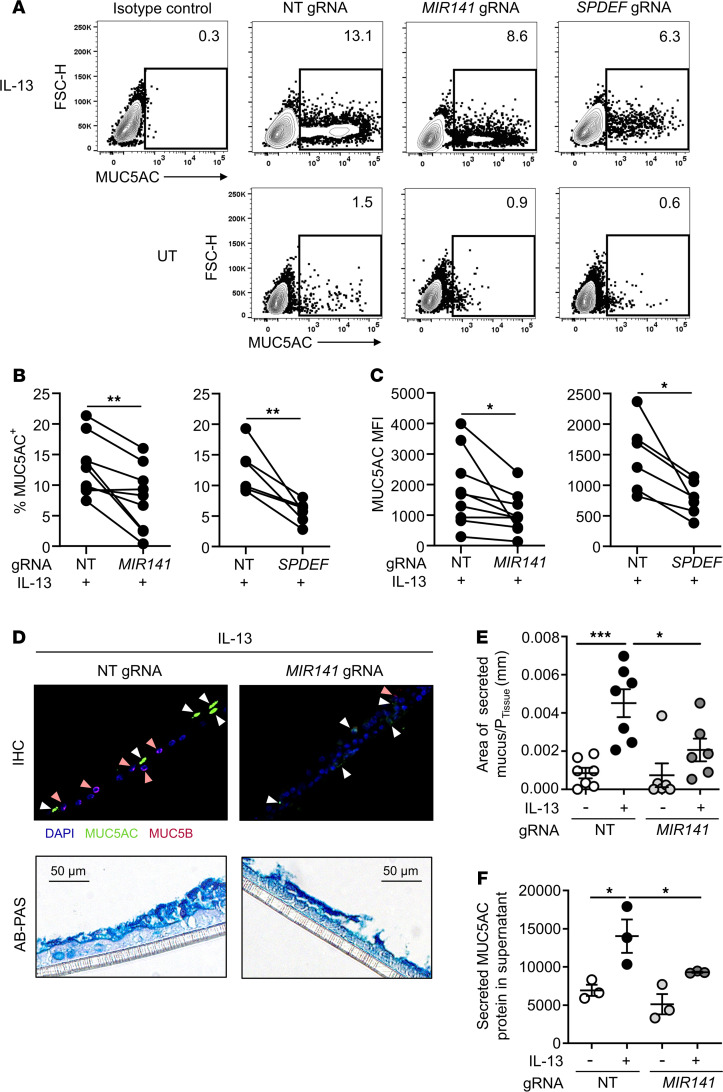
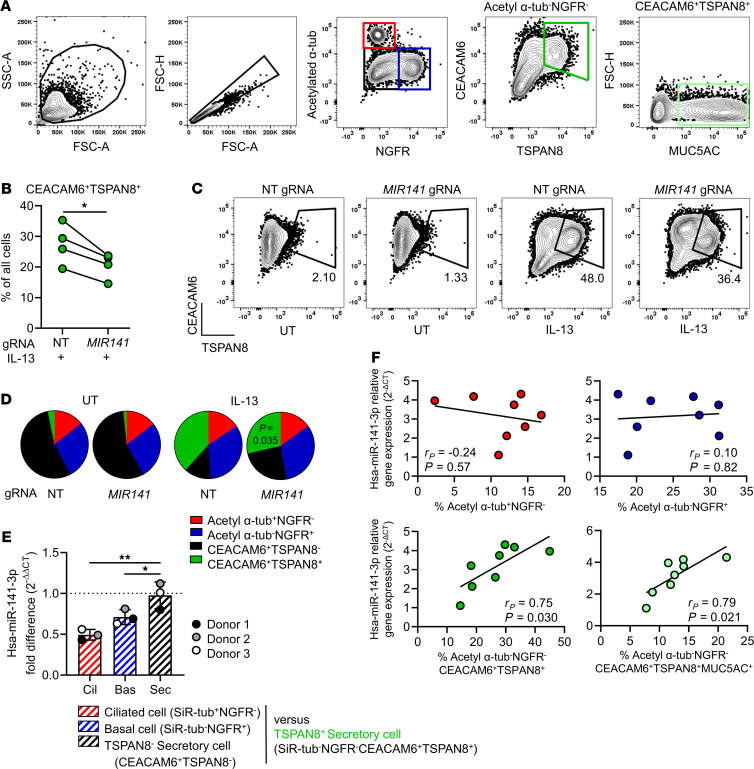
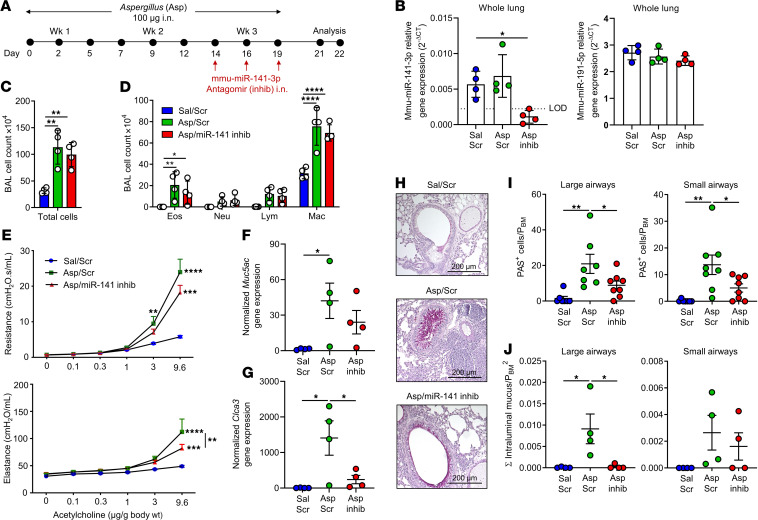
IL-13-induced goblet cell metaplasia contributes to airway remodeling and pathological mucus hypersecretion in asthma. miRNAs are potent modulators of cellular responses, but their role in mucus regulation is largely unexplored. We hypothesized that airway epithelial miRNAs play roles in IL-13-induced mucus regulation. miR-141 is highly expressed in human and mouse airway epithelium, is altered in bronchial brushings from asthmatic subjects at baseline, and is induced shortly after airway allergen exposure. We established a CRISPR/Cas9-based protocol to target miR-141 in primary human bronchial epithelial cells that were differentiated at air-liquid-interface, and goblet cell hyperplasia was induced by IL-13 stimulation. miR-141 disruption resulted in decreased goblet cell frequency, intracellular MUC5AC, and total secreted mucus. These effects correlated with a reduction in a goblet cell gene expression signature and enrichment of a basal cell gene expression signature defined by single cell RNA sequencing. Furthermore, intranasal administration of a sequence-specific mmu-miR-141-3p inhibitor in mice decreased Aspergillus-induced secreted mucus and mucus-producing cells in the lung and reduced airway hyperresponsiveness without affecting cellular inflammation. In conclusion, we have identified a miRNA that regulates pathological airway mucus production and is amenable to therapeutic manipulation through an inhaled route.

Keywords: Asthma; Noncoding RNAs; Pulmonology; Th2 response.


Conflict of interest statement

Conflict of interest: AM is a cofounder, member of the boards of directors, and member of the scientific advisory boards of Spotlight Therapeutics and Arsenal Biosciences. AM served as an advisor to Juno Therapeutics, was a member of the scientific advisory board of PACT Pharma, and was an advisor to Trizell. AM owns stock in Arsenal Biosciences, Spotlight Therapeutics, and PACT Pharma. The Marson laboratory has received research funding from Epinomics, Sanofi, GlaxoSmithKline, Anthem, and Gilead.

Figures

Figure 1
Figure 1. miR-141 is abundantly expressed in the human airway epithelium and induced upon airway allergen challenge in asthma.
(A) Forty most highly expressed miRNAs by small RNA sequencing analysis of bronchial epithelial brushings (n = 16). miR-141/200 family miRNAs (141/200a/200c/429) are highlighted by black bars. (B) Microarray analysis of hsa-miR-141-3p in human epithelial brushings from mild asthmatics (not using inhaled corticosteroids) and moderate asthmatics (using inhaled corticosteroids) compared with healthy controls (n = 12–16/group, 1-way ANOVA with Dunnett’s multiple comparison test, ****P < 0.0001). (C) Timeline of segmental airway allergen challenge of allergic asthmatic subjects for collection of bronchial brushings. (D and E) Expression level of hsa-miR-141-3p by TaqMan qPCR in bronchial brushings collected at baseline and 1 day following allergen challenge (AC) or diluent control (DC) demonstrated by group (D) and paired analysis (E) (n = 7/group, 1-way ANOVA followed by Dunnett’s multiple comparison test, *P < 0.05, in D; 2-tailed paired t test; *P < 0.05, **P < 0.01 in E).
Figure 2
Figure 2. CRISPR/Cas9-mediated knockdown of miR-141 in primary HBECs grown at air-liquid interface.
(A) Mature miRNA sequences and genomic location of the miR-141/200 family in humans and mice. (B) Representative H&E-stained filter sections of human bronchial epithelial cells (HBECs) cultured at air-liquid-interface (ALI) under untreated (UT) conditions or IL-13 stimulation, harvested on day 28 (representative of 4 unique donors). Scale bar: 20 μm. (C) Electroporation-based (EP-based) CRISPR/Cas9 protocol established in an in vitro ALI system (days 0–28, ± IL-13 on days 21–28) using HBECs. (D) Expression level of hsa-miR-141-3p by TaqMan qPCR following administration of MIR141-targeting versus nontargeting (NT) gRNAs normalized to reference miRNAs hsa-miR-103a-3p and hsa-miR-191-5p (Ref) (n = 8, 2-tailed t test; ***P < 0.001). (E) Correlation of MIR141-targeting efficiency score assessed by Sanger DNA sequencing and ICE Synthego analysis and hsa-miR-141-3p expression levels by qPCR. rP, Pearson correlation coefficient.
Figure 3
Figure 3. CRISPR/Cas9 targeting of miR-141 reduces IL-13–induced mucus.
(A) Representative contour plots demonstrating MUC5AC+ cells in ALI-cultured human bronchial epithelial cells (HBECs) stimulated with (top panel) or without IL-13 (untreated controls; UT) (bottom panel) that have undergone gene editing with nontargeting (NT), MIR141, or SPDEF gRNAs. (AC)Analysis was performed by intracellular flow cytometry (gated on forward scatter, FSC, singlets). Paired analysis of MUC5AC+ cells (% of all HBECs) (B) and MUC5AC mean fluorescent intensity (MFI) (C) (n = 9, 2-tailed paired t test, *P < 0.05, **P < 0.01). (D) HBEC filter sections stained with fluorescent antibodies for MUC5AC and MUC5B (top panel, positive staining indicated by white and pink arrows, respectively) and Alcian Blue-Periodic Acid Schiff (AB-PAS) (bottom panel). Scale bar: 50 μm. (E and F) Quantification of mucus-producing cells in AB-PAS–stained HBEC filter sections (E) and secreted MUC5AC assessed by dot blot analysis of apical wash (F) from ALI-cultured HBECs following NT or MIR141 gRNA delivery (n = 3–7/group, 1-way ANOVA followed by the Holm-Sidak test; *P < 0.05, ***P < 0.001).
Figure 4
Figure 4. miR-141 repression in gene-edited airway epithelial cells is associated with a reduction in mucus-producing goblet cell numbers.
(A) Flow cytometry gating strategy of acetylated α-tubulin+NGFR (red gate, ciliated cells), acetylated α-tubulinNGFR+ (blue gate, basal cells), acetylated α-tubulinNGFRCEACAM6+TSPAN8+ (green gate, secretory cells), and acetylated α-tubulinNGFRCEACAM6+TSPAN8+MUC5AC+ (light green gate, MUC5AC+ secretory cells) cells. (B) Frequency of acetylated α-tubulinNGFRCEACAM6+TSPAN8+ secretory cells (% of all cells, n = 4/group) in human bronchial epithelial cell (HBEC) cultures that have undergone gene editing with nontargeting (NT) or MIR141-targeting gRNAs, subsequently grown at air-liquid-interface (ALI) with IL-13 stimulation (2-tailed paired t test). (C) Representative contour plots demonstrating CEACAM6+TSPAN8+ secretory cells in ALI cultures of untreated (UT, left) or IL-13–stimulated (right) HBECs after gene editing with NT or MIR141 gRNAs. (D) Frequency of ciliated cells (red), basal cells (blue), TSPAN8 secretory cells (black), and TSPAN8+ secretory cells (green) (% of all cells, n = 4/group) in ALI-cultured NT or MIR141-targeted HBECs with (IL-13) or without (UT) IL-13 (2-tailed paired t test). (E) Hsa-miR-141-3p expression fold difference assessed by TaqMan qPCR in FAC-sorted ciliated cells (SiR-tubulin+NGFR), basal cells (SiR-tubulinNGFR+), and TSPAN8 secretory cells compared with IL-13–inducible TSPAN8+ secretory cells (1-way ANOVA followed by Dunnett’s test; *P < 0.05, **P < 0.01). (F) Hsa-miR-141-3p expression levels assessed by TaqMan qPCR in relation to frequency of red, blue, green, or light green cell gates (as in A). rP, Pearson correlation coefficient.
Figure 5
Figure 5. MIR141 targeting interferes with IL-13 signaling and results in reduced expression of goblet cell genes.
Single cell RNA sequencing analysis of bronchial epithelial brushings obtained from allergic asthmatic subjects 24 hours after segmental allergen challenge (n = 4) or diluent control (n = 4). (A) Overlay of cellular clusters from allergen challenge and diluent control. (B) Eighteen identified cellular gene clusters with annotations. (C) Gene set enrichment analysis of 100 goblet cell cluster genes (Supplemental Table 3) in human bronchial epithelial cells (HBECs) that have undergone gene editing with nontargeting (NT) or MIR141 gRNAs, subsequently grown at air-liquid-interface with IL-13 stimulation (n = 4/group). (D) Upstream regulator SPDEF (P = 2.5 × 10⁻¹²) identified by Ingenuity Pathway Analysis (IPA) of genes differentially expressed (FDR < 0.1) in NT HBECs following IL-13 stimulation. (E) Overlapping and uniquely expressed genes (IL-13 versus untreated) in NT and MIR141 gRNA HBEC cultures (n = 3–4/group) assessed by RNA sequencing (χ2 test; ****P < 0.0001).
Figure 6
Figure 6. MIR141-targeted HBECs demonstrate increased basal cell gene expression.
(A) Gene Set Enrichment Analysis of basal cell genes (100 genes, basal cell cluster 1; 62 genes, basal cell cluster 2) in human bronchial epithelial cells (HBECs) that have undergone gene editing with nontargeting (NT) or MIR141 gRNAs, subsequently grown at air-liquid-interface (ALI) with IL-13 stimulation (n = 4/group). Basal cell clusters were identified by single cell RNA sequencing analysis of bronchial epithelial brushings obtained from allergic asthmatic subjects (n = 4) (Supplemental Table 3). (B) Hsa-miR-141-3p expression levels in ALI-cultured HBEC cultures from day 4 (confluent) to day 22 (differentiated) assessed by microarray (n = 2 samples/time point).
Figure 7
Figure 7. miR-141-3p targets a large number of genes expressed during the transition from basal cell to mucus secretory cell.
(A) Percentage TargetScan predicted hsa-miR-141-3p targets in distinct clusters identified by pseudotime gene expression analysis of epithelial cell differentiation from basal-like presecretory cells into mucus secretory cells in human airways. Pseudotime gene expression analysis was published by Goldfarbmuren et al. (24). (B) Percent predicted targets in pseudotime gene clusters of all TargetScan-predicted hsa-miR-141-3p targets. (C) Type of protein encoded by 281 TargetScan-predicted hsa-miR-141-3p gene targets found in pseudotime clusters. (D) Sixty-five TargetScan-predicted miR-141-3p gene targets found in pseudotime clusters and identified by differential CLEAR-CLIP analysis of primary murine epithelial cells from WT, miR-200 family–induced, and miR-200 family–double deficient mice (n = 3/group) (26). (E) Expression by RNA sequencing of 65 miR-141-3p target genes in HBECs that have undergone gene editing with NT or MIR141 gRNAs, subsequently grown at ALI with IL-13 stimulation (n = 4/group). (F) Gene expression, as assessed by single cell RNA sequencing, of bronchial epithelial brushings obtained from allergic asthmatic subjects 24 hours after segmental allergen challenge (n = 4) or diluent control (n = 4).
Figure 8
Figure 8. Blockade of mmu-miR-141-3p improves airway hyperresponsiveness and decreases secreted mucus in an experimental mouse model of asthma.
(A) Timeline of allergen-induced model of asthma induced by intranasal (i.n.) exposure to fungal allergen Aspergillus fumigatus (Asp) 3 times per week for 3 weeks; details are provided in the Methods section. (B) Expression level of mmu-miR-141-3p (left) and nontargeting control mmu-miR-191-5p (right) in whole lung tissue by TaqMan qPCR normalized to reference miRNA mmu-miR-103-3p (n = 4, 1-way ANOVA followed by Tukey test; *P < 0.05). (C and D) Total cells (C) and cellular distribution (D) in bronchoalveolar lavage (BAL) obtained from mice exposed to Asp in combination with mmu-miR-141-3p antagomir (Asp/miR-141 inhib), Asp in combination with scrambled antagomir (Asp/Scr), and sterile saline in combination with Scr antagomir (Sal/Scr) (n = 7-8/group, 1-way (C) or 2-way (D) ANOVA followed by Tukey test; *P < 0.05, **P < 0.01, ****P < 0.0001). Eos, eosinophils; Neu, neutrophils; Lym, lymphocytes; Mac, macrophages. (E) Total respiratory system resistance and elastance measured in mice exposed to Asp/miR-141 inhib, Asp/Scr, and Sal/Scr (n = 7–8/group, repeated measures 2-way ANOVA followed by Bonferroni correction; **P < 0.01, ***P < 0.001, ****P < 0.0001). (F and G) Gene expression of Muc5ac (F) and Clca1 (G) assessed by qPCR analysis of lung tissue homogenate 72 hours after the final allergen challenge (n = 4/group, 1-way ANOVA followed by the Tukey test; *P < 0.05). (H) Representative Alcian Blue–Periodic Acid Schiff–stained (AB-PAS–stained) lung sections from Asp/miR-141 inhib, Asp/Scr, and Sal/Scr mice (representative of 4 mice). (I and J) Quantification of PAS+ cells per perimeter of basal membrane (I) and intraluminal mucus per basal membrane area (J) in large (>0.80 mm) and small (<0.80 mm) airways (n = 7–8/group, 1-way ANOVA followed by the Tukey test; *P < 0.05, **P < 0.01).

Similar articles

Cited by

References

    1. Fernández-Blanco JA, et al. Attached stratified mucus separates bacteria from the epithelial cells in COPD lungs. JCI Insight. 2018;3(17):120994. - PMC - PubMed
    1. Hansson GC. Mucus and mucins in diseases of the intestinal and respiratory tracts. J Intern Med. 2019;285(5):479–490. doi: 10.1111/joim.12910. - DOI - PMC - PubMed
    1. Dunican EM, et al. Mucus plugs in patients with asthma linked to eosinophilia and airflow obstruction. J Clin Invest. 2018;128(3):997–1009. doi: 10.1172/JCI95693. - DOI - PMC - PubMed
    1. Hays SR, Fahy JV. The role of mucus in fatal asthma. Am J Med. 2003;115(1):68–9. doi: 10.1016/S0002-9343(03)00260-2. - DOI - PubMed
    1. Dunican EM, et al. Autopsy and imaging studies of mucus in asthma. Lessons learned about disease mechanisms and the role of mucus in airflow obstruction. Ann Am Thorac Soc. 2018;15(Suppl 3):S184–S191. - PMC - PubMed

Publication types

MeSH terms