. 2021 Mar;129(3):37002.
doi: 10.1289/EHP7102. Epub 2021 Mar 8.

Aggressiveness and Metastatic Potential of Breast Cancer Cells Co-Cultured with Preadipocytes and Exposed to an Environmental Pollutant Dioxin: An in Vitro and in Vivo Zebrafish Study

Affiliations

Aggressiveness and Metastatic Potential of Breast Cancer Cells Co-Cultured with Preadipocytes and Exposed to an Environmental Pollutant Dioxin: An in Vitro and in Vivo Zebrafish Study

Meriem Koual et al. Environ Health Perspect. 2021 Mar.

Abstract

Background: Breast cancer (BC) is a major public health concern, and its prognosis is very poor once metastasis occurs. The tumor microenvironment and chemical pollution have been suggested recently to contribute, independently, to the development of metastatic cells. The BC microenvironment consists, in part, of adipocytes and preadipocytes in which persistent organic pollutants (POPs) can be stored.

Objectives: We aimed to test the hypothesis that these two factors (2,3,7,8-tetrachlorodibenzo-p-dioxin (TCDD), an extensively studied, toxic POP and the microenvironment) may interact to increase tumor aggressiveness.

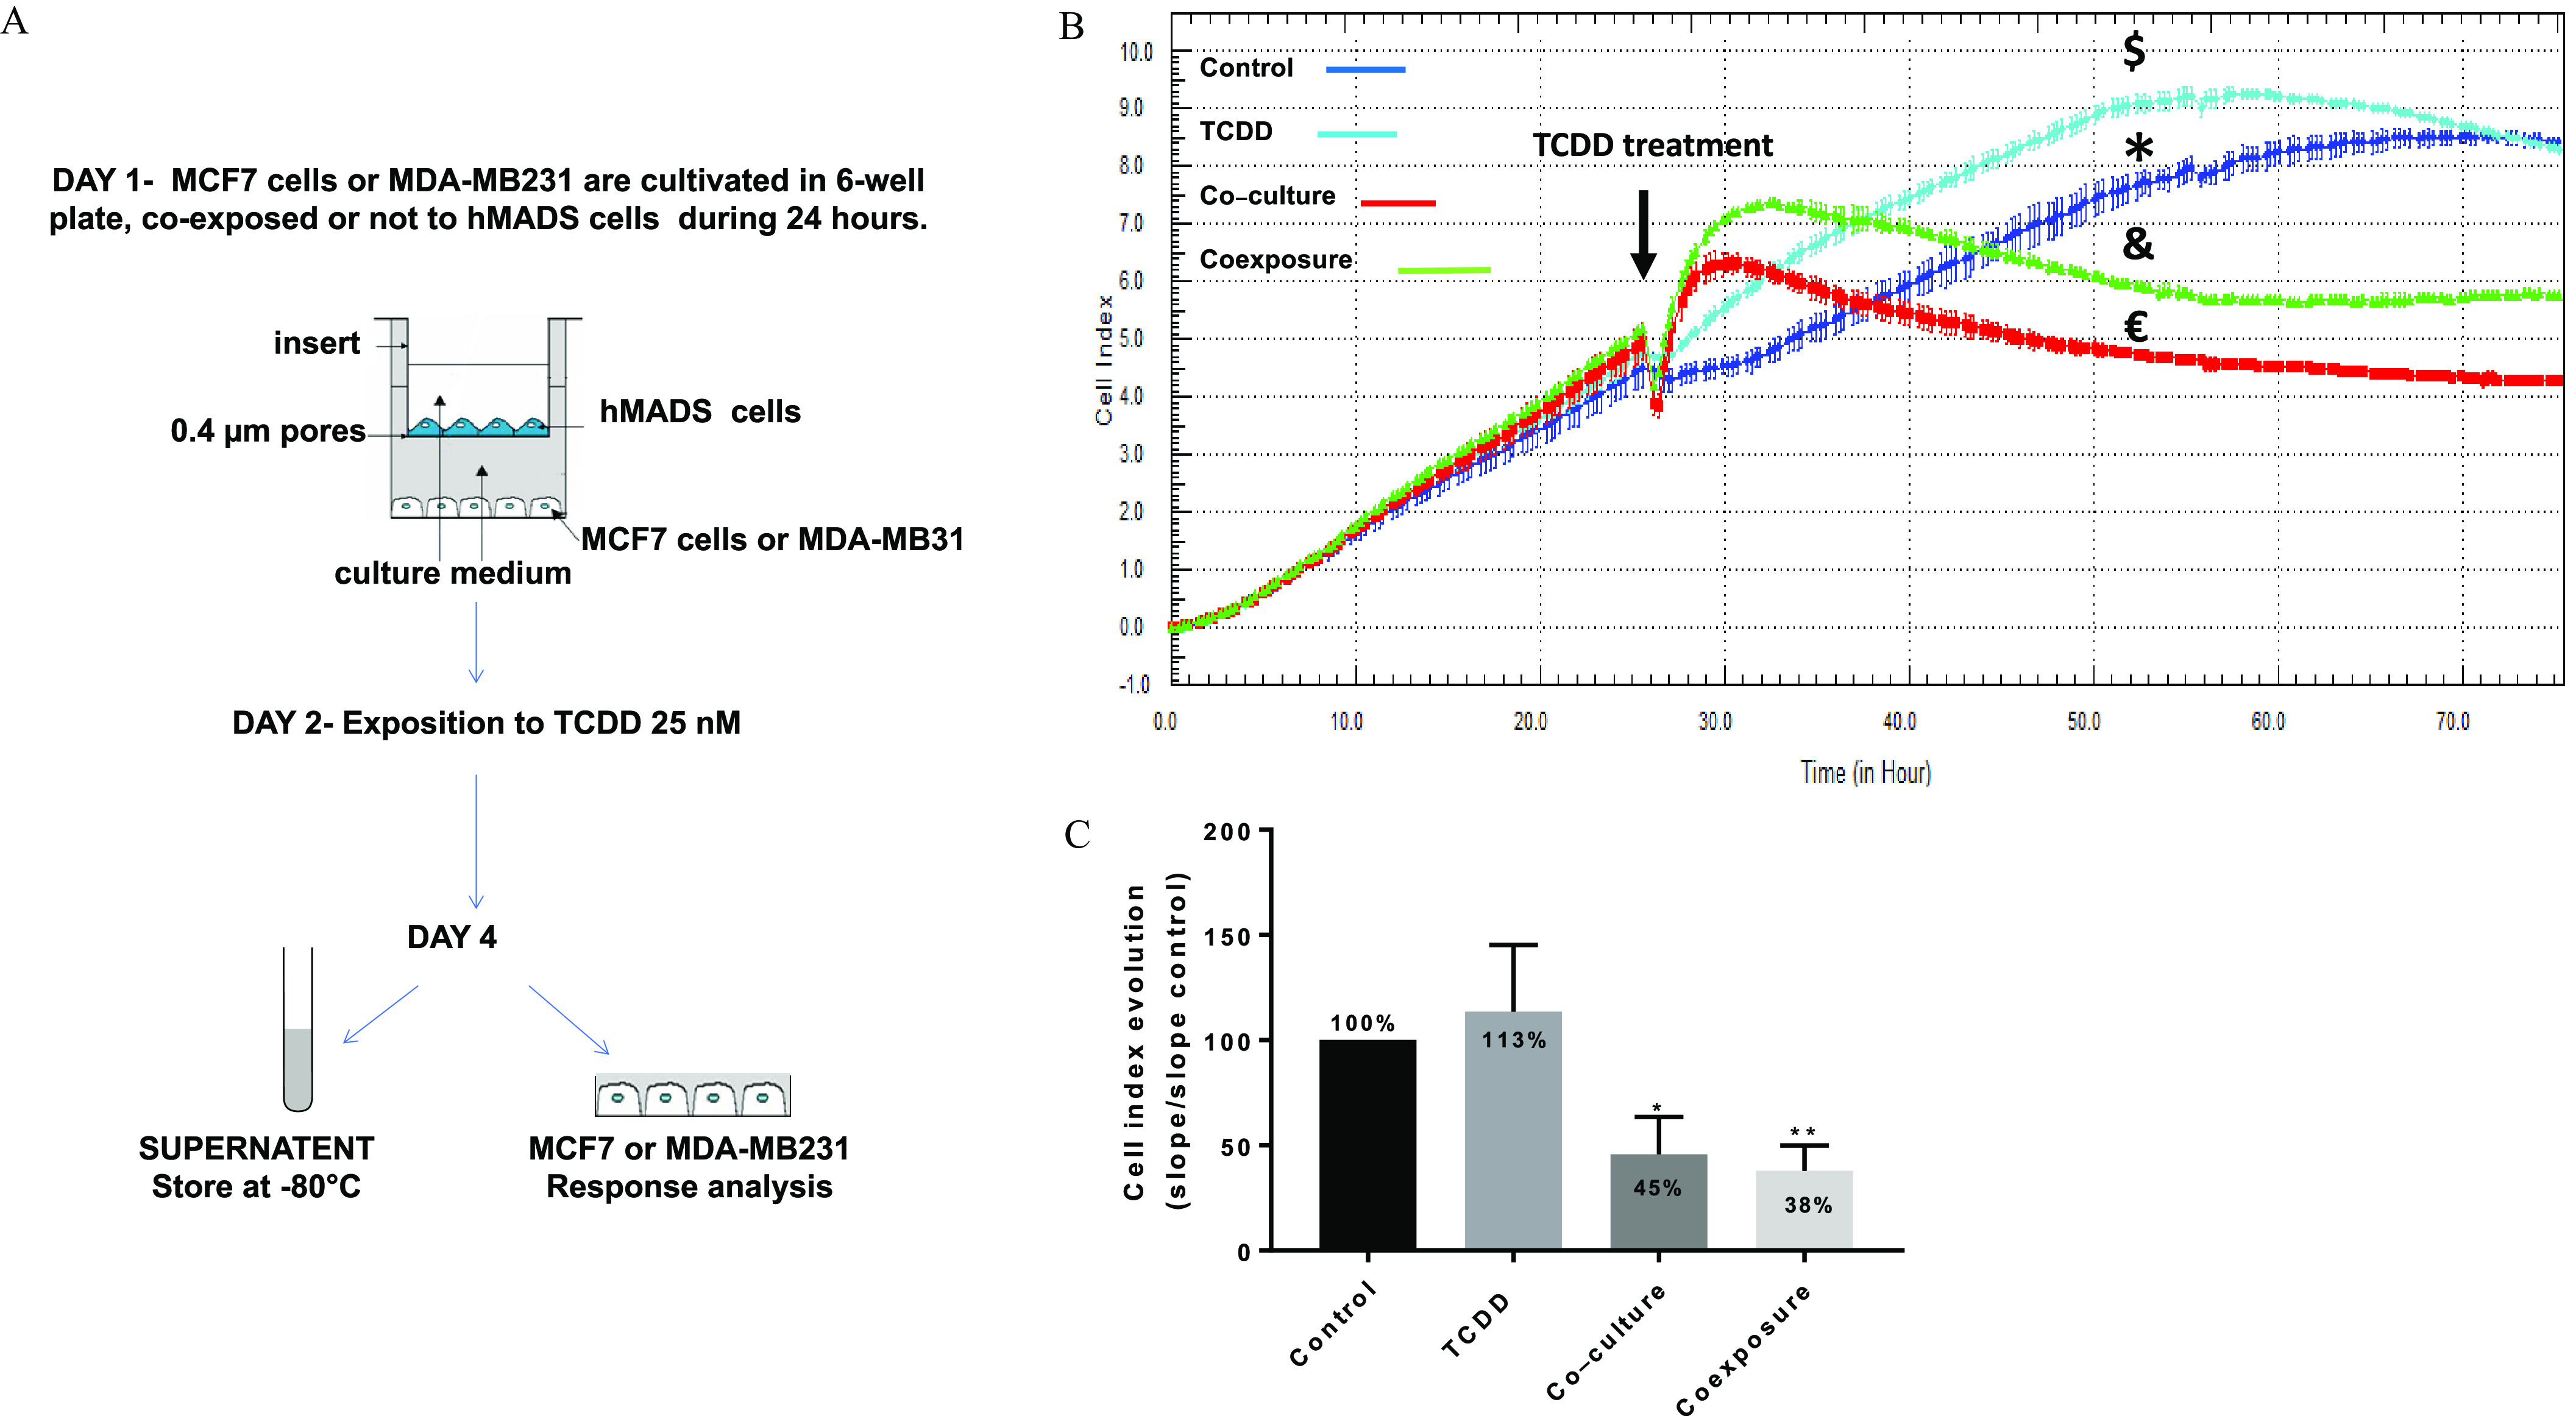
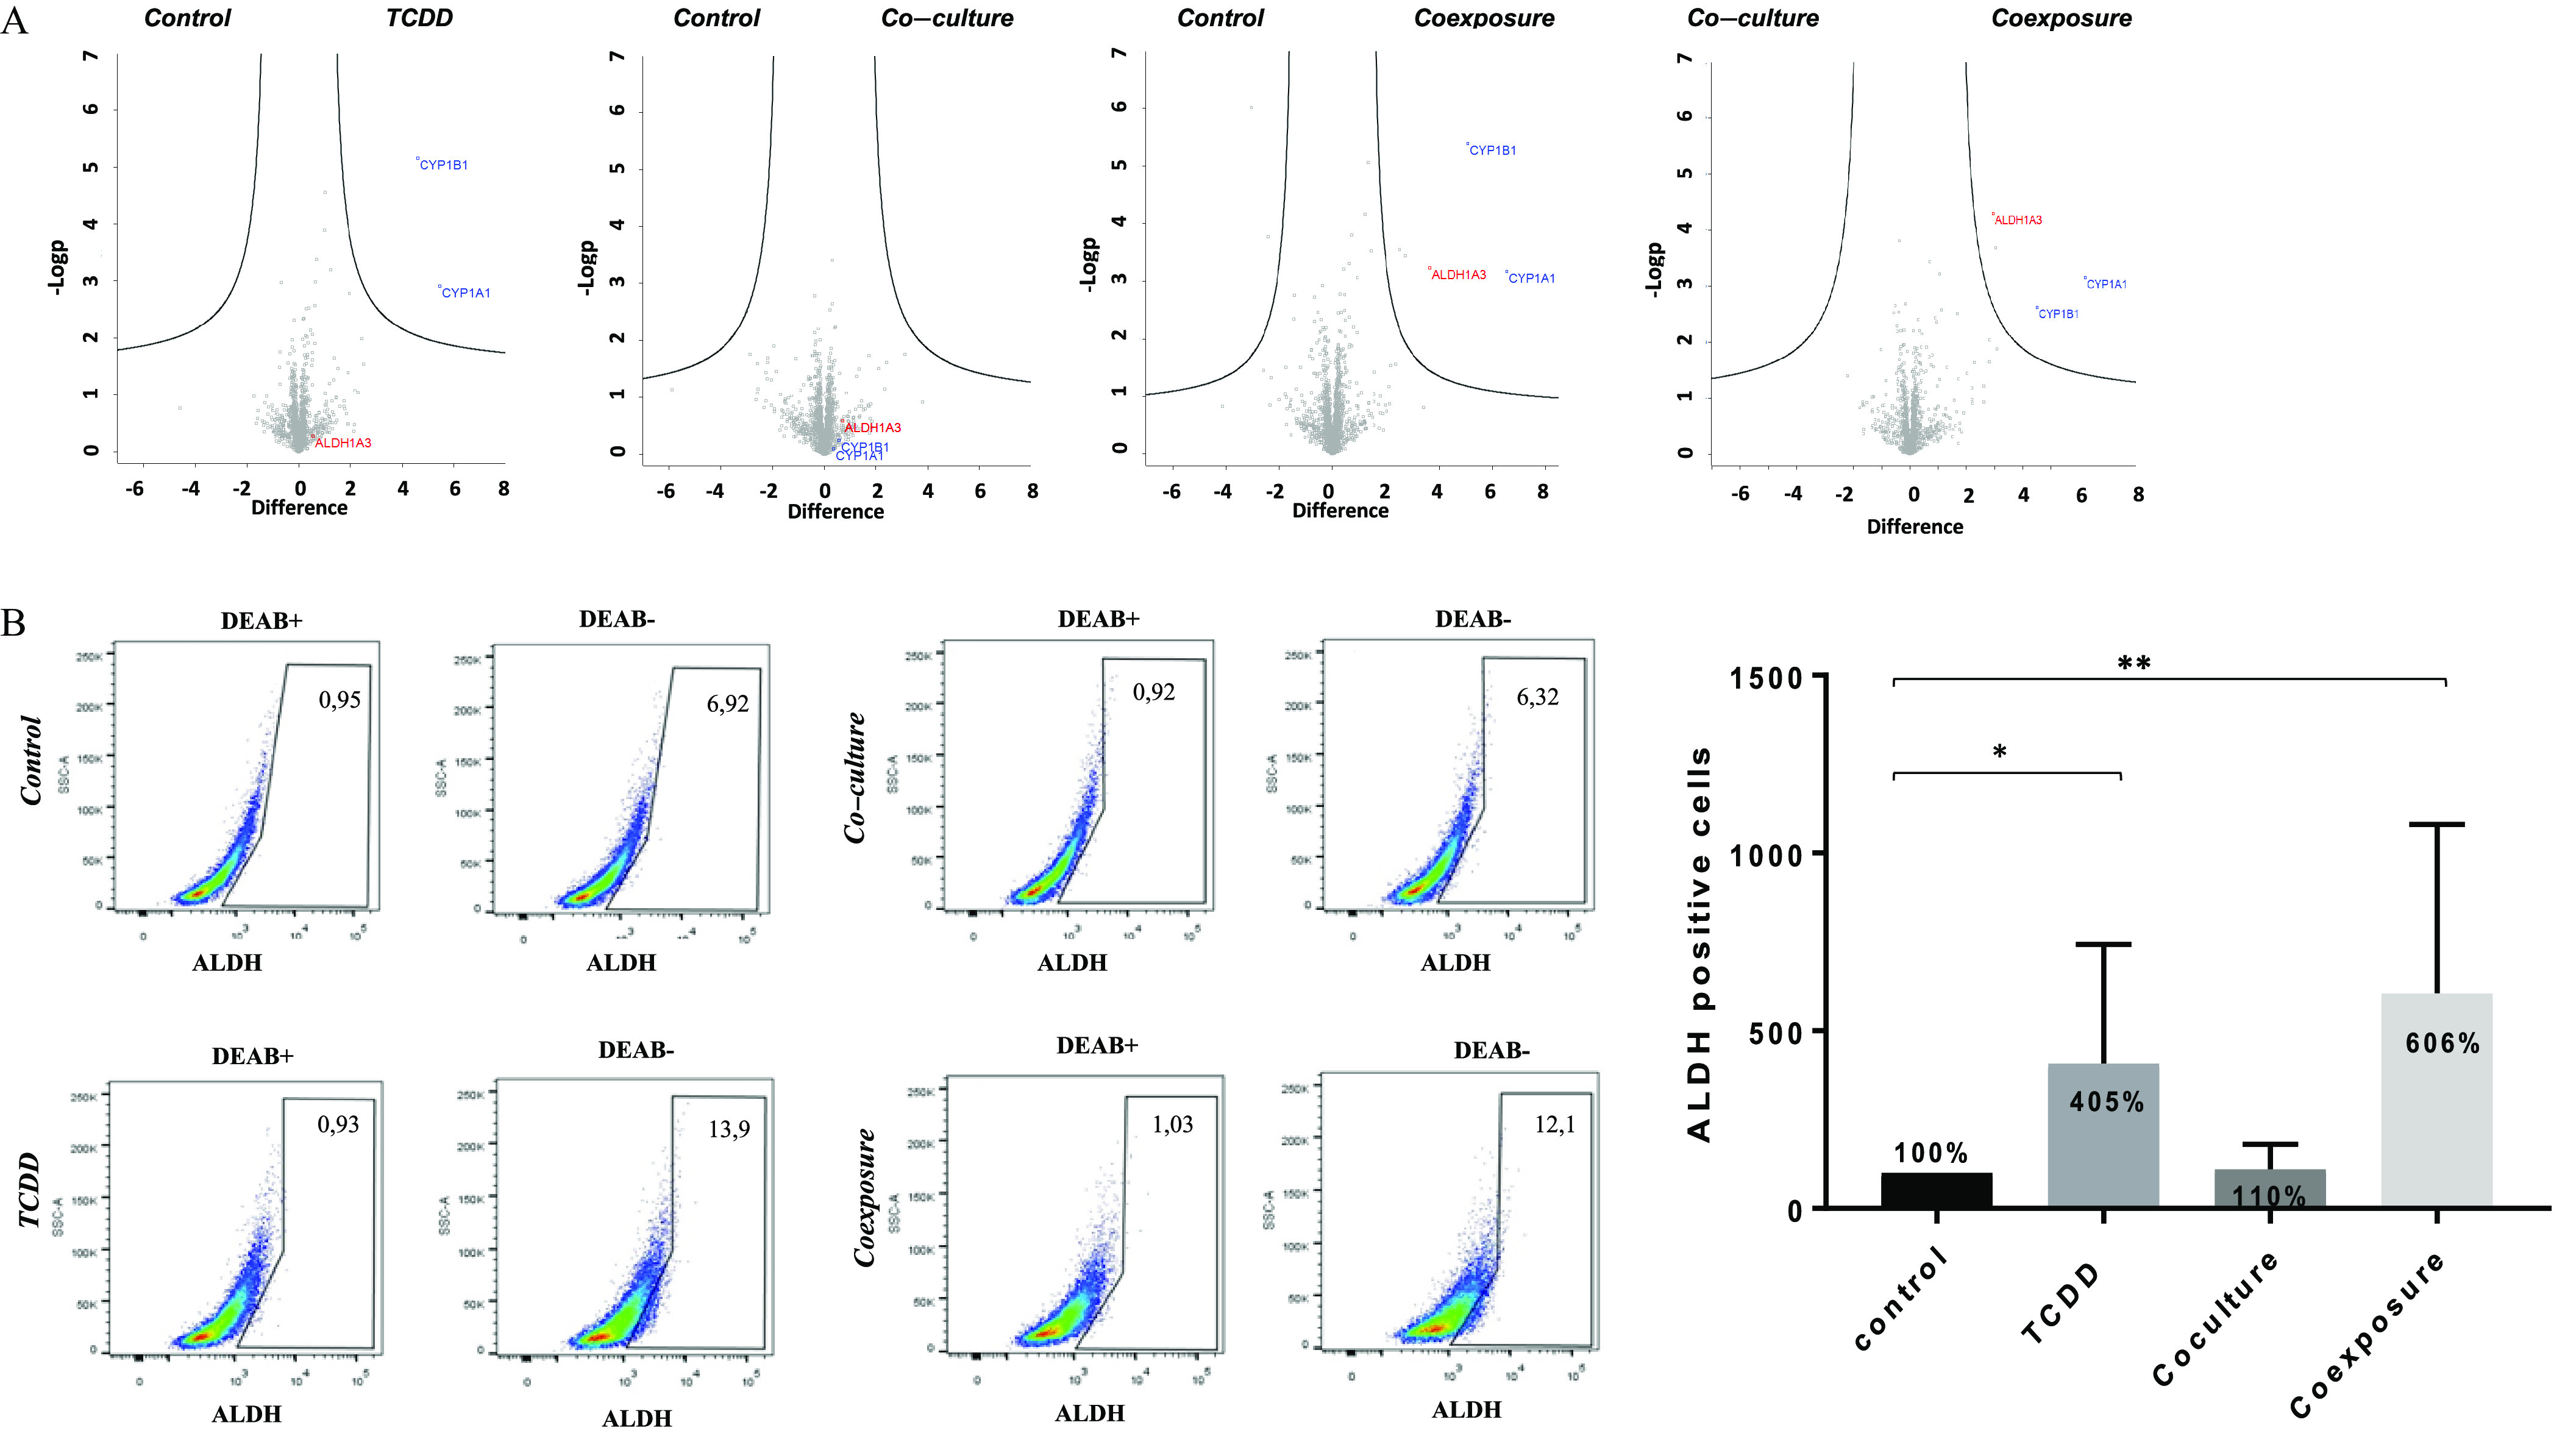
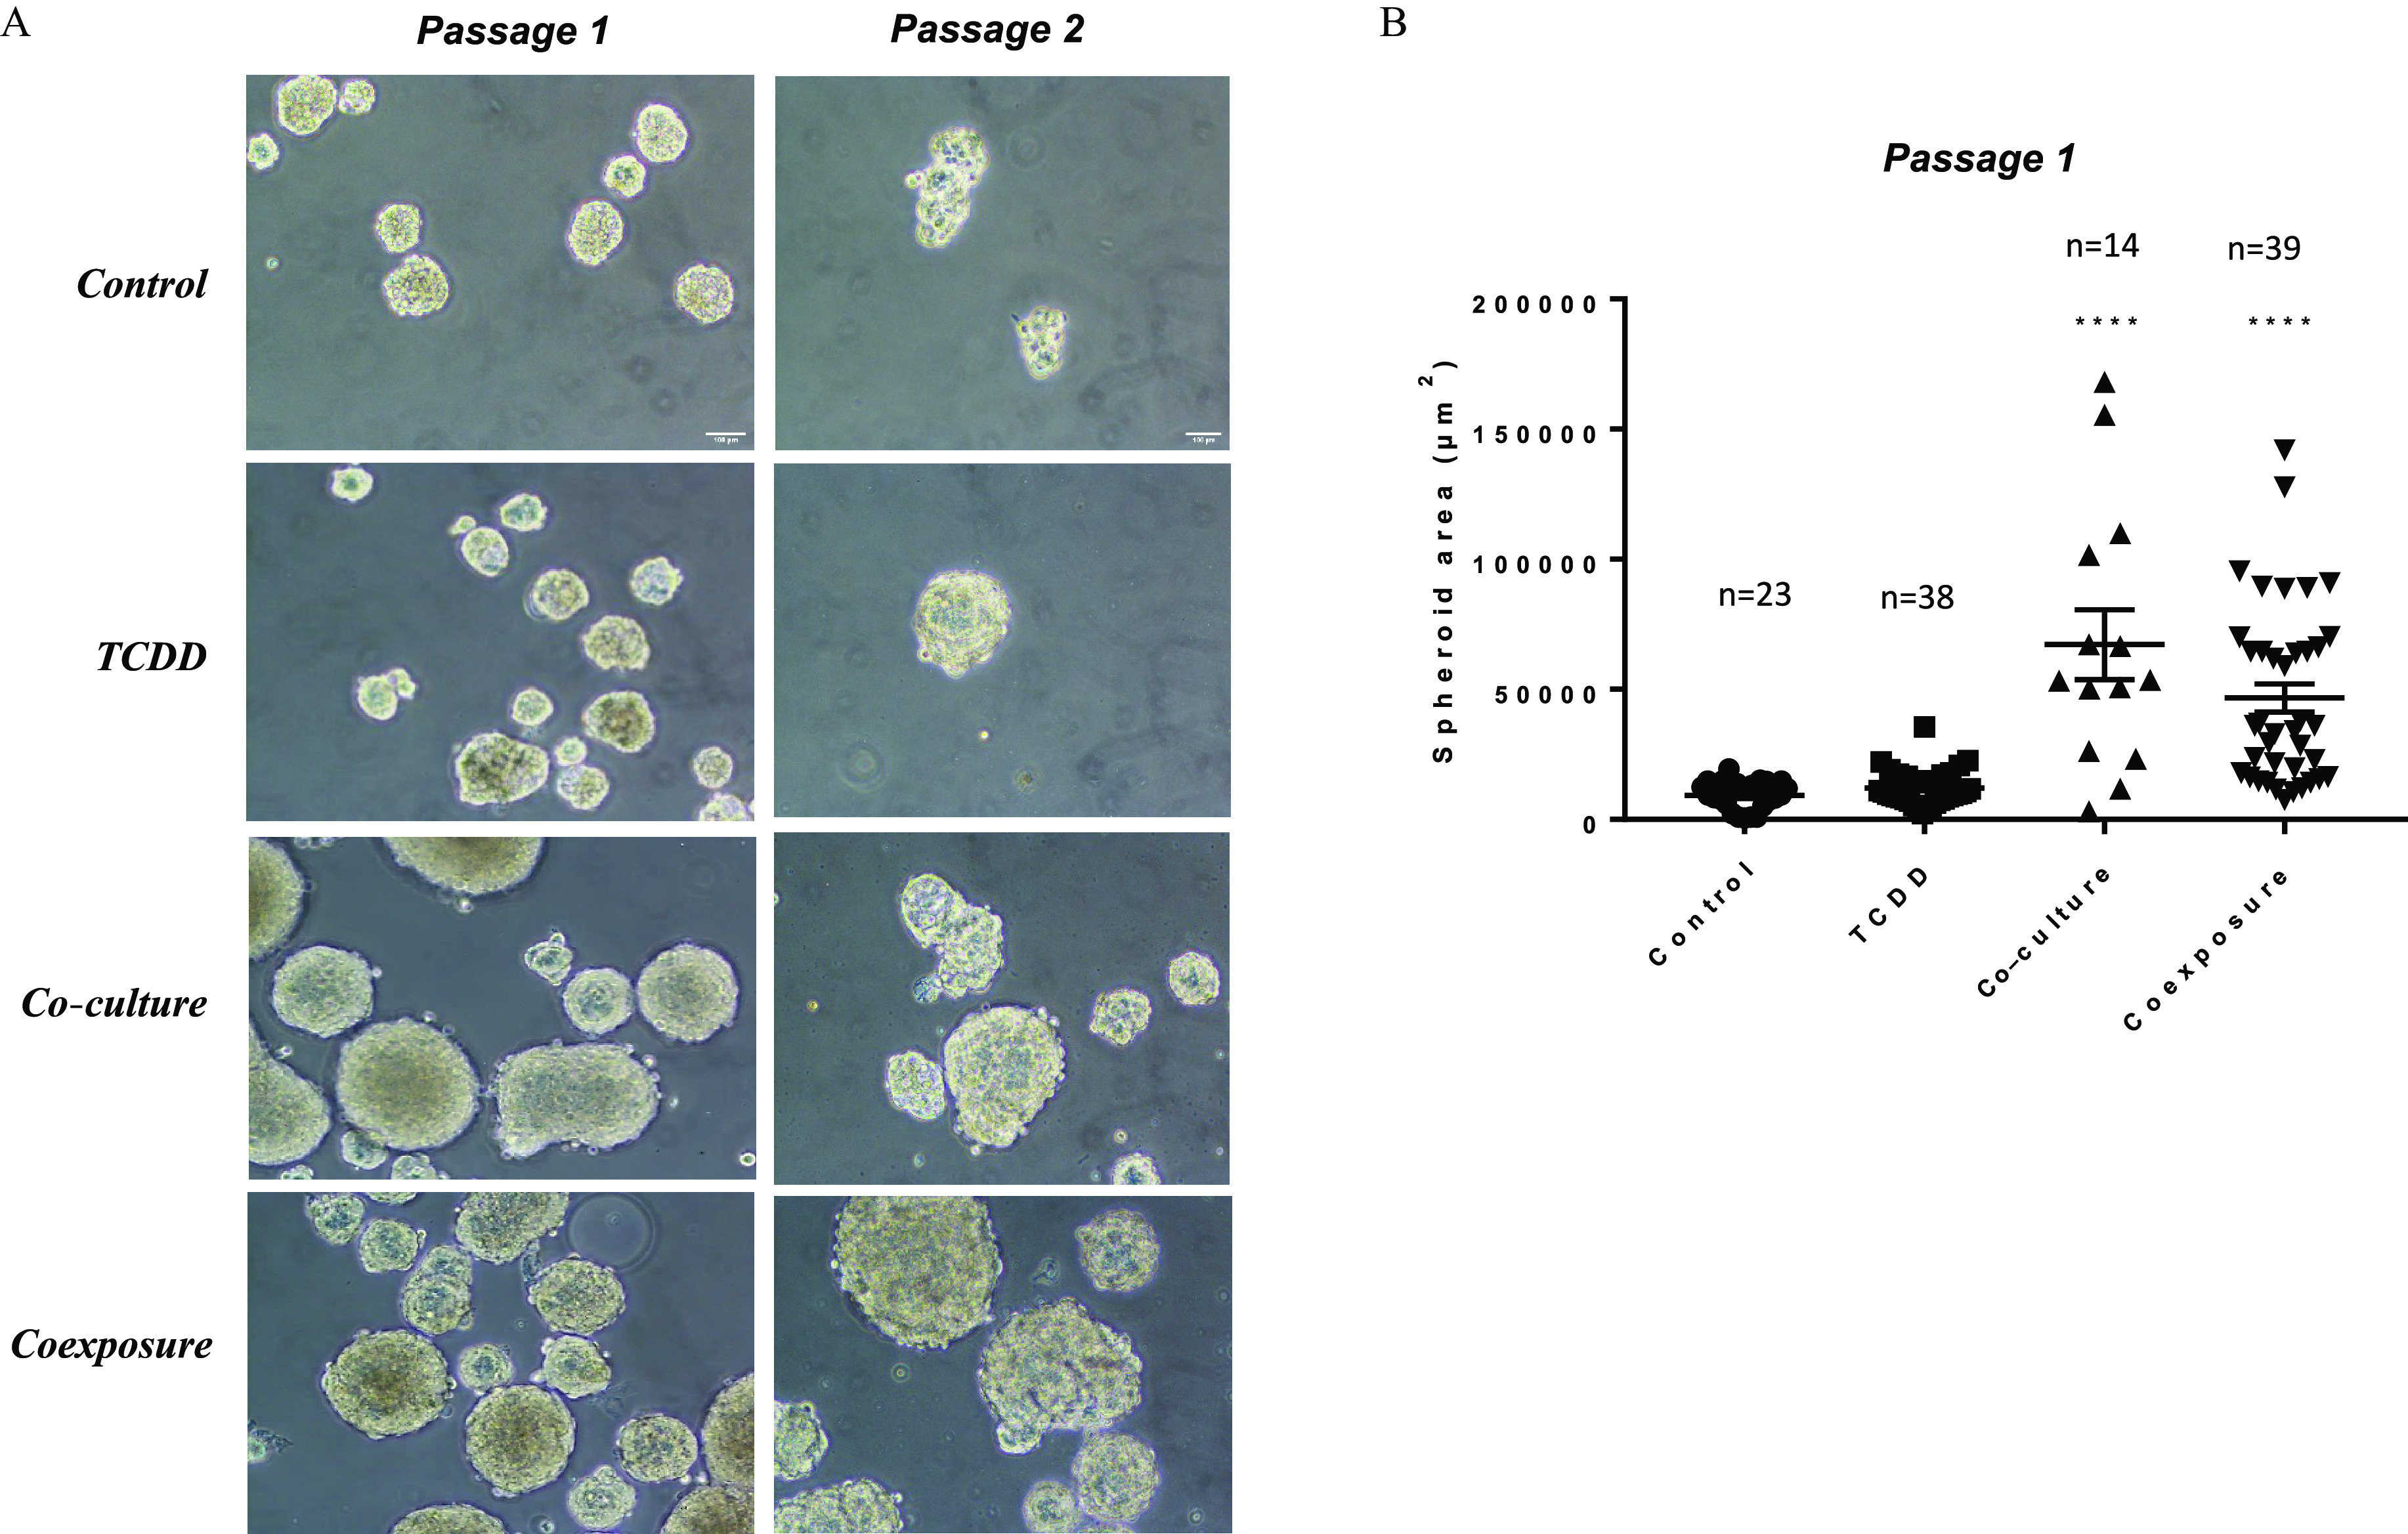
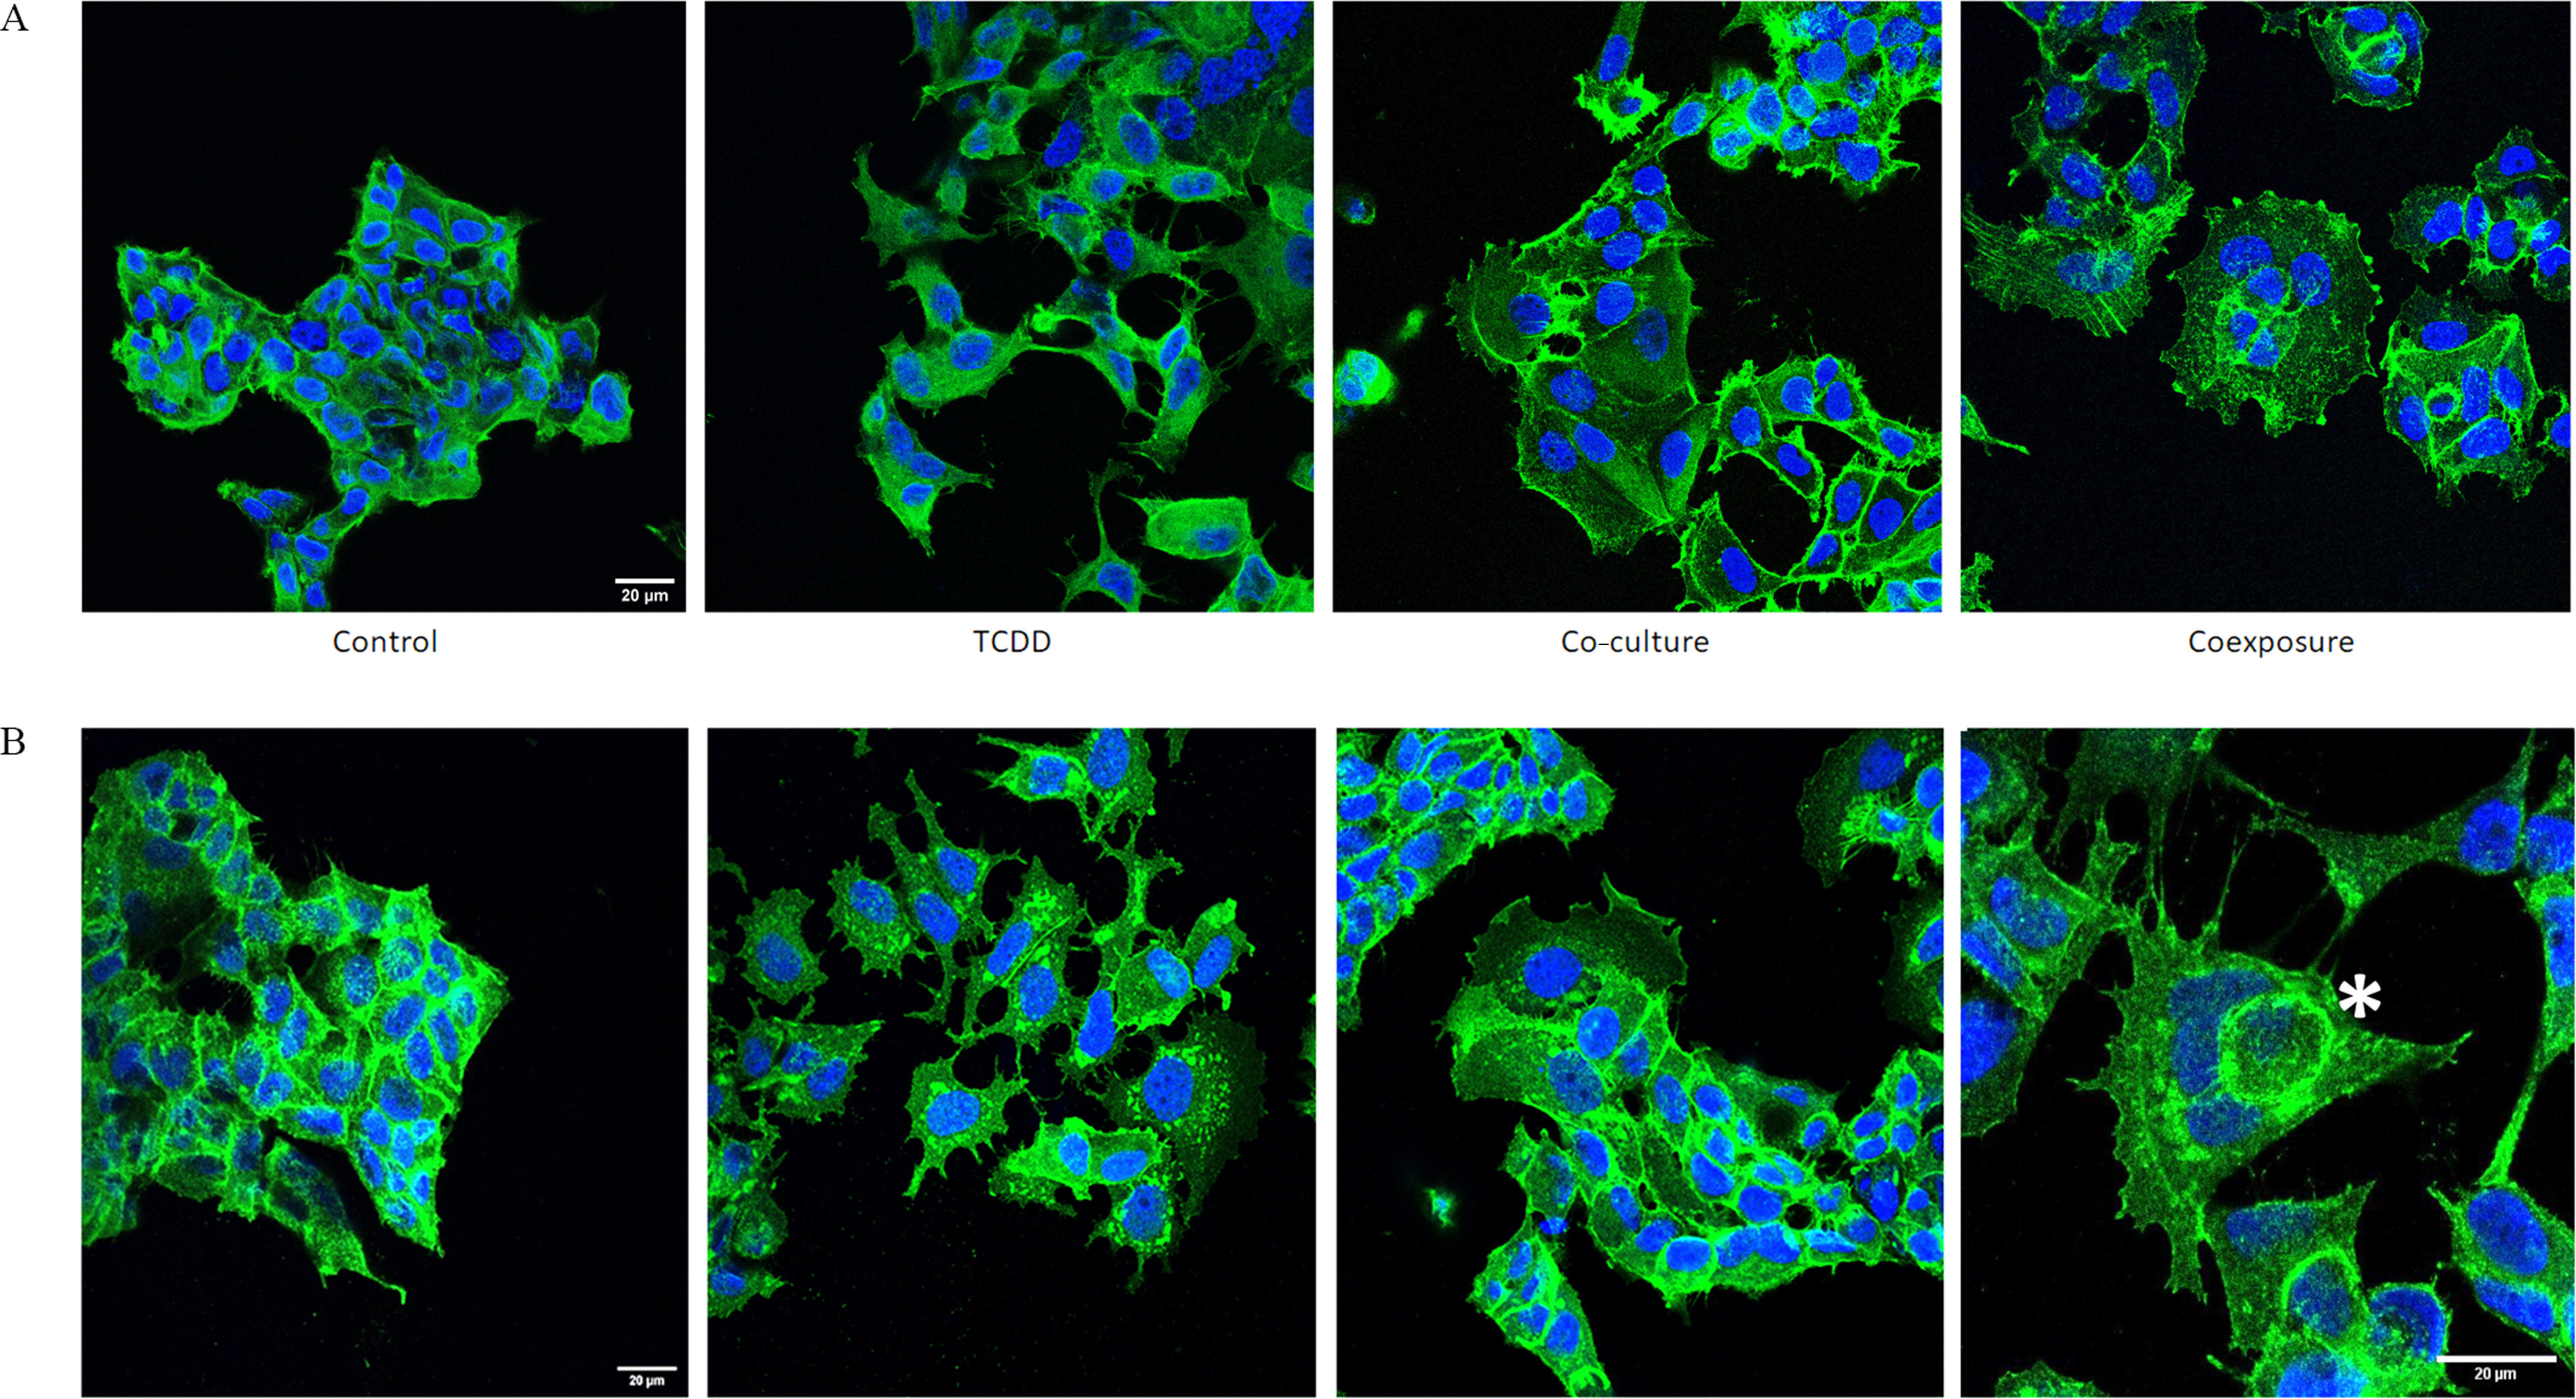
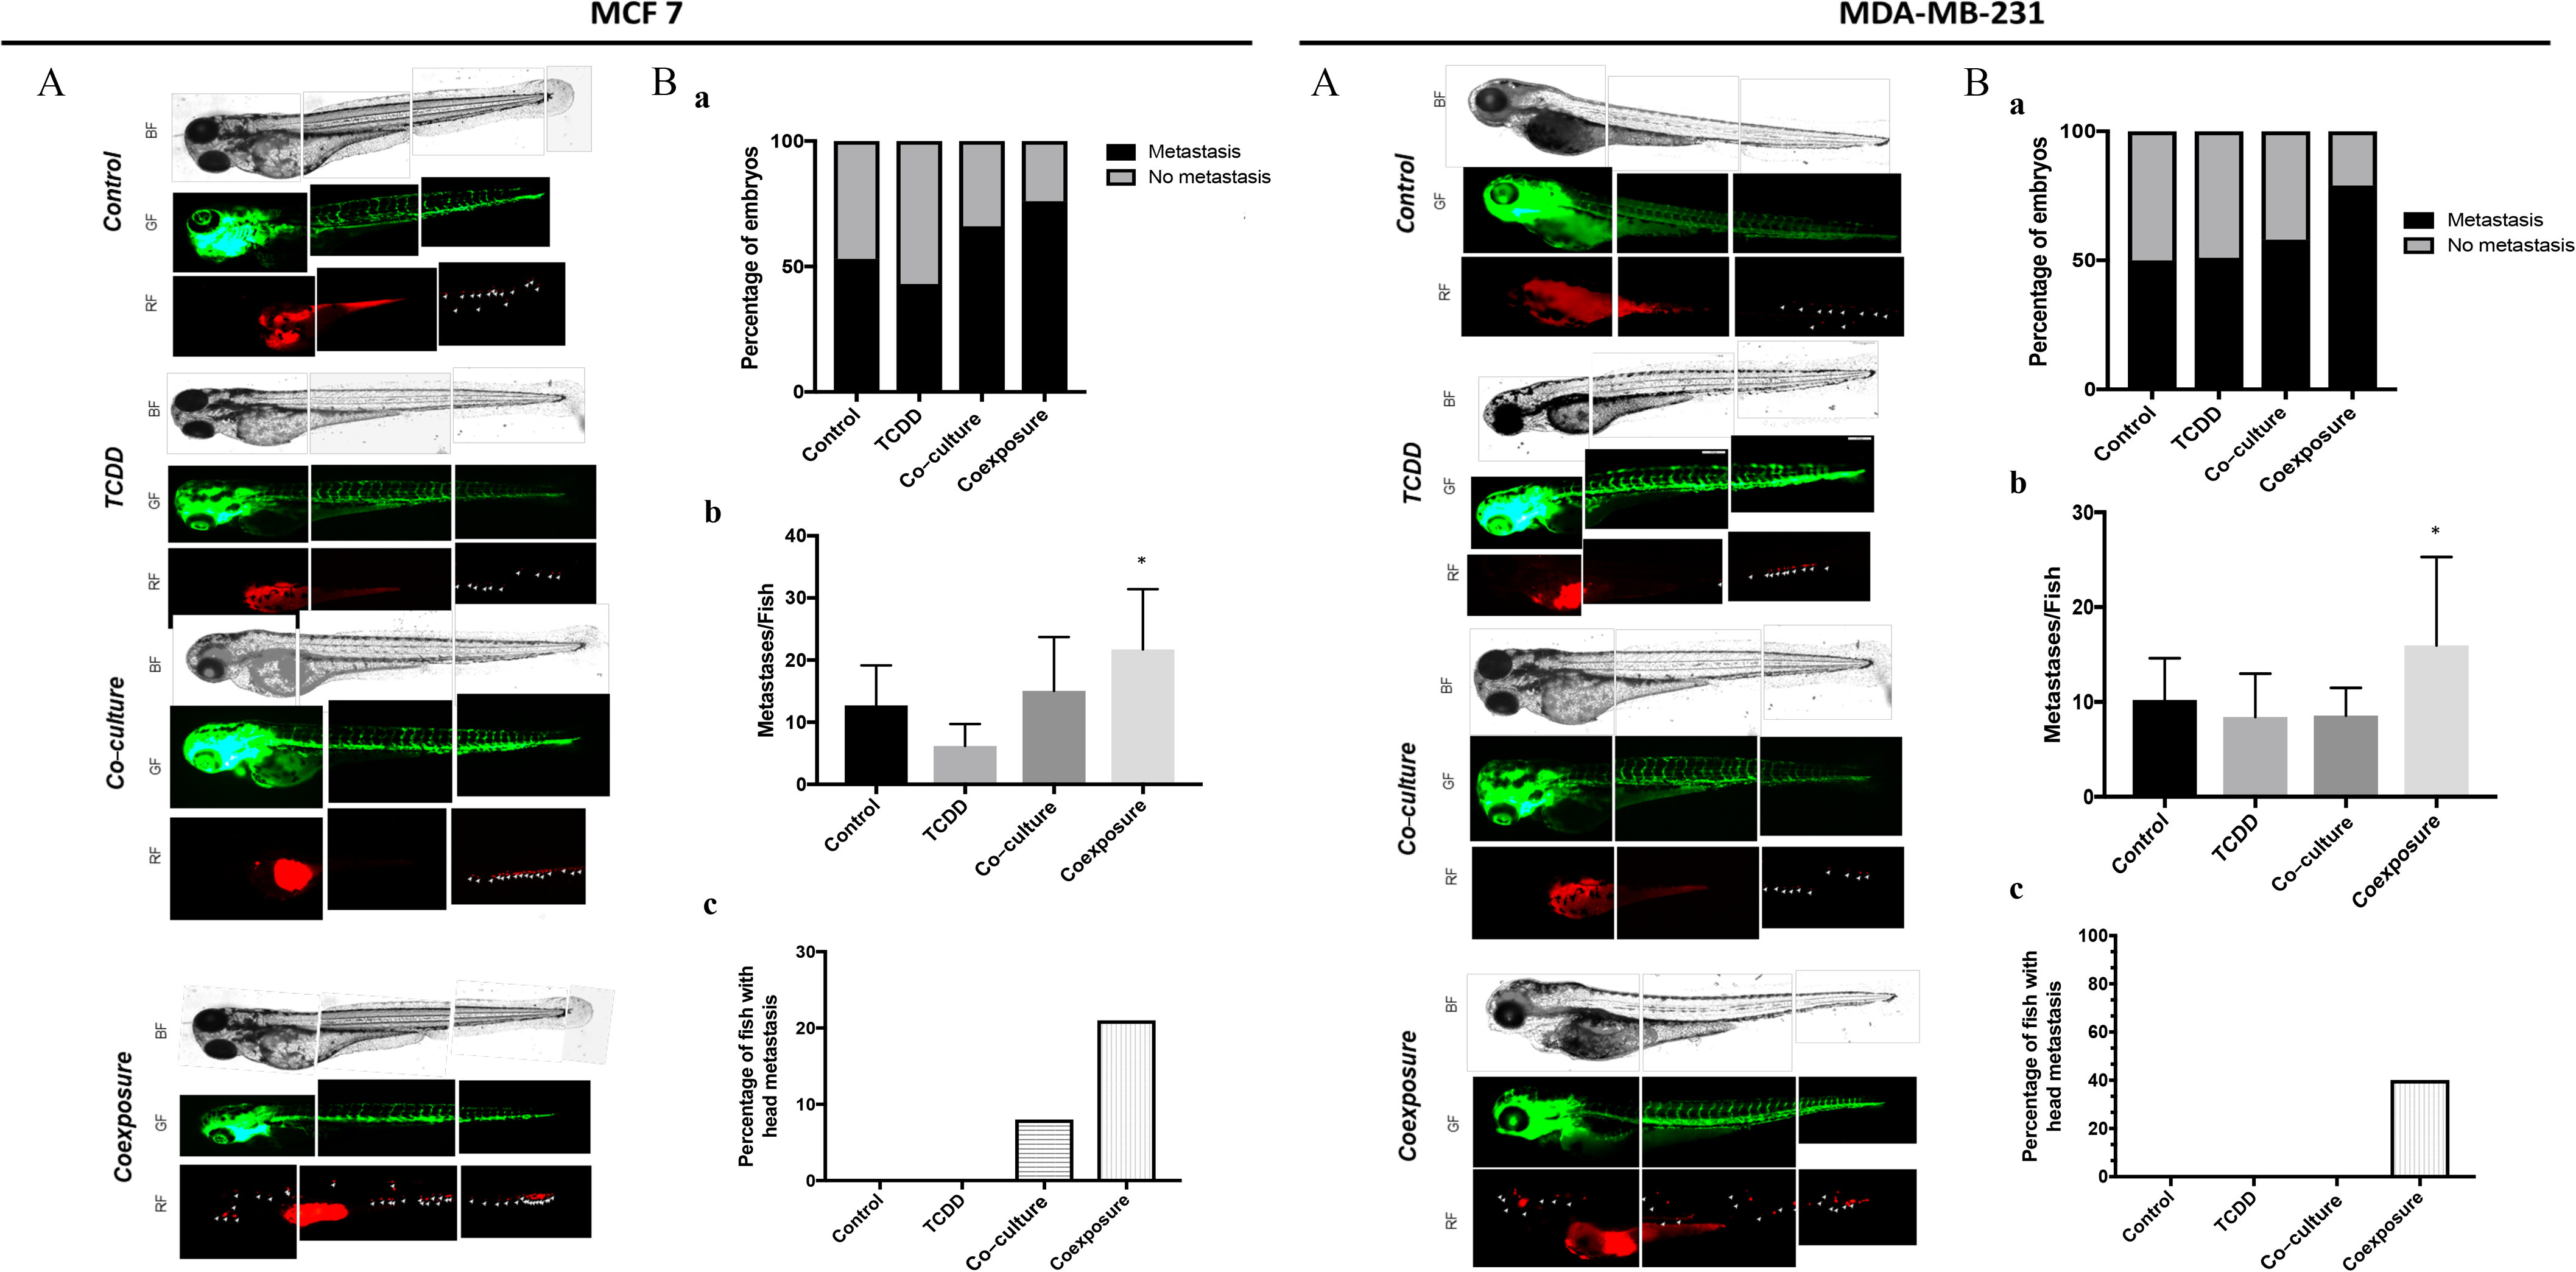
Methods: We used a co-culture model using BC MCF-7 cells or MDA-MB-231 cells together with hMADS preadipocytes to investigate the contribution of the microenvironment and 2,3,7,8-tetrachlorodibenzo-p-dioxin TCDD on BC cells. Global differences were characterized using a high-throughput proteomic assay. Subsequently we measured the BC stem cell-like activity, analyzed the cell morphology, and used a zebrafish larvae model to study the metastatic potential of the BC cells.

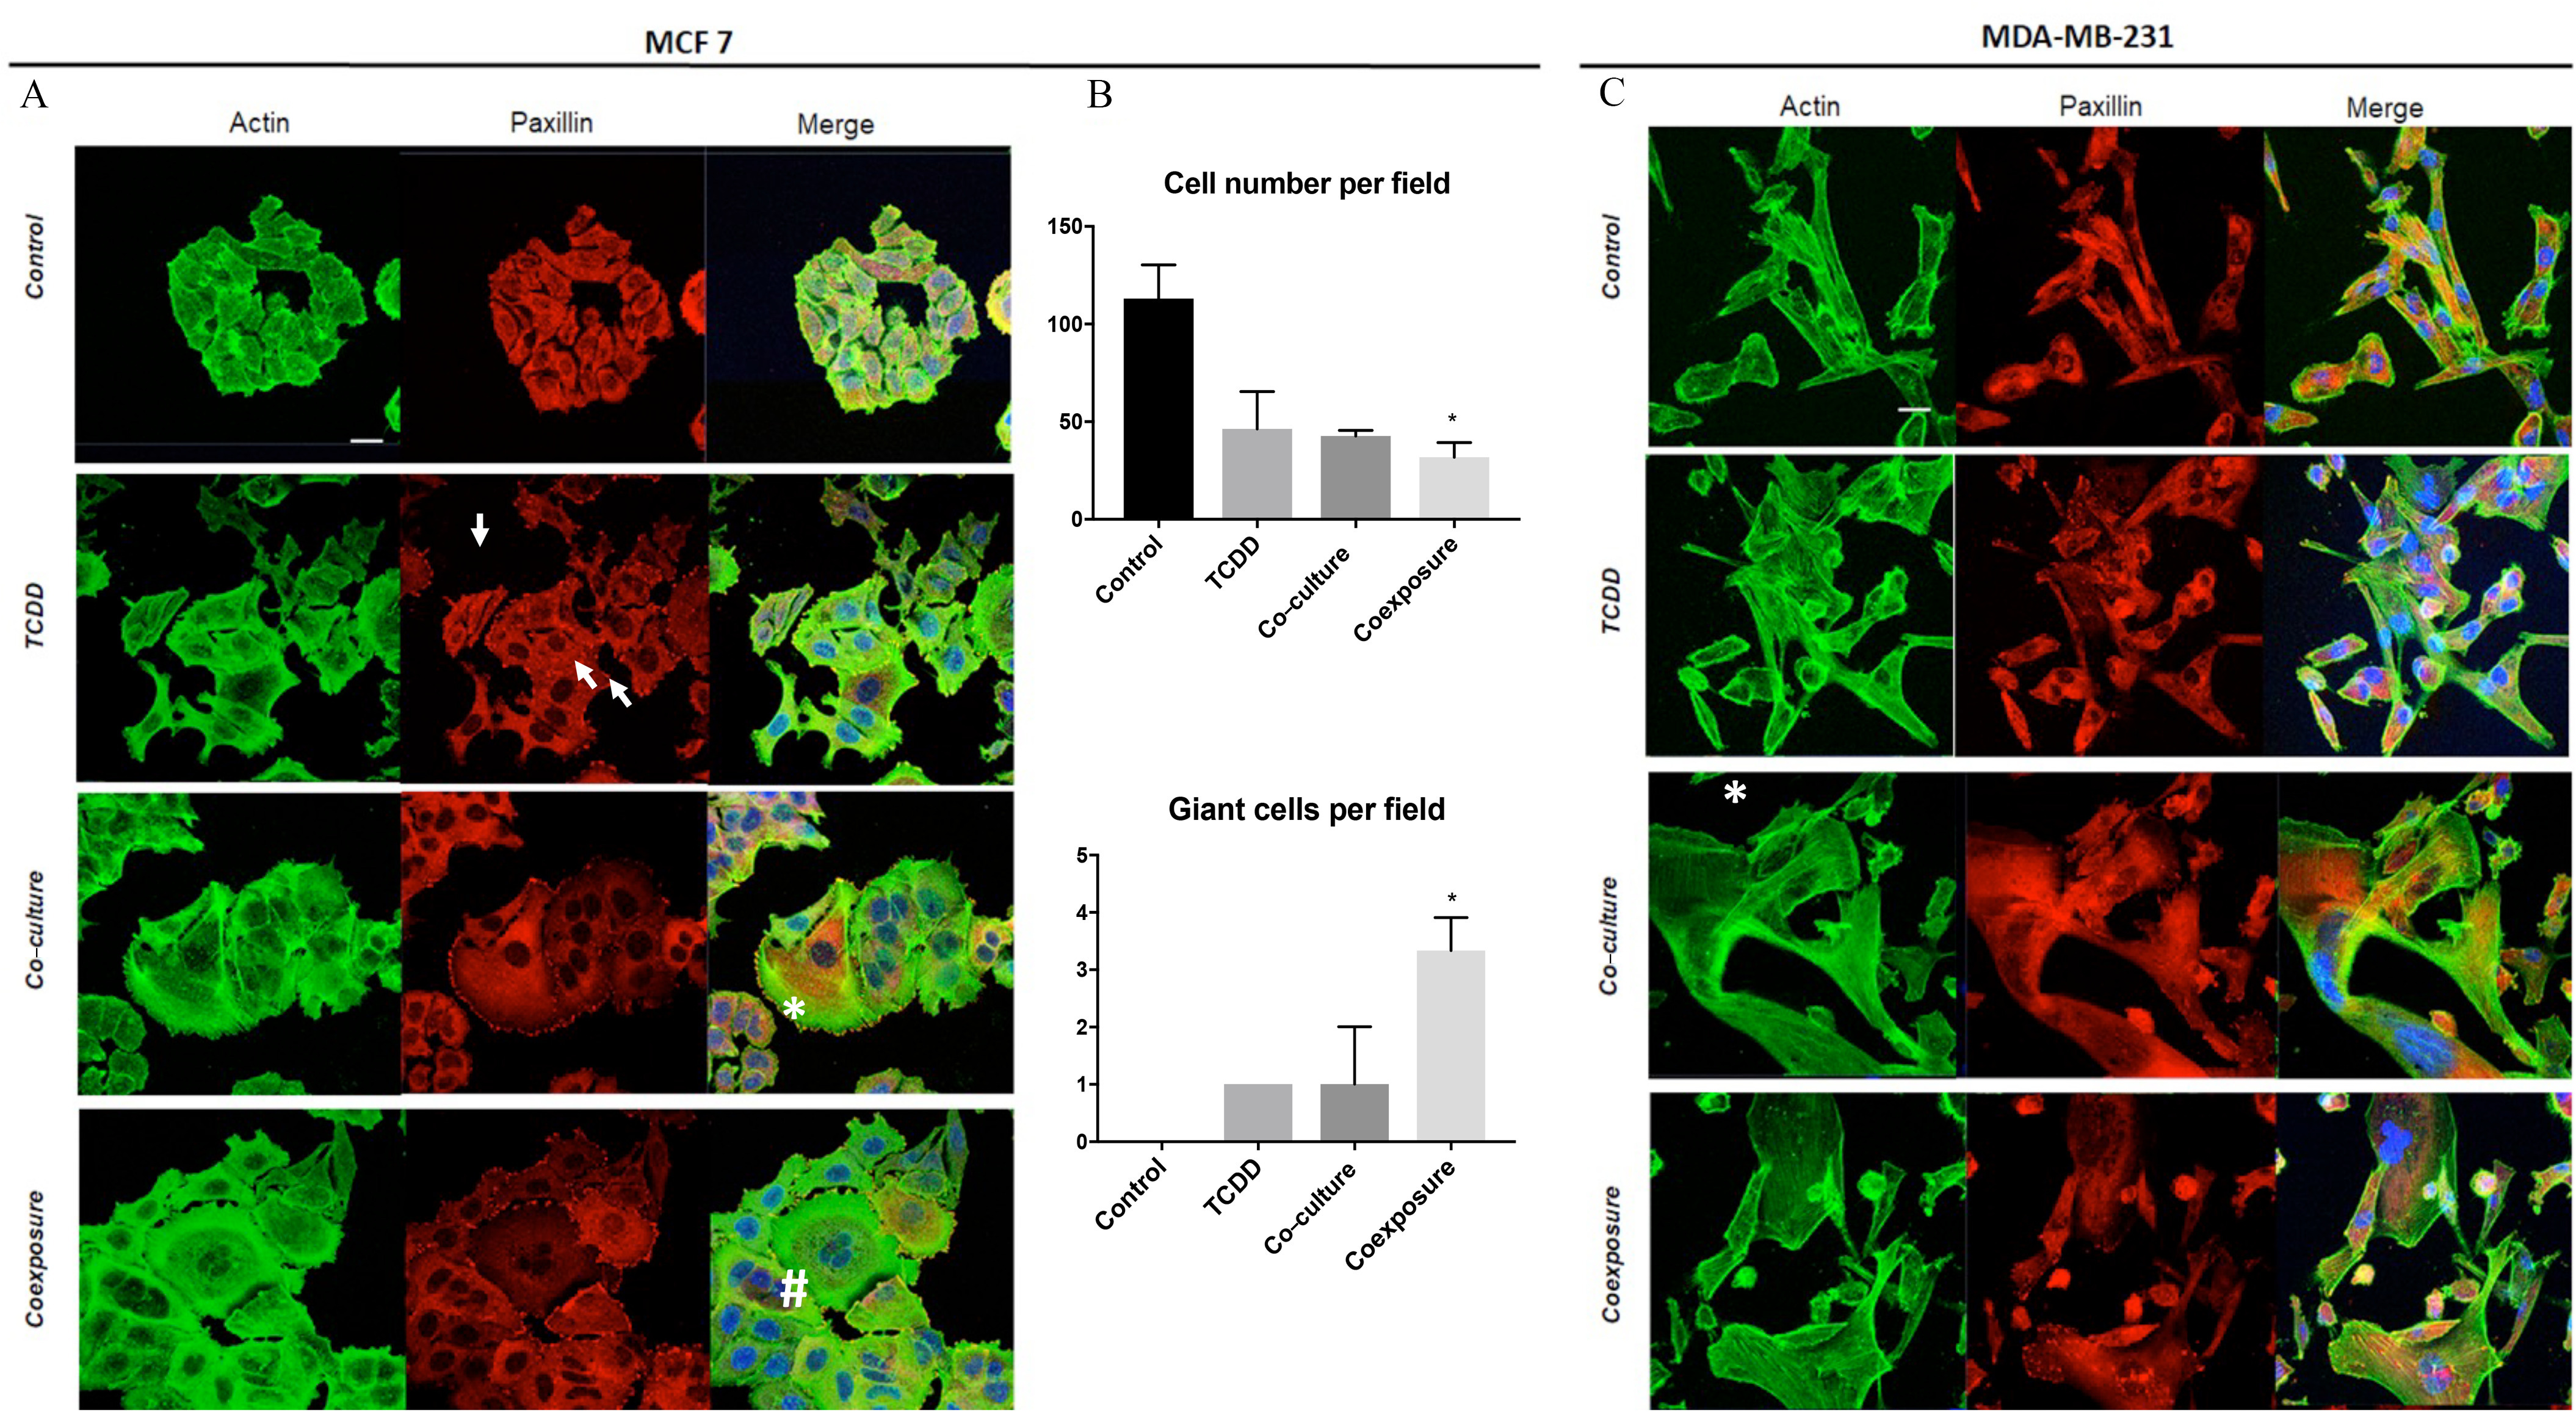
Results: We found that coexposure to TCDD and preadipocytes modified BC cell properties; moreover, it induced the expression of ALDH1A3, a cancer stem cell marker, and the appearance of giant cancer cells with cell-in-cell structures (CICs), which are associated with malignant metastatic progression, that we demonstrated in vivo.

Discussion: The results of our study using BC cell lines co-cultured with preadipocytes and a POP and an in vivo zebrafish model of metastasis suggest that the interactions between BC cells and their microenvironment could affect their invasive or metastatic potential. https://doi.org/10.1289/EHP7102.


Figures

Figure 1A is a flow chart depicting 2 D co-culture system and the protocol having three steps. Step 1: On Day 1, Michigan Cancer Foundation-7 cells or methylenedioxyamphetamine-MB231 are cultivated in 6-well plate, co-exposed or not to human multipotent adipose-derived stem cells during 24 hours. A cell-culturing diagram is displayed representing 0.4 microgram pores, human multipotent adipose-derived cells, culture medium, and Michigan Cancer Foundation-7 cells or methylenedioxyamphetamine-MB231. Step 2: On Day 2, Exposition to 2,3,7,8-Tetrachlorodibenzo- italic p-dioxin 25 nanomolar. Step 3: On Day 4, the supernatant was stored at negative 80 degrees Celsius with an icon of a test tube and Michigan Cancer Foundation-7 cells or methylenedioxyamphetamine-MB231 response analysis was conducted with an icon of cell culture. Figure 1B is a line graph plotting cell index, ranging from negative 1.0 to 10.0 in increments of 0.9 (y-axis) across time (in hours), ranging from 0.0 to 70.0 in increments of 10 (x-axis) for control, 2,3,7,8-Tetrachlorodibenzo-italic p-dioxin, Co-culture, and Coexposure. At (4.5, 25.0) 2,3,7,8-Tetrachlorodibenzo-p-dioxin treatment is marked. Figure 1C is a bar graph plotting cell index evolution (slope per slope control), ranging from 0 to 200 in increments of 50 (y-axis) across control, 2,3,7,8-Tetrachlorodibenzo-italic p-dioxin, Co-culture, and Coexposure (x-axis). The data from the graph are as follows: Control is 100 percent, 2,3,7,8-Tetrachlorodibenzo-italic p-dioxin is 113 percent, Co-culture is 45 percent, and Coexposure is 38 percent.
Figure 1.
Co-culture model and real time MCF7 cells analysis. (A) Presentation of the 2D co-culture system and the protocol. (B) xCELLigence dynamic monitoring of MCF-7 cells, A representative graph from xCELLigence system: cell index (CI) profiles are the mean±SD (duplicate) of each condition: Control (*, vehicle MCF-7 cells, alone), TCDD ($, MCF-7 cells treated with 25 nM TCDD), co-culture (, MCF-7 co-cultured with hMADS) and coexposure (&, co-culture with TCDD). (C) The evolution of the CI for each condition was determined by analyzing the slope of the line in the interval (26–48 h). Each graph represents the mean slope (in bold) compared with the control±SEM for six measurements. The numerical information mean±SEM and p-values are provided in Table S1. (Kruskal–Wallis’s H test (nonparametric comparison of k independent series) followed by a 1-factor ANOVA test (parametric comparison of k independent series), **p<0.01; *p<0.05). Note: ANOVA, analysis of variance; SEM, standard error of the mean; TCDD, 2,3,7,8-tetrachlorodibenzo-p-dioxin.
Figure 2A is a set of four volcano plots titled control and 2,3,7,8-Tetrachlorodibenzo-italic p-dioxin, control and co-culture, control coexposure, and co-culture and coexposure plotting negative log lowercase p, ranging from 0 to 7 in unit increments (y-axis) across difference, ranging from negative 6 to 8 in unit increments (x-axis) for Aldehyde dehydrogenase 1 family, member A3, Cytochrome P450 Family 1 Subfamily A Member 1, and Cytochrome P450 Family 1 Subfamily B Member 1. Figure 2B is a set of eight Flow cytometric dot plots and a bar graph. The first four Flow cytometric dot plots are titled uppercase n, n-diethylaminobenzaldehyde positive, uppercase n, n-diethylaminobenzaldehyde negative, uppercase n, n-diethylaminobenzaldehyde positive, and uppercase n, n-diethylaminobenzaldehyde negative plotting control uppercase s c-a, ranging from 0 to 250 thousand in increments of 50 thousand (y-axis) across Aldehyde dehydrogenase, ranging as 0, 10 begin superscript 3 end superscript, 10 begin superscript 4 end superscript, 10 begin superscript 4 end superscript, and 10 begin superscript 5 end superscript (x-axis). The second four Flow cytometric dot plots are titled uppercase n, n-diethylaminobenzaldehyde positive, uppercase n, n-diethylaminobenzaldehyde negative, uppercase n, n-diethylaminobenzaldehyde positive, and uppercase n, n-diethylaminobenzaldehyde negative plotting 2,3,7,8-Tetrachlorodibenzo-italic p-dioxin uppercase s c-a, ranging from 0 to 250 thousand in increments of 50 thousand (y-axis) across Aldehyde dehydrogenase, ranging as 0, 10 begin superscript 3 end superscript, 10 begin superscript 4 end superscript, 10 begin superscript 4 end superscript, and 10 begin superscript 5 end superscript (x-axis). The bar graph plots Aldehyde dehydrogenase positive cells, ranging from 0 to 1500 in increments of 500 (y-axis) across control, 2,3,7,8-Tetrachlorodibenzo-italic p-dioxin, Co-culture, and Coexposure (x-axis).
Figure 2.
Proteomics analysis and ALDH enzymatic analysis of MCF7 cells growth in co-culture with hMADS and exposed to 25 nM TCDD for 48 h. (A) High-throughput proteomic analysis of MCF7 cells [Control (vehicle MCF-7 cells, alone), TCDD (MCF-7 cells treated with 25 nM TCDD), co-culture (MCF-7 co-cultured with hMADS), and coexposure (co-culture with TCDD)]. The plots show the mean of biological quadruplicates and technical triplicates for each sample. CYP1A1, CYP1B1, and ALDH1A3 were induced when they appeared in the upper right part of the representation. (B) ALDH (aldehyde dehydrogenase) enzymatic activity was detected in MCF7 cells using the ALDEFLUOR assay (FACS analysis). DEAB was used to inhibit the reaction of ALDH with the ALDEFLUOR reagent, providing a negative control. Percentage of ALDH positive cell was set according to the gate of DEAB control cells. Graph represents means of the percentage of ALDH positive cells (in bold) compared with the control±SEM of six measurements. The numerical information mean±SEM and p-values are provided in Table S2. (Kruskal–Wallis’s H test (nonparametric comparison of k independent series) followed by a 1-factor ANOVA test (parametric comparison of k independent series, **p<0.01; *p<0.05). Note: ANOVA, analysis of variance; SEM, standard error of the mean; TCDD, 2,3,7,8-tetrachlorodibenzo-p-dioxin.
Figure 3A is a sphere formation depicting two consecutive generations by displaying two columns, namely, Passage 1 and Passage 2 and four rows, namely, control, 2,3,7,8-Tetrachlorodibenzo-italic p-dioxin, Co-culture, and Coexposure. Figure 3B is an aligned dot plot titled Passage 1 plotting Spheroid area (micrometer squared), ranging from 0 200000 in increments of 50000 (y-axis) across control, 2,3,7,8-Tetrachlorodibenzo-p-dioxin, Co-culture, and Coexposure (x-axis) for lowercase n equals 23, 38, 14, and 39.
Figure 3.
Sphere formation assay. (A) Representative images of sphere formation taken on day 7 on two consecutive generations. Only breast stem/progenitor cells can self-renew and grow into a spheroid structure. Control (vehicle MCF-7 cells, alone), TCDD (MCF-7 cells treated with 25nM TCDD), co-culture (MCF-7 co-cultured with hMADS) and coexposure (co-culture with TCDD). Scale bar 10μm. (B) Spheroid area (in μm2) in passage 1 using media from the various conditions. Graph represents means±SEM of n (see figure) measurements. The numerical information mean±SEM and p-values are provided in Table S3. Untreated MCF-7 cells alone represent the control condition (Kruskal–Wallis’s H test (nonparametric comparison of k independent series) followed by a 1-factor ANOVA test (parametric comparison of k independent series, ****p<0.0001). Note: ANOVA, analysis of variance; SEM, standard error of the mean; TCDD, 2,3,7,8-tetrachlorodibenzo-p-dioxin.
Figures 4A and 4C are staining of Michigan Cancer Foundation-7 cells and methylenedioxyamphetamine-M B-231 cells following exposure to 2,3,7,8-Tetrachlorodibenzo-italic p-dioxin, co-culture or coexposure with scale bar of 20 micrometers displaying three columns, namely, Actin, Paxillin, and Merge and four rows, namely, control, 2,3,7,8-Tetrachlorodibenzo-italic p-dioxin, Co-culture, and Coexposure. Figure 4B is a set of two bar graphs titled Cell number per field and Giant cells per field plotting Quantitation, ranging from 0 to 150 in increments of 50 and 0 to 5 in unit increments (y-axis) across control, 2,3,7,8-Tetrachlorodibenzo-italic p-dioxin, Co-culture, and Coexposure (x-axis), respectively.
Figure 4.
Morphological differences of MCF7 cells and MDA-MB-231 cells following exposure to TCDD, co-culture, or coexposure. Cells were grown with hMADS and/or treated with 25 nM TCDD [Control (vehicle MCF-7 cells, alone), TCDD (MCF-7 cells treated with 25nM TCDD), co-culture (MCF-7 co-cultured with hMADS), and coexposure (co-culture with TCDD)]. After 48 h treatment, cells were fixed and stained for paxillin, actin, and nucleus (blue). (A) Staining of MCF7 cells. Scale bar 20μm. (B) Quantitation of MCF7 cell number and giant cells (very large cells with multiple nuclei) per field (n=3) field per conditions. Graph represents means±SEM of three experiments. The numerical information mean±SEM and p-values are provided in Table S4. Kruskal–Wallis’s H test (nonparametric comparison of k independent series) followed by a 1-factor ANOVA test (parametric comparison of k independent series, *p<0.05). (C) Staining of MDA-MB-231. Scale bar 20μm. Symbols were used to point out the focal adhesions (arrow), lamellipods (*) and giant cells (#). Note: ANOVA, analysis of variance; SEM, standard error of the mean; TCDD, 2,3,7,8-tetrachlorodibenzo-p-dioxin.
Figure 5 is a staining of A-actin, B-beta-catenin protein localization and nucleus of Michigan Cancer Foundation-7 cells and methylenedioxyamphetamine-M B-231 cells, with a scale bar of 20 micrometers displaying four columns, namely, control, 2,3,7,8-Tetrachlorodibenzo-italic p-dioxin, Co-culture, and Coexposure and two rows, namely A and B.
Figure 5.
Protein (A-actin, B-beta-catenin) localization & nucleus staining in MCF7 cells and MDA-MB-231 cells. MCF7 cells were grown with hMADS and/or treated with 25 nM TCDD for 48h [Control (vehicle MCF-7 cells, alone), TCDD (MCF-7 cells treated with 25nM TCDD), co-culture (MCF-7 co-cultured with hMADS), and coexposure (co-culture with TCDD)]. (A) MCF7 cells were stained for actin (green) and nucleus (blue). Scale bar 20μm. (B) MCF7 cells were stained for beta-catenin (green) and nucleus (blue). One representative cell with cell-in-cell structures was marked with an asterisk (*). Scale bar 20μm. Note: TCDD, 2,3,7,8-tetrachlorodibenzo-p-dioxin.
Figure 6A is a measurement of metastatic spread of Michigan Cancer Foundation-7 cells and methylenedioxyamphetamine-M B-231 in zebrafish larvae in vivo models depicting Human red fluorescent protein in Michigan Cancer Foundation-7 cells and methylenedioxyamphetamine-M B-231 cells for Control, 2,3,7,8-Tetrachlorodibenzo-p-dioxin, co-culture, and co-exposure (co-culture with 2,3,7,8-Tetrachlorodibenzo-italic p-dioxin). Figure 6B in Michigan Cancer Foundation-7 and methylenedioxyamphetamine-M B-231 is a set of one stacked bar graph (a) and two bar graphs (b and c). Figure 6B (a) is a stacked bar graph plotting Percentage of embryos, ranging from 0 to 100 in increments of 50 (y-axis) across control, 2,3,7,8-Tetrachlorodibenzo-p-dioxin, Co-culture, and Co-exposure (x-axis) for metastasis and no metastasis, respectively. Figure 6B (b and c) are bar graphs plotting Metastases or Fish, ranging from 0 to 40 in increments of 10 and 0 to 30 in increments of 10; Percentage of fish with head metastasis, ranging from 0 to 30 in increments of 10 and 0 to 100 in increments of 20 (y-axis) across control, 2,3,7,8-Tetrachlorodibenzo-italic p-dioxin, Co-culture, and Co-exposure (x-axis), respectively.
Figure 6.
Measurement of metastatic spread of MCF7 and MDA-MB231 cells in zebrafish larvae in vivo models Human RFP-MCF7 (left) or RFP-MDA-MB-231 (right) cells cultured with conditioned media from different conditions, were injected into the perivitelline space of 2-day-old zebrafish larvae [Control (vehicle MCF-7 cells, alone), TCDD (MCF-7 cells treated with 25 nM TCDD), co-culture (MCF-7 co-cultured with hMADS), and coexposure (co-culture with TCDD)]. Fish were imaged 24 h later at 8.5× magnification by fluorescence microscopy. (A) Representative images from 21–46 fish/group. (B) Quantitation of (a) the number of fish with one or more metastases and (b) the average number of metastases/fish+SE. Graph represents means±SEM of three measurements. The numerical information mean±SEM and p-values are provided in Table S8. (Kruskal–Wallis’s H test (nonparametric comparison of k independent series) followed by a 1-factor ANOVA test (parametric comparison of k independent series, * p<0.05). (C) The percentage of fish with metastasis in the head region. Each experiment was repeated in triplicate (MCF-7) or quadruplicate (MDA-MB-231) with 7–12 fish per condition in each experiment. Note: ANOVA, analysis of variance; SEM, standard error of the mean; TCDD, 2,3,7,8-tetrachlorodibenzo-p-dioxin.

References

    1. Abbott BD, Perdew GH, Birnbaum LS. 1994. Ah receptor in embryonic mouse palate and effects of TCDD on receptor expression. Toxicol Appl Pharmacol 126(1):16–25, PMID: 8184424, 10.1006/taap.1994.1085. - DOI - PubMed
    1. Abdalla F, Jamela B, Rabia M, Hussein H, Abdelbaset B, Yrjö C. 2009. Correlation of nuclear morphometry of breast cancer in histological sections with clinicopathological features and prognosis. Anticancer Res 29(5):1771–1776. PMID: 19443402. - PubMed
    1. Allen M, Jones JL. 2011. Jekyll and Hyde: the role of the microenvironment on the progression of cancer. J Pathol 223(2):162–176, PMID: 21125673, 10.1002/path.2803. - DOI - PubMed
    1. Barouki R, Aggerbeck M, Aggerbeck L, Coumoul X. 2012. The aryl hydrocarbon receptor system. Drug Metabol Drug Interact 27(1):3–8, PMID: 22718620, 10.1515/dmdi-2011-0035. - DOI - PubMed
    1. Biswas G, Srinivasan S, Anandatheerthavarada HK, Avadhani NG. 2008. Dioxin-mediated tumor progression through activation of mitochondria-to-nucleus stress signaling. Proc Natl Acad Sci U S A 105(1):186–191, PMID: 18172213, 10.1073/pnas.0706183104. - DOI - PMC - PubMed

Publication types

LinkOut - more resources