. 2021 Mar 8:10:e51675.
doi: 10.7554/eLife.51675.

Relationship between simultaneously recorded spiking activity and fluorescence signal in GCaMP6 transgenic mice

Affiliations

Relationship between simultaneously recorded spiking activity and fluorescence signal in GCaMP6 transgenic mice

Lawrence Huang et al. Elife. .

Abstract

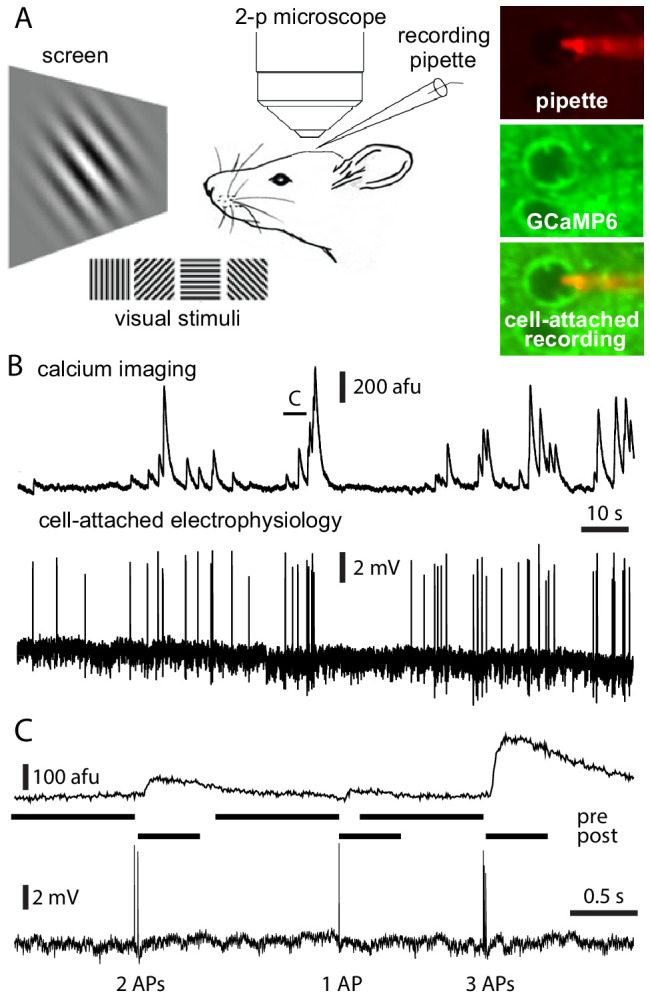
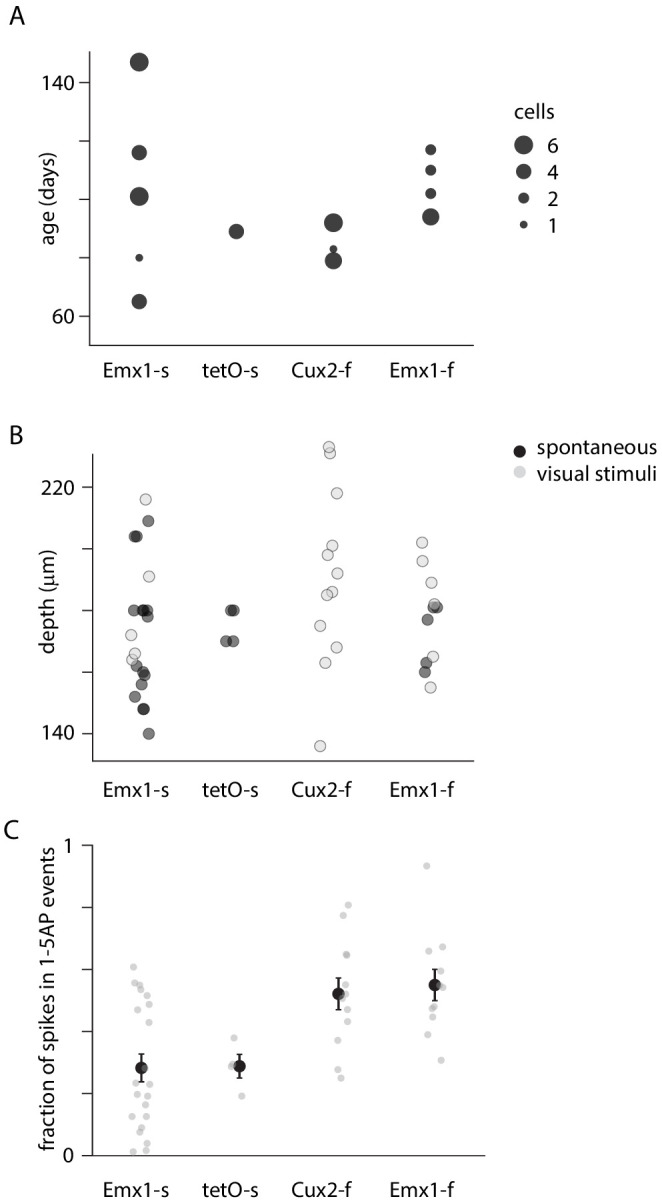
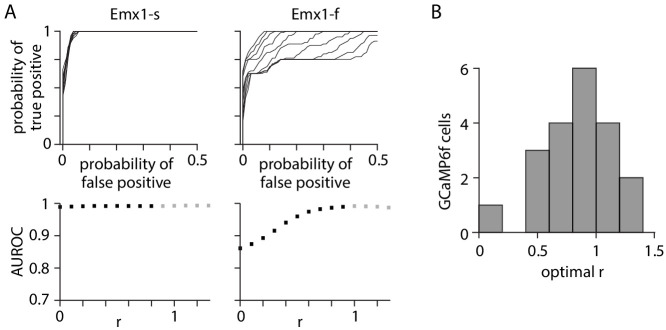
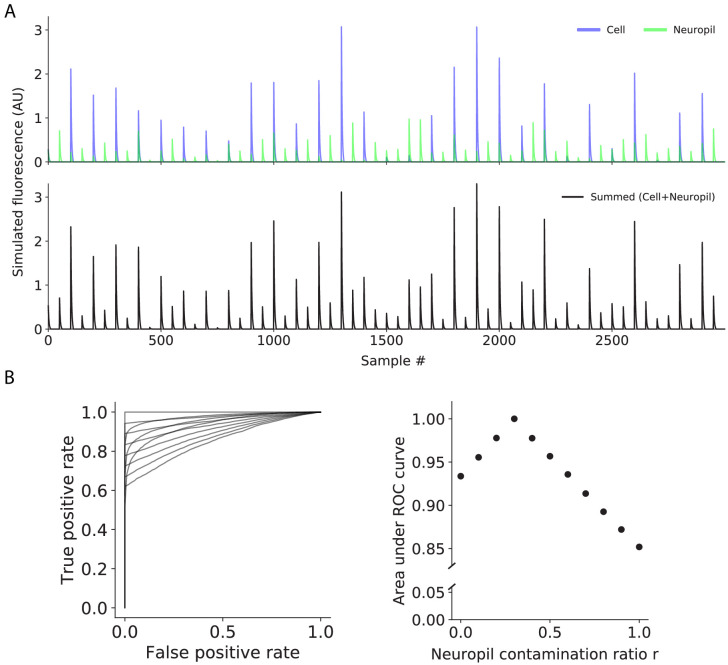
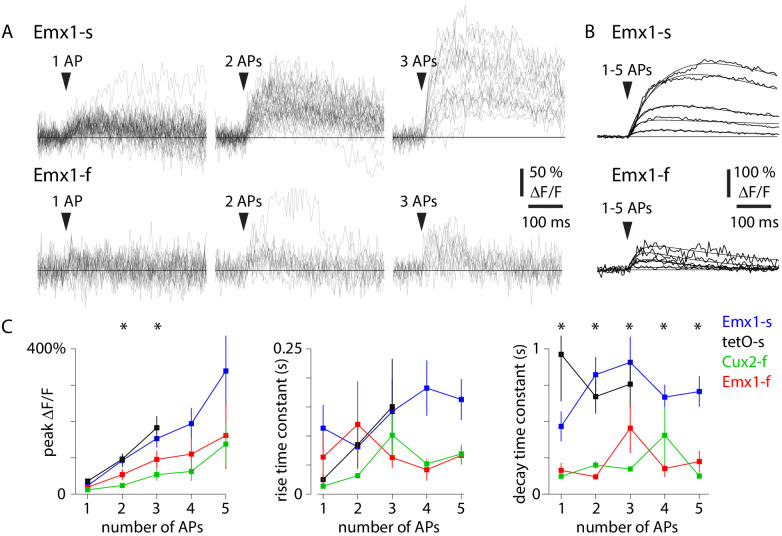
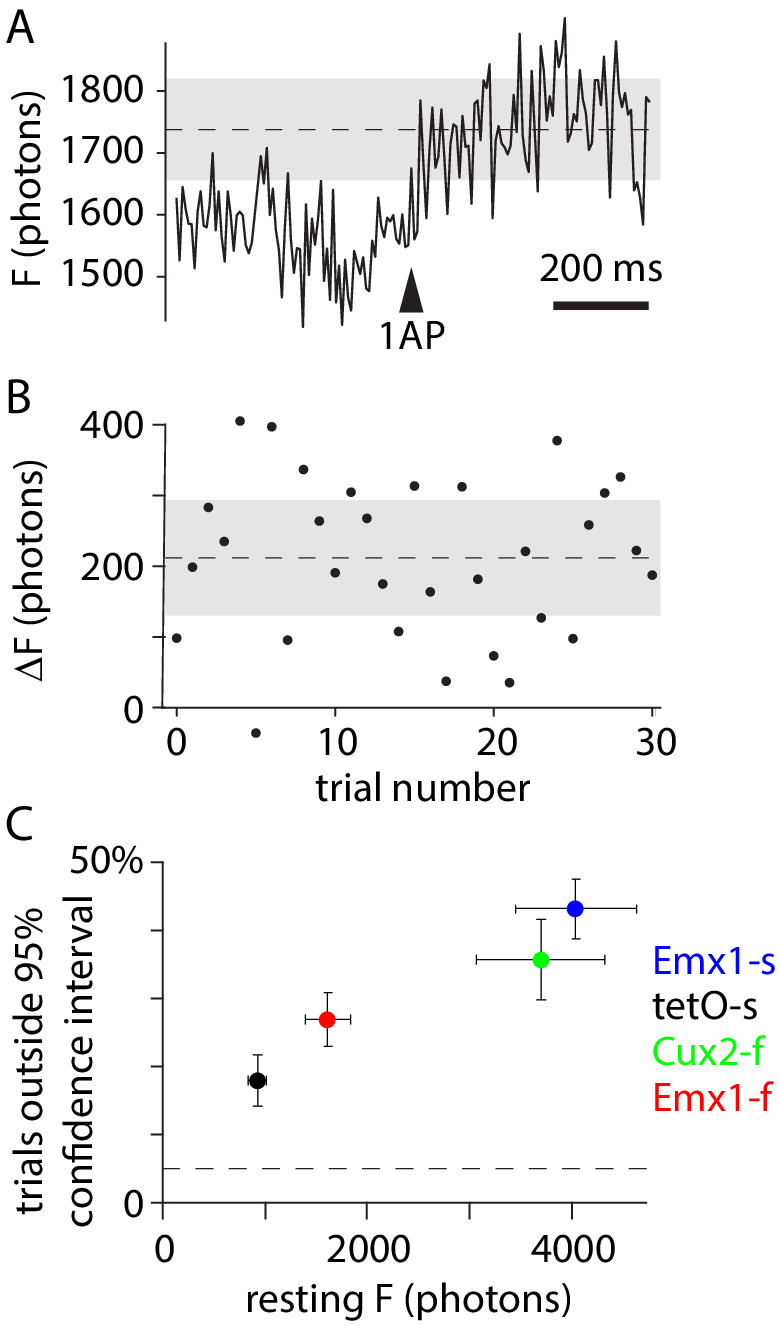
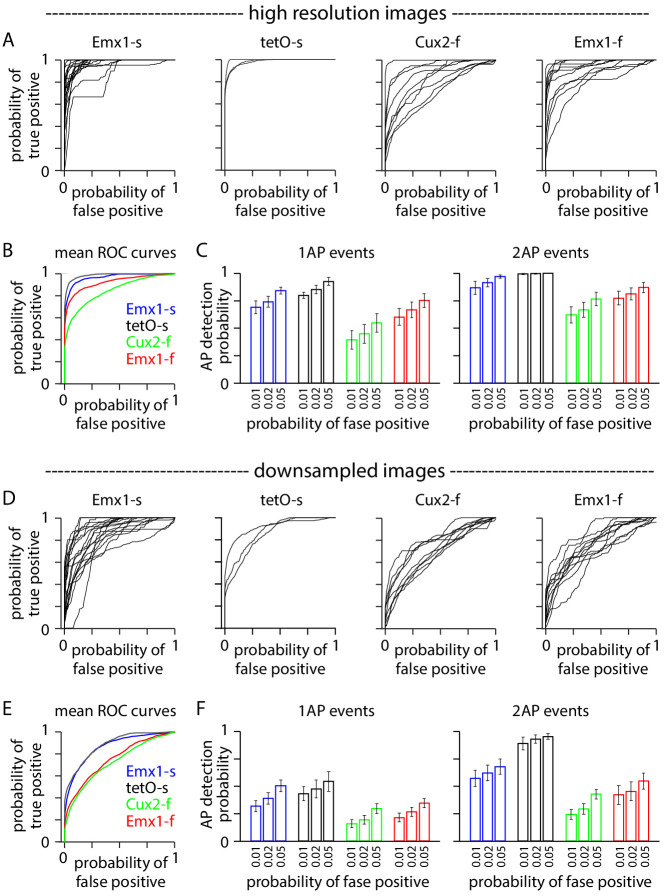
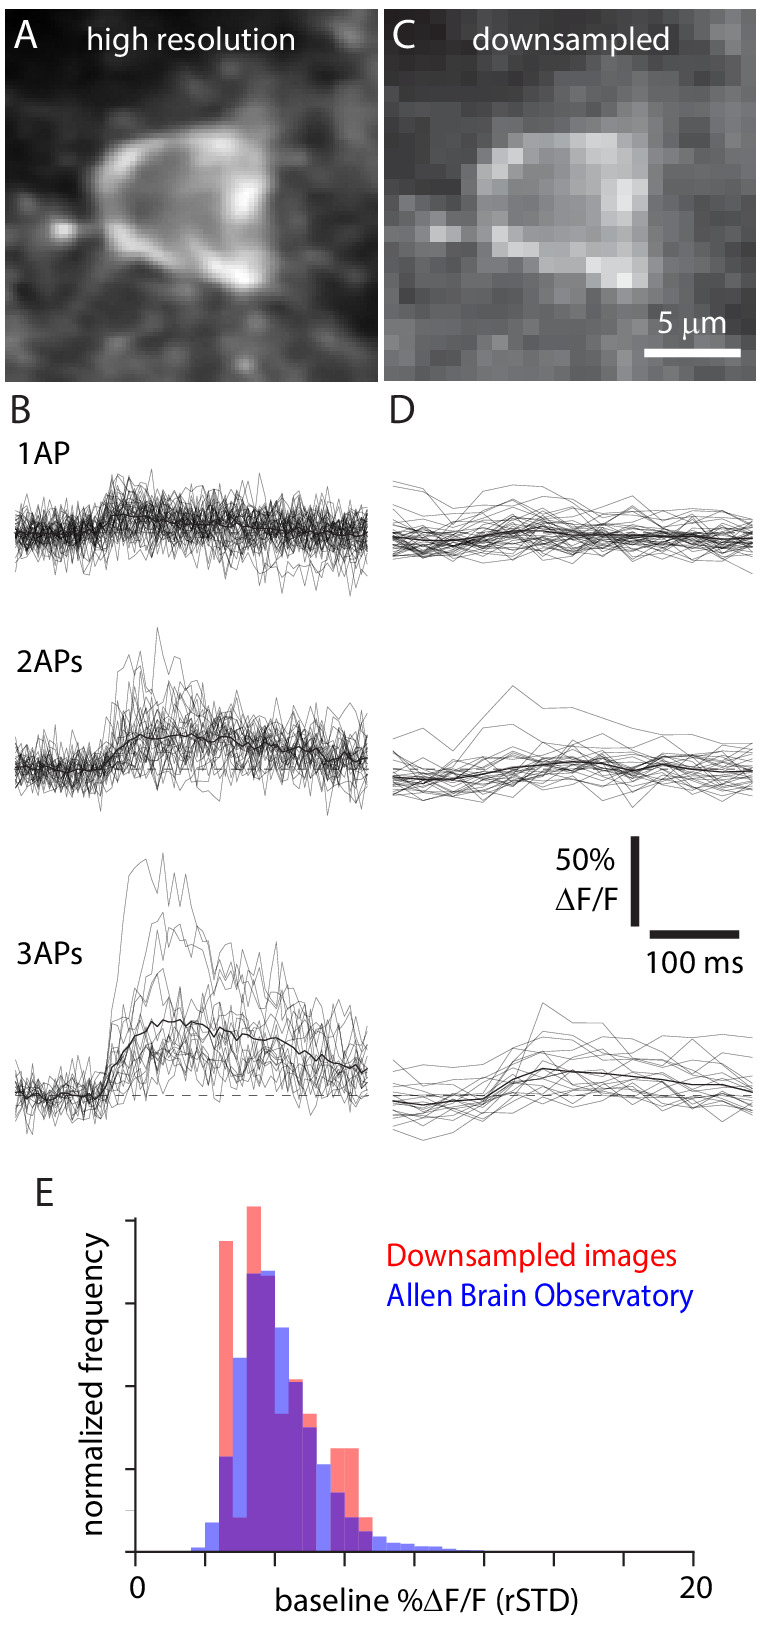
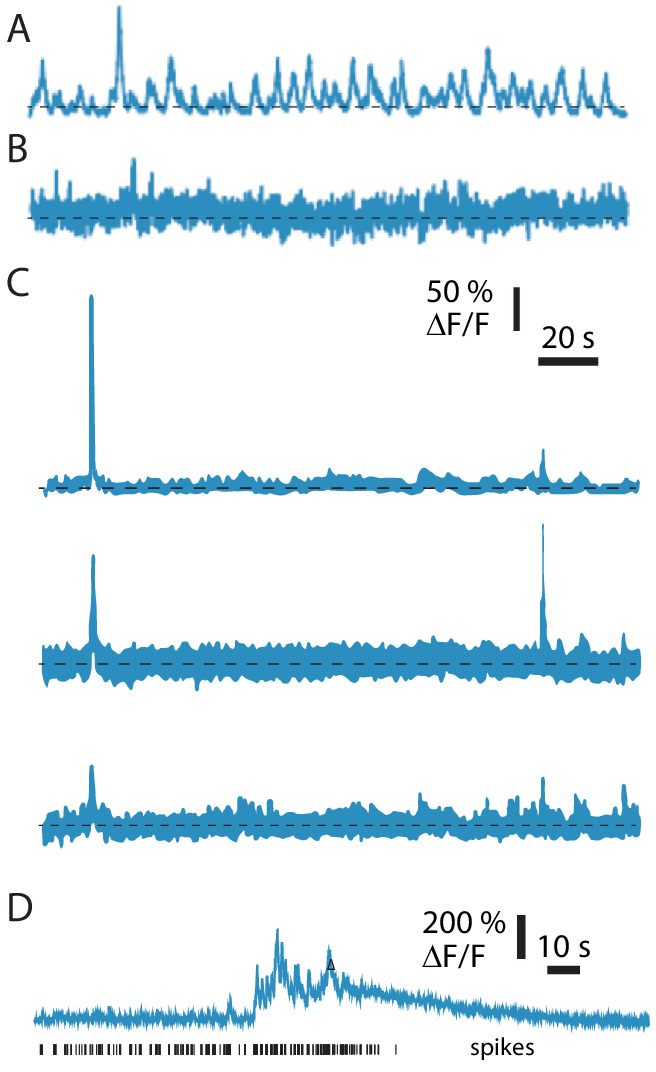
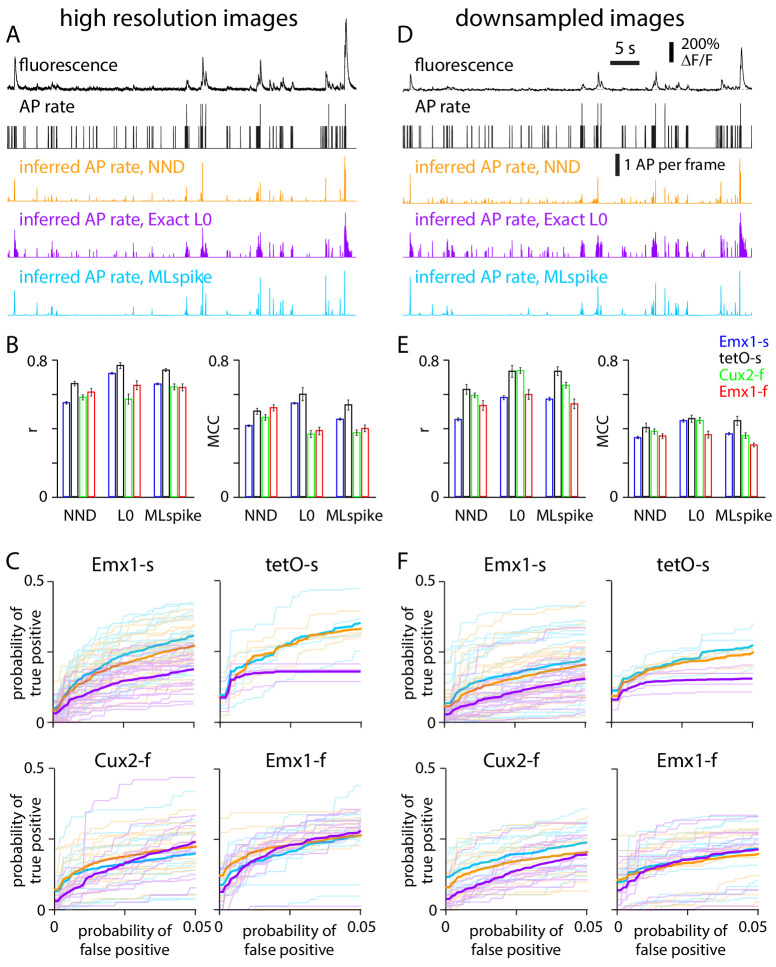
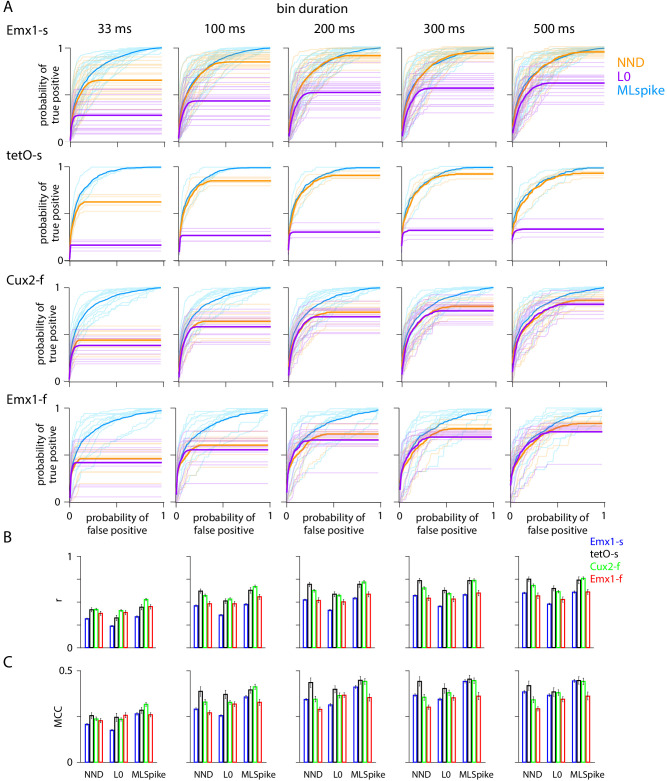
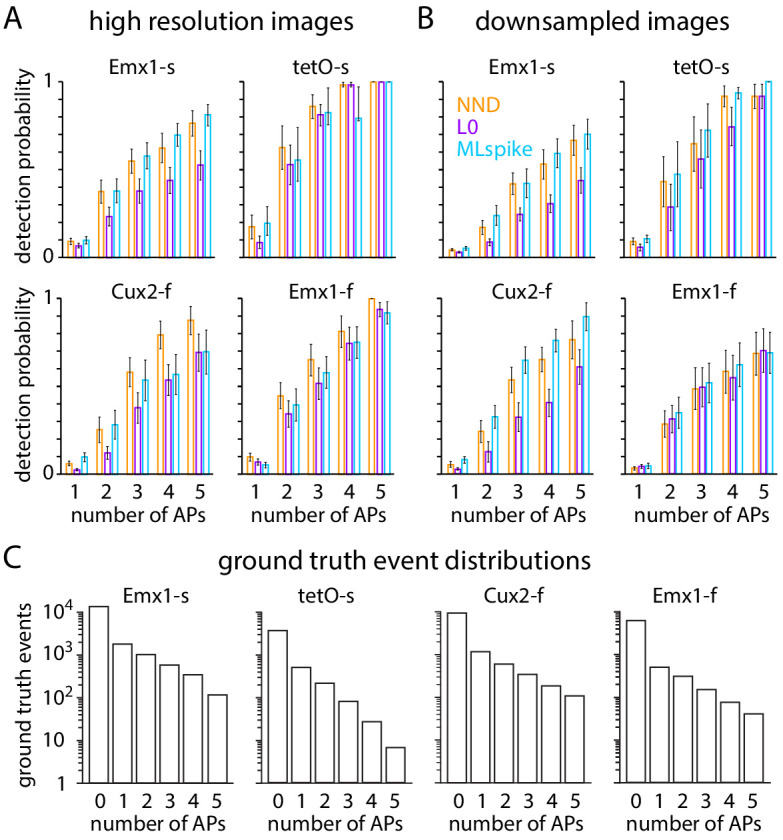
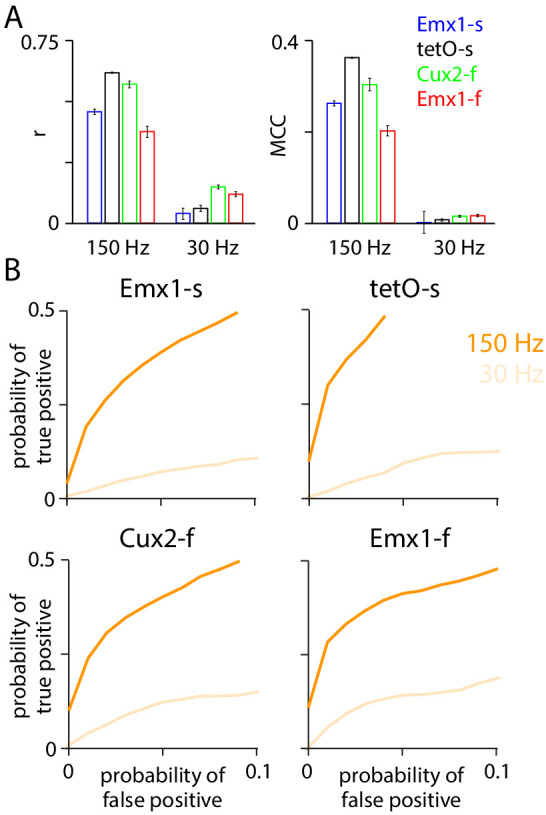
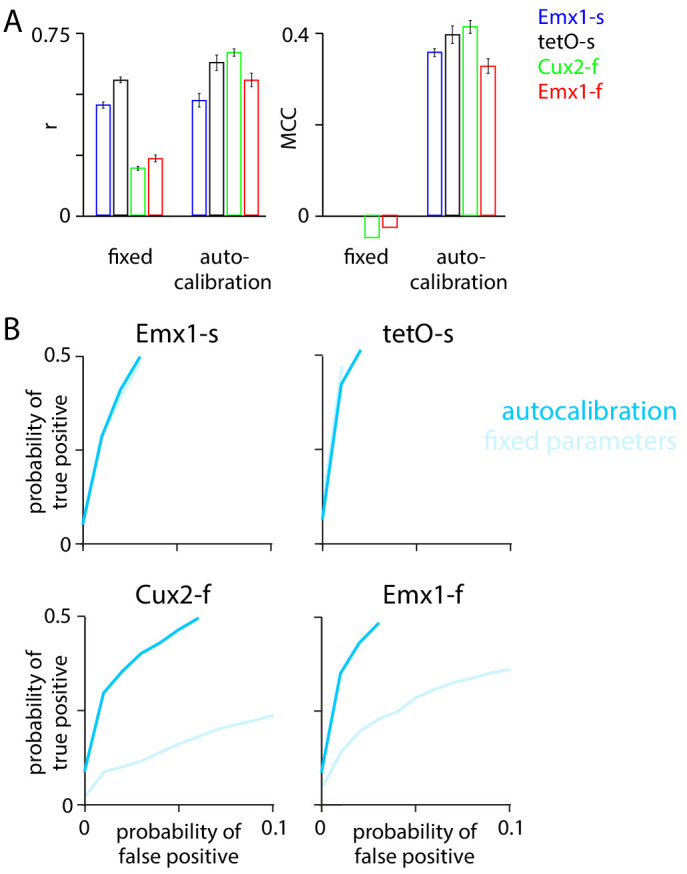
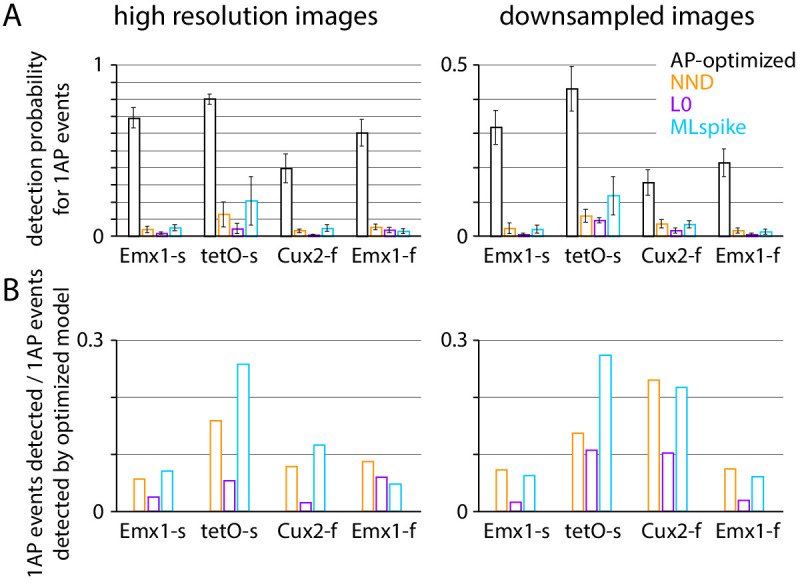
Fluorescent calcium indicators are often used to investigate neural dynamics, but the relationship between fluorescence and action potentials (APs) remains unclear. Most APs can be detected when the soma almost fills the microscope's field of view, but calcium indicators are used to image populations of neurons, necessitating a large field of view, generating fewer photons per neuron, and compromising AP detection. Here, we characterized the AP-fluorescence transfer function in vivo for 48 layer 2/3 pyramidal neurons in primary visual cortex, with simultaneous calcium imaging and cell-attached recordings from transgenic mice expressing GCaMP6s or GCaMP6f. While most APs were detected under optimal conditions, under conditions typical of population imaging studies, only a minority of 1 AP and 2 AP events were detected (often <10% and ~20-30%, respectively), emphasizing the limits of AP detection under more realistic imaging conditions.

Keywords: action potential; calcium imaging; calibration; cell-attached recording; excitatory neurons; genetically encoded calcium indicator; mouse; neuroscience.

Plain language summary

Neurons, the cells that make up the nervous system, transmit information using electrical signals known as action potentials or spikes. Studying the spiking patterns of neurons in the brain is essential to understand perception, memory, thought, and behaviour. One way to do that is by recording electrical activity with microelectrodes. Another way to study neuronal activity is by using molecules that change how they interact with light when calcium binds to them, since changes in calcium concentration can be indicative of neuronal spiking. That change can be observed with specialized microscopes know as two-photon fluorescence microscopes. Using calcium indicators, it is possible to simultaneously record hundreds or even thousands of neurons. However, calcium fluorescence and spikes do not translate one-to-one. In order to interpret fluorescence data, it is important to understand the relationship between the fluorescence signals and the spikes associated with individual neurons. The only way to directly measure this relationship is by using calcium imaging and electrical recording simultaneously to record activity from the same neuron. However, this is extremely challenging experimentally, so this type of data is rare. To shed some light on this, Huang, Ledochowitsch et al. used mice that had been genetically modified to produce a calcium indicator in neurons of the visual cortex and simultaneously obtained both fluorescence measurements and electrical recordings from these neurons. These experiments revealed that, while the majority of time periods containing multi-spike neural activity could be identified using calcium imaging microscopy, on average, less than 10% of isolated single spikes were detectable. This is an important caveat that researchers need to take into consideration when interpreting calcium imaging results. These findings are intended to serve as a guide for interpreting calcium imaging studies that look at neurons in the mammalian brain at the population level. In addition, the data provided will be useful as a reference for the development of activity sensors, and to benchmark and improve computational approaches for detecting and predicting spikes.


Conflict of interest statement

LH, PL, UK, JL, GM, RR, Sd, CK, HZ, MB, JW, LL No competing interests declared

Figures

Figure 1.
Figure 1.. Simultaneous calcium imaging and electrophysiology in vivo.
(A) Experimental design. (B) Fluorescence and Vm traces from an exemplar Emx1-s neuron. (C) 5 s of data from the neuron in panel B, showing a 2 AP, a 1 AP, and a 3 AP event. Pre- and post-AP exclusion windows, used to separate events, are illustrated for each event. AP, action potential.
Figure 1—figure supplement 1.
Figure 1—figure supplement 1.. Mouse age, cell depth, and firing rate.
(A) Mouse age. (B) Cell depths. (C) For each neuron, percentage of action potentials (APs) contained within 1–5 AP events.
Figure 2.
Figure 2.. Neuropil subtraction optimized for 1 AP (action potential) detection.
(A) Effect of changing neuropil subtraction on detection for exemplar GCaMP6s and GCaMP6f neurons. Upper plots: family of receiver operating characteristic (ROC) curves. Each curve illustrates detection probability for true APs against probability of false positives as detection threshold is changed, for 1 AP events. False positives were calculated from time windows with no APs. Each ROC curve represents a different value of r. Lower plots: area under the ROC curve as a function of r. Gray symbols represent value of r for which r * Fneuropil(t) was greater than Fcell_measured(t), resulting in a negative F0 and inversion of the ΔF/F trace. (B) Distribution of r values for 20 GCaMP6f neurons.
Figure 2—figure supplement 1.
Figure 2—figure supplement 1.. Simulated effect of neuropil subtraction on event detection.
(A) Simulated cell and neuropil traces. The neuropil trace contained transients that were (1) associated with cell transients and (2) between cell transients, and amplitudes were scaled by the neuropil contamination ratio r (r = 0.3) relative to the cell amplitudes. (B) (Left) Receiver operating characteristic (ROC) curves for classifying cell amplitudes, where r was varied from 0 to 1 for neuropil correction. The detection threshold was defined as the xth percentile of noise amplitudes (amplitudes of the neuropil trace that were between cell transients), where 1–x represented the false positive probability, and the detection probability (true positive probability) was the fraction of estimated cell amplitudes (amplitudes of the summed trace that were associated with cell transients) above the detection threshold. (Right) Area under ROC curves as a function of r.
Figure 3.
Figure 3.. Action potential (AP)-evoked calcium transients in four mouse lines.
(A) Example fluorescence traces (ΔF/F, with r = 0.82 neuropil subtraction) for 1 AP, 2 AP, and 3 AP events for an exemplar Emx1-s neuron (forty-two 1 AP events, thirty-eight 2 AP events, sixteen 3 AP events) and an exemplar Emx1-f neuron (twenty-three 1 AP events, twelve 2 AP events, eleven 3 AP events). (B) Mean fluorescence traces and fits (sum of two exponentials) for 1–5 AP events for the two neurons in A. (C) Mean ± SEM peak DF/F, rise time constant, and decay time constant for four mouse lines. Number of neurons for 1–5 AP events were: 15, 16, 14, 9, 6 for Emx1-s; 4, 4, 4, 0, 0 for tetO-s; 10, 10, 10, 5, 4 for Emx1-f; 9, 9, 7, 4, 2 for Cux2-f. Asterisks indicate differences between mouse lines (p<0.05, one-way ANOVA).
Figure 3—figure supplement 1.
Figure 3—figure supplement 1.. Trial-to-trial variability of 1 AP (action potential) events.
Fraction of trials in which the peak of the fluorescence transient exceeded the range expected from Poisson noise, a measure of trial-to-trial variability. (A) Example 1 AP event for an Emx1-s neuron, with fluorescence in units of photons. Dashed line: mean, across trials, of peak fluorescence. Gray: 95% confidence interval for Poisson-distributed noise. (B) Amplitudes of 1 AP events for 30 trials. Dashed line and gray area: mean and 95% confidence interval. (C) Mean ± SEM percentage of trials with peak ΔF outside the 95% confidence interval, for each mouse line. In all four mouse lines, peak fluorescence exceeded the 95% confidence interval for Poisson-distributed noise in >>5% of 1 AP trials. The fraction of trials outside the confidence interval correlated with resting fluorescence, likely the result of different illumination intensities across experiments.
Figure 4.
Figure 4.. Downsampling affects event detection.
(A–C) Event detection from images at high spatial and temporal resolution. (A) Receiver operating characteristic (ROC) curves for 1 AP events in 42 neurons, organized by mouse line. Neuropil subtraction was performed with r = 0.8 where possible (see 'Materials and methods'). Numbers of neurons were 18 Emx1-s, 3 tetO-s, 11 Cux2-f, 9 Emx1-f. (B) Mean ROC curves for the four mouse lines. (C) Event detection probabilities for 1 AP and 2 AP events. Bars represent mean ± SEM. (D–F) Equivalent plots for the same neurons after downsampling.
Figure 5.
Figure 5.. Downsampling mimics large field-of-view images.
(A) Original, high spatial and temporal resolution GCaMP6f image of an exemplar Cux2-f neuron. (B) 1 AP, 2 AP, and 3 AP traces for the same neuron. Thin lines, individual trials; thick line, mean. Dashed line, ΔF/F = 0. (C) Downsampled image of the same neuron. (D) Traces from the downsampled neuron. (E) Normalized distribution of baseline noise (robust standard deviation [rSTD]) for 48 downsampled neurons (red) and 11,816 layer 2/3 neurons from Emx1-f and Cux2-f mice in the Allen Brain Observatory (blue).
Figure 5—figure supplement 1.
Figure 5—figure supplement 1.. Example fluorescence traces from image quality control procedures, implemented during image downsampling.
(A) Median of traces extracted from an example segmentation in which only the neuron of interest was found in each image during segmentation. The trace is significantly different from noise (KS test, p=1.8×10−40). (B) Median of traces extracted from an example segmentation in which only the neuron of interest was found in each image during segmentation. The trace is not significantly different from noise (KS test, p=0.072). (C) Medians of traces extracted from an example segmentation in which three regions of interest were identified. Each trace is significantly different from noise (KS tests, p=7.7×10−152, 1.6 × 10⁻¹⁹, 2.2 × 10⁻²⁵). The sum of these three cluster medians had the highest correlation with the firing rate and was therefore used as the ΔF/F trace for this recording in the dataset. Scale bars apply to A–C. (D) Example fluorescence trace with an abrupt and sustained rise in fluorescence and in spike rate and subsequent loss of spiking activity. This neuron was manually removed from the dataset.
Figure 6.
Figure 6.. Performance of spike inference algorithms on high-resolution and downsampled images.
(A) Results from an exemplar Cux2-f neuron, at high resolution. Fluorescence and action potential (AP) rate from electrophysiology (black). Below, APs per image frame estimated with three spike inference algorithms: MLspike (blue), Exact L0 (purple), and non-negative deconvolution (NND, orange). (B) Pearson correlation coefficient (r) and Matthews correlation coefficient (MCC) for the three algorithms for each mouse line. 300 ms bins. (C) Receiver operating characteristic (ROC) curves, reporting probabilities of detecting true and false events in each time bin. Thin lines: individual neurons. Thick lines: mean across neurons. 300 ms bins. (D–F) Equivalent plots for downsampled images.
Figure 6—figure supplement 1.
Figure 6—figure supplement 1.. Effect of bin duration on measures of spike inference algorithm performance.
(A) Receiver operating characteristic (ROC) curves for MLspike (blue), Exact L0 (purple), and non-negative deconvolution (NND) (orange) algorithms after binning of spike probabilities into 33, 100, 200, 300, and 500 ms bins, for downsampled images resampled to 150 Hz. (B and C) Pearson correlation coefficients (r) and Matthews correlation coefficients (MCC) for each bin duration.
Figure 7.
Figure 7.. Performance of blind spike inference algorithms for 1–5 AP (action potential) events.
(A) Mean ± SEM detection probabilities at 1% false positive probability for high-resolution images. (B) Mean ± SEM detection probabilities at 1% false positive probability for downsampled images. (C) Frequency of 0–5 AP events for 250 ms bins for each mouse line.
Figure 7—figure supplement 1.
Figure 7—figure supplement 1.. Upsampling enhances performance of unconstrained non-negative deconvolution (NND).
Performance of the NND algorithm when applied to fluorescence traces from downsampled images (frame rate 30 Hz) and to the same fluorescence traces after upsampling to 150 Hz. 100 ms bins. (A) Pearson r and Matthews correlation coefficient (MCC). (B) Receiver operating characteristic (ROC) curves.
Figure 7—figure supplement 2.
Figure 7—figure supplement 2.. Autocalibration enhanced performance of MLspike.
Performance of MLspike with and without use of the autocalibration procedure, applied to downsampled images, with fluorescence traces upsampled to a frame rate of 158 Hz. 100 ms bins. (A) Pearson r and Matthews correlation coefficient (MCC). (B) Receiver operating characteristic (ROC) curves.
Figure 7—figure supplement 3.
Figure 7—figure supplement 3.. Comparison of spike inference with blind and ground truth action potential (AP)-optimized algorithms.
(A) Mean ± SEM 1 AP event detection probability at 1% false positive probability for ground truth-optimized and blind algorithms (used in Figure 4 and in Figures 6 and 7, respectively). Traces were selected as for Figure 4. (B) 1 AP events detected by each blind algorithm as a fraction of those detected by the ground truth-optimized algorithm, at 1% false positive probability.

References

    1. Akerboom J, Chen TW, Wardill TJ, Tian L, Marvin JS, Mutlu S, Calderón NC, Esposti F, Borghuis BG, Sun XR, Gordus A, Orger MB, Portugues R, Engert F, Macklin JJ, Filosa A, Aggarwal A, Kerr RA, Takagi R, Kracun S, Shigetomi E, Khakh BS, Baier H, Lagnado L, Wang SS, Bargmann CI, Kimmel BE, Jayaraman V, Svoboda K, Kim DS, Schreiter ER, Looger LL. Optimization of a GCaMP calcium Indicator for neural activity imaging. Journal of Neuroscience. 2012;32:13819–13840. doi: 10.1523/JNEUROSCI.2601-12.2012. - DOI - PMC - PubMed
    1. Berens P, Freeman J, Deneux T, Chenkov N, McColgan T, Speiser A, Macke JH, Turaga SC, Mineault P, Rupprecht P, Gerhard S, Friedrich RW, Friedrich J, Paninski L, Pachitariu M, Harris KD, Bolte B, Machado TA, Ringach D, Stone J, Rogerson LE, Sofroniew NJ, Reimer J, Froudarakis E, Euler T, Román Rosón M, Theis L, Tolias AS, Bethge M. Community-based benchmarking improves spike rate inference from two-photon calcium imaging data. PLOS Computational Biology. 2018;14:e1006157. doi: 10.1371/journal.pcbi.1006157. - DOI - PMC - PubMed
    1. Chen TW, Wardill TJ, Sun Y, Pulver SR, Renninger SL, Baohan A, Schreiter ER, Kerr RA, Orger MB, Jayaraman V, Looger LL, Svoboda K, Kim DS. Ultrasensitive fluorescent proteins for imaging neuronal activity. Nature. 2013;499:295–300. doi: 10.1038/nature12354. - DOI - PMC - PubMed
    1. Daigle TL, Madisen L, Hage TA, Valley MT, Knoblich U, Larsen RS, Takeno MM, Huang L, Gu H, Larsen R, Mills M, Bosma-Moody A, Siverts LA, Walker M, Graybuck LT, Yao Z, Fong O, Nguyen TN, Garren E, Lenz GH, Chavarha M, Pendergraft J, Harrington J, Hirokawa KE, Harris JA, Nicovich PR, McGraw MJ, Ollerenshaw DR, Smith KA, Baker CA, Ting JT, Sunkin SM, Lecoq J, Lin MZ, Boyden ES, Murphy GJ, da Costa NM, Waters J, Li L, Tasic B, Zeng H. A suite of transgenic driver and reporter mouse lines with enhanced Brain-Cell-Type targeting and functionality. Cell. 2018;174:465–480. doi: 10.1016/j.cell.2018.06.035. - DOI - PMC - PubMed
    1. Dana H, Chen T-W, Hu A, Shields BC, Guo C, Looger LL, Kim DS, Svoboda K. Thy1-GCaMP6 transgenic mice for neuronal population imaging in vivo. PLOS ONE. 2014;9:e108697. doi: 10.1371/journal.pone.0108697. - DOI - PMC - PubMed

Publication types

LinkOut - more resources