. 2021 Aug 1;529(11):2883-2910.
doi: 10.1002/cne.25134. Epub 2021 Mar 17.

Ocular dominance columns in V1 are more susceptible than associated callosal patches to imbalance of eye input during precritical and critical periods

Affiliations

Ocular dominance columns in V1 are more susceptible than associated callosal patches to imbalance of eye input during precritical and critical periods

Jaime F Olavarria et al. J Comp Neurol. .

Erratum in

  • Erratum.
    [No authors listed] [No authors listed] J Comp Neurol. 2021 Dec;529(17):3845-3863. doi: 10.1002/cne.25222. Epub 2021 Aug 30. J Comp Neurol. 2021. PMID: 34463057 No abstract available.

Abstract

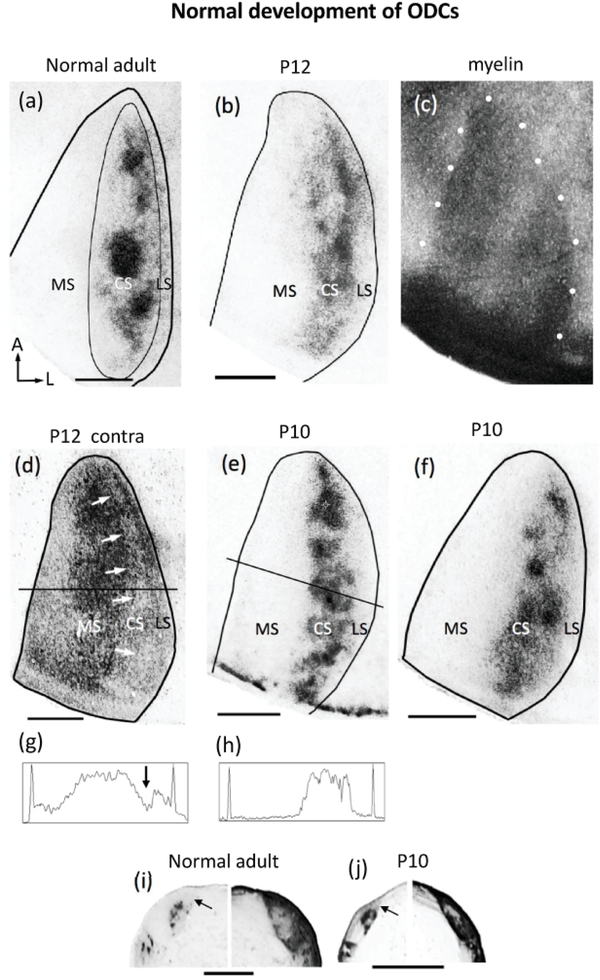
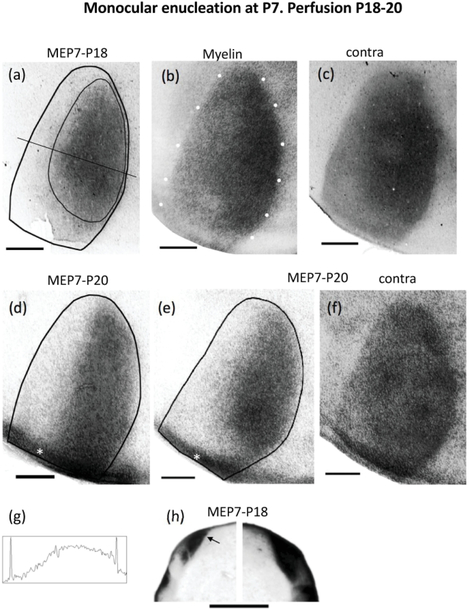
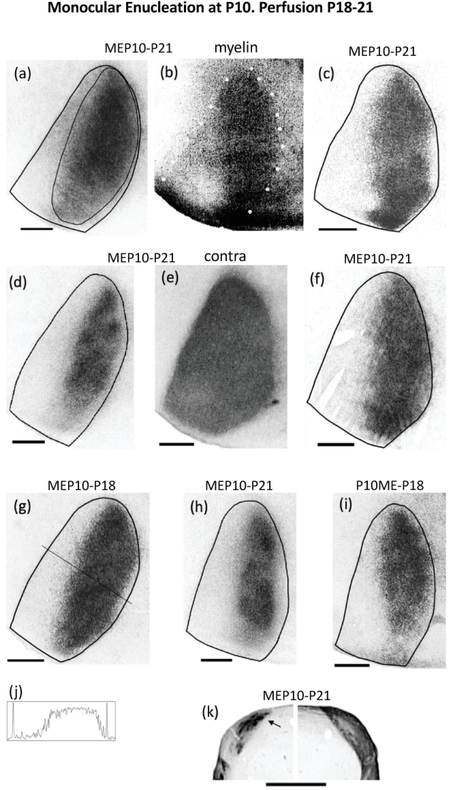
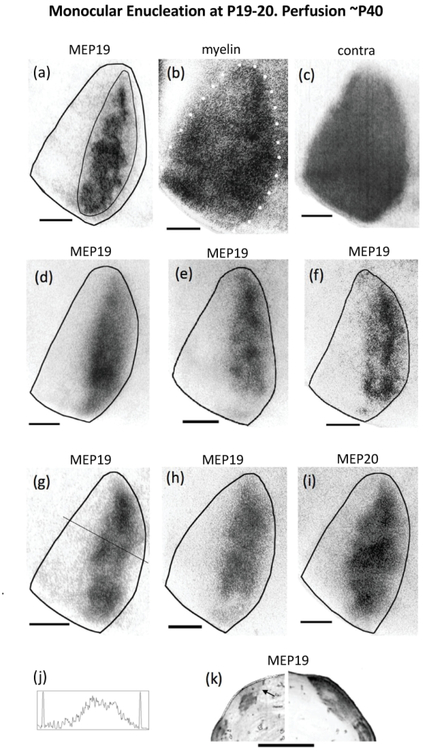
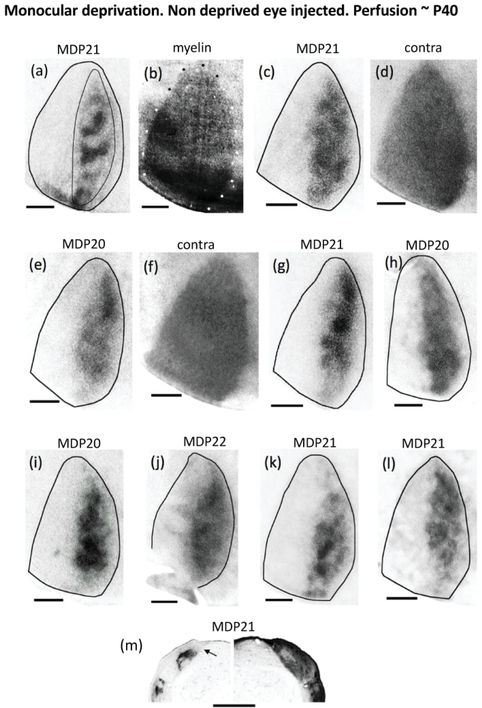
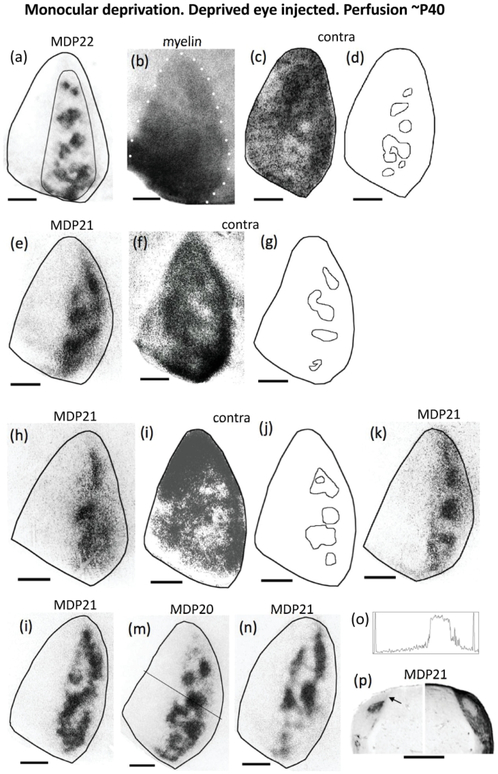
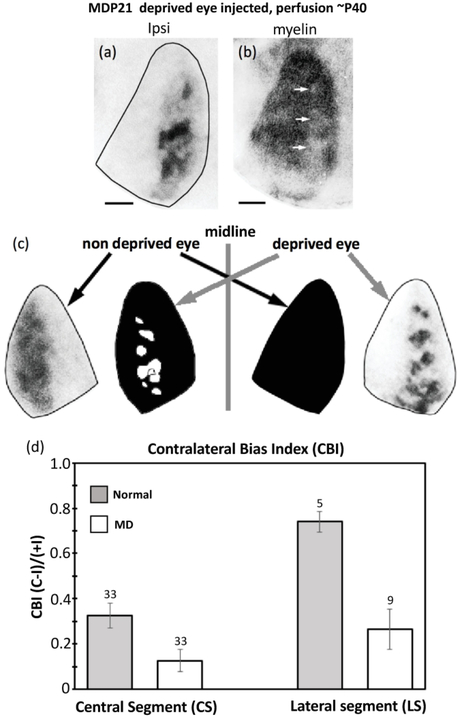
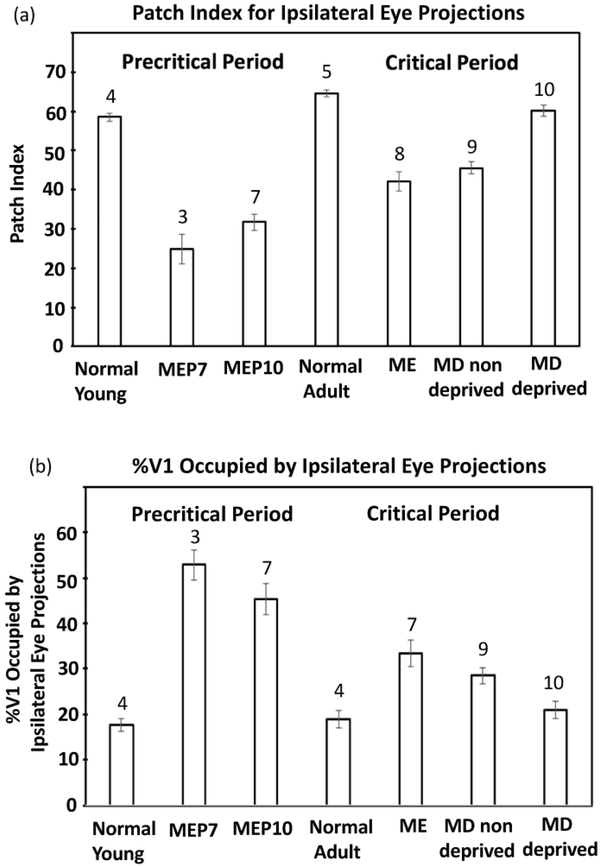
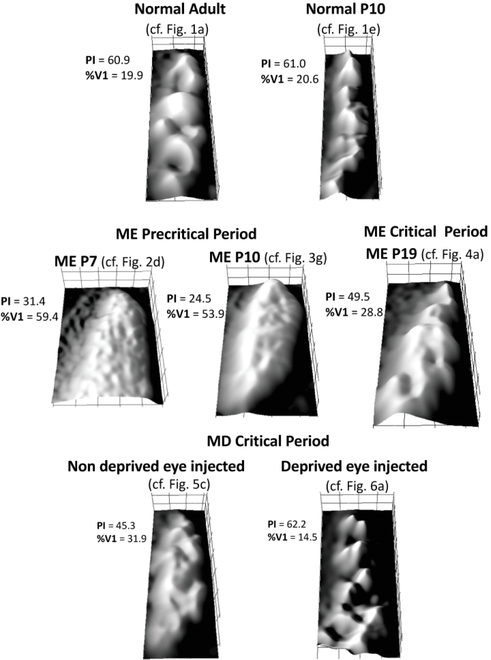
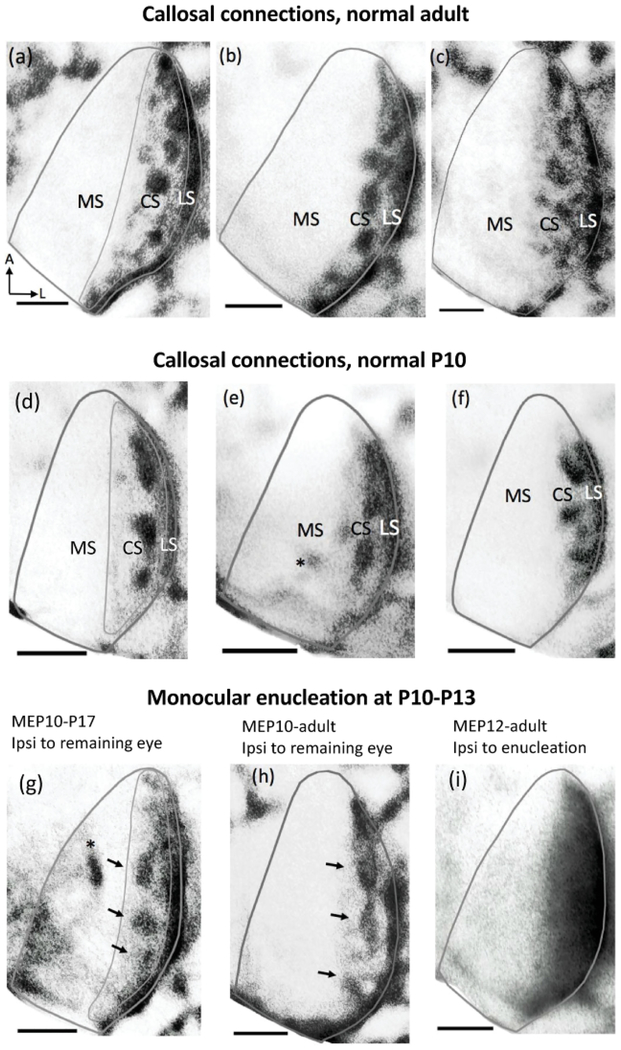
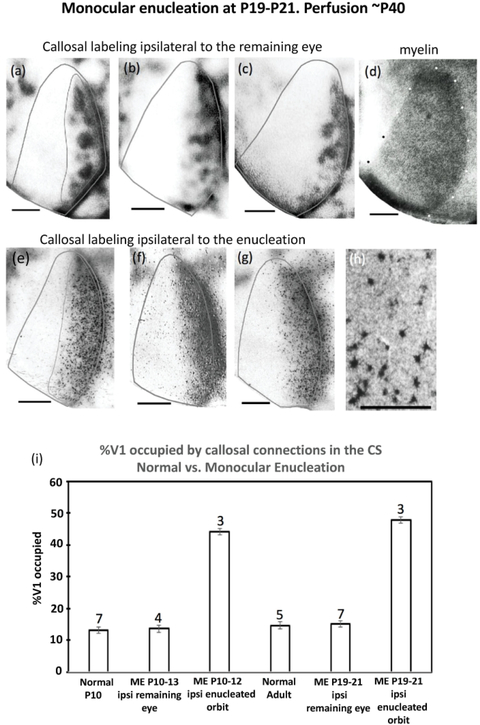
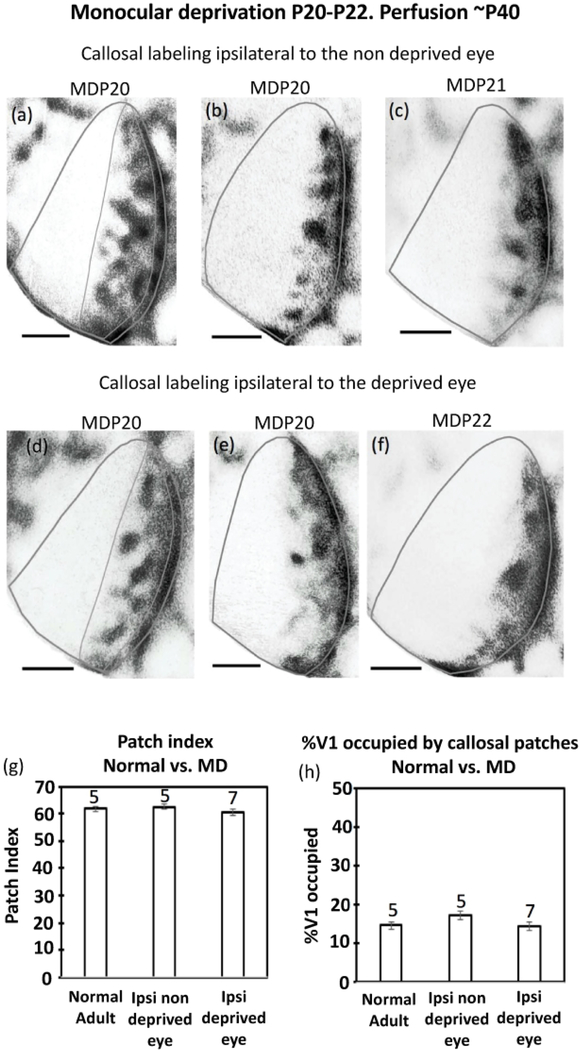
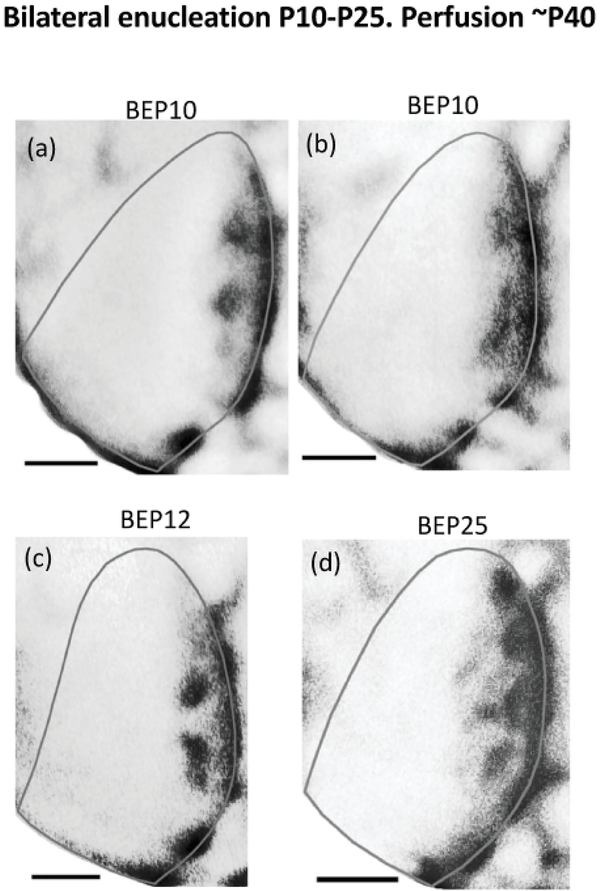
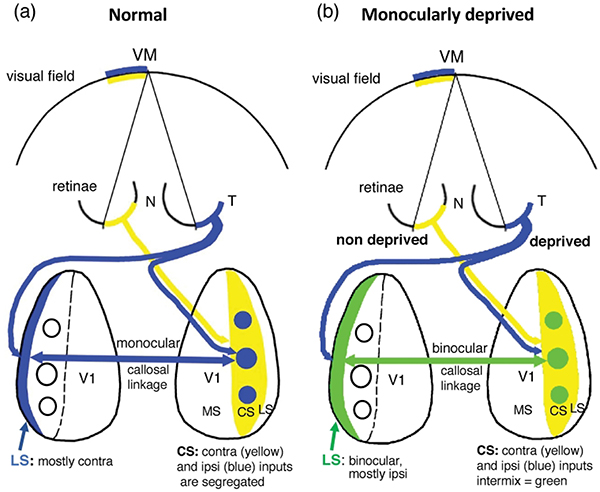
In Long Evans rats, ocular dominance columns (ODCs) in V1 overlap with patches of callosal connections. Using anatomical tracers, we found that ODCs and callosal patches are present at postnatal day 10 (P10), several days before eye opening, and about 10 days before the activation of the critical period for ocular dominance plasticity (~P20). In rats monocularly enucleated at P10 and perfused ~P20, ODCs ipsilateral to the remaining eye desegregated, indicating that rat ODCs are highly susceptible to monocular enucleation during a precritical period. Monocular enucleation during the critical period exerted significant, although smaller, effects. Monocular eye lid suture during the critical period led to a significant expansion of the ipsilateral projection from the nondeprived eye, whereas the contralateral projection invaded into, and intermixed with, ipsilateral ODCs innervated by the deprived eye. We propose that this intermixing allows callosal connections to contribute to the effects of monocular deprivation assessed in the hemisphere ipsilateral to the nondeprived eye. The ipsilateral and contralateral projections from the deprived eye did not undergo significant shrinkage. In contrast, we found that callosal patches are less susceptible to imbalance of eye input. In rats monocularly enucleated during either the precritical or critical periods, callosal patches were maintained in the hemisphere ipsilateral to the remaining eye, but desegregated in the hemisphere ipsilateral to the enucleated orbit. Callosal patches were maintained in rats binocularly enucleated at P10 or later. Similarly, monocular deprivation during the critical period had no significant effect on callosal patches in either hemisphere.

Keywords: Long Evans rats; RRID:RGD 68073; columnar organization; desegregation; eye-specific domains; interhemispheric connections; monocular deprivation; monocular enucleation; primary visual cortex.


Conflict of interest statement

CONFLICT OF INTEREST

Authors declare no conflict of interest

Figures

Figure 1
Figure 1
Development of ODCs in Long Evans rats revealed following WGA-HRP labeling of retino-geniculo-cortical projections. (a) Representative case of ipsilateral eye labeling in adult Long Evans rat (adapted from Laing et al., 2015). Thin line outlines the subdivision of V1 into medial (MS), central (CS) and lateral (LS) segments. Note the distinctly labeled ODCs in the central segment of V1 and the largely unlabeled LS, interposed between the ODCs and the lateral border of V1. Bottom, left arrows in (a) indicate anterior (A) and lateral (L). (b) Data from a P12 rat showing that the ipsilateral eye labeling in the CS is patchy, and that the lateral segment is present. The black line indicates the border of V1 determined based on the myelin pattern from the same case delineated by white dots in (c). (d) Labeling in the contralateral hemisphere in the case shown in (b). Arrows indicate reduced labeling in a region corresponding to the CS, which likely correspond to ipsilateral input from the eye not injected with WGA-HRP. The reduction in labeling at the level indicated by a horizontal line is indicated by an arrow in the density scan in (g). The reduction in the labeling density in medial V1 is likely due to the section passing out of layer 4 in this region. The peaks at both ends of the scan indicate the medial (left) and lateral (right) borders of V1. (e) Data from a P10 rat showing that patchiness of ipsilateral eye input is visible at this age. A density scan at the level indicated is shown in (h). (f) Data from another rat studied at P10, also showing patchy ipsilateral eye projections. (i) Labeling pattern in the LGN of a normal adult rat showing ipsilateral (left) and contralateral (right) eye projections. (j) Ipsilateral (left) and contralateral (right) labeling in the LGN of a P10 rat. Arrows in (i) and (j) indicate dorsomedial region that remains unlabeled after intraocular injections of WGA-HRP into the ipsilateral eye in normal young and adult rats. This LGN region innervates the LS in V1 (see Refs. in text). In the LGN contralateral to the injection in both adult and young rats, an area of reduced labeling is observed, likely corresponding to ipsilateral territory innervated by the non-injected eye. Cortical labeling in both hemispheres is represented as right hemispheres, lateral to the right. Scale bars = 1.0 mm.
Figure 2
Figure 2
Retino-geniculo-cortical projections from the remaining eye in rats monocularly enucleated at P7 (MEP7) and perfused before the onset of the critical period. The age at perfusion is indicated by the second number above each case. (a),(d),(e) Ipsilateral projections in cases perfused at P18 (a) and P20 (d)(e). The thin line in (a) illustrates the region used for calculating the patch index and the %V1 occupied by ipsilateral eye projections (see Materials and Methods). (b) White dots indicate myelin pattern used to delineate the V1 border in (a). (c),(f) Distribution of WGA-HRP labeling in V1 contralateral to the injection for cases shown in (a) and (e), respectively. Note that areas of reduced labeling corresponding to ipsilateral territory serving the enucleated orbit are not observed. (g) Density scan at the level indicated in (a). (h) Ipsilateral (left) and contralateral (right) labeling in the LGN of a rat monocularly enucleated at P7 and perfused at P18. Arrow indicates dorsomedial region that is densely labeled after intraocular injections of WGA-HRP into the ipsilateral eye. In the contralateral LGN, note that an area of reduced labeling corresponding to ipsilateral territory serving the enucleated orbit is not observed. The asterisks in (d) and (e) indicate areas of artifactual labeling that were not included in the measurements. ME = monocular enucleation. Scale bars = 1.0 mm. Other conventions as in Figure 1.
Figure 3
Figure 3
Retino-geniculo-cortical projections from the remaining eye in rats monocularly enucleated at P10 and perfused before the onset of the critical period. Seven cases are shown: (a)(c)(d)(f)(g)(h)(i). (a),(c),(d),(f),(h) Cases perfused at P21. (g),(i) Cases perfused at P18. The thin line in (a) illustrates the region used for calculating the patch index and the %V1 occupied by ipsilateral eye projections. (b) White dots indicate myelin pattern used to delineate the V1 border in (a). (e) Distribution of WGA-HRP labeling in V1 contralateral to the injection for the case shown in (d). Note that areas of reduced labeling corresponding to ipsilateral projections from the enucleated orbit are not observed. (j) Density scan at the level indicated in (g). (k) Ipsilateral (left) and contralateral (right) labeling in the LGN of a rat monocularly enucleated at P10 and perfused at P21. Arrow indicates dorsomedial region that is densely labeled after intraocular injections of WGA-HRP into the ipsilateral eye. Note that an area of reduced labeling corresponding to territory innervated by ipsilateral projections from the enucleated orbit is observed in the LGN contralateral to the injection. Scale bars = 1.0 mm. Other conventions as in Figures 1, 2.
Figure 4
Figure 4
Retino-geniculo-cortical projections from the remaining eye in rats monocularly enucleated at the beginning of the critical period and perfused at adulthood. Seven cases shown: (a)(d)(e)(f)(g)(h)(i). The thin line in (a) illustrates the region used for calculating the patch index and the %V1 occupied by ipsilateral eye projections. (b) White dots indicate myelin pattern used to delineate the V1 border in (a). (c) Distribution of WGA-HRP labeling in V1 contralateral to the injection for the case shown in (a),(b). Note that areas of reduced labeling corresponding to ipsilateral projections from the enucleated orbit are not observed. (j) Density scan at the level indicated in (g). (k) Ipsilateral (left) and contralateral (right) labeling in the LGN of a rat monocularly enucleated at P19 and perfused at P46. Arrow indicates dorsomedial region that remains unlabeled after intraocular injections of WGA-HRP into the ipsilateral eye. Note that an area of reduced labeling that likely corresponds to territory innervated by ipsilateral projections from the enucleated orbit is observed in the LGN contralateral to the injection. Scale bars = 1.0 mm. Other conventions as in Figure 1.
Figure 5
Figure 5
Retino-geniculo-cortical projections from the non-deprived eye in rats monocularly deprived at the beginning of the critical period (P20-P22) and perfused at adulthood. Nine cases shown: (a)(c)(e)(g)(h)(i)(j)(k)(l). The thin line in (a) illustrates the region used for calculating the patch index and the %V1 occupied by ipsilateral eye projections. (b) White and black dots indicate myelin pattern used to delineate the V1 border in (a). (d),(f) Distribution of WGA-HRP labeling in V1 contralateral to the injection for the cases shown in (c) and (e), respectively. Note that areas of reduced labeling corresponding to ipsilateral projections from the deprived eye are not observed. (m) Ipsilateral (left) and contralateral (right) labeling in the LGN of a rat monocularly deprived at P21 and perfused at adulthood. Arrow indicates dorsomedial region that remains unlabeled after intraocular injections of WGA-HRP into the ipsilateral eye. Note that an area of reduced labeling that likely corresponds to territory innervated by ipsilateral projections from the deprived eye is observed in the LGN contralateral to the injection. Scale bars = 1.0 mm. Other conventions as in Figure 1.
Figure 6
Figure 6
Retino-geniculo-cortical projections from the deprived eye in rats monocularly deprived at the beginning of the critical period (P20-P22) and perfused at adulthood. Seven cases shown: (a)(e)(h)(k)(l)(m)(n). The thin line in (a) illustrates the region used for calculating the patch index and the %V1 occupied by ipsilateral eye projections. (b) White dots indicate myelin pattern used to delineate the V1 border in (a). (c),(f),(i) Distribution of WGA-HRP labeling in V1 contralateral to the injection for the cases shown in (a),(e),(h), respectively. Note the areas of reduced or absent labeling likely corresponding to territory serving ipsilateral projections from the non-deprived eye. Respective outlines of these areas are shown in (d),(g),(j). (o) Density scan at the level indicated in (m). The drop in labeling density is abrupt on both the medial and lateral sides, as it occurs in normal young rats (cf. Figure 1g). (p) Ipsilateral (left) and contralateral (right) labeling in the LGN of a rat monocularly deprived at P21 and perfused at adulthood. Arrow indicates dorsomedial region that remains unlabeled after tracer injections into the ipsilateral eye. In the LGN contralateral to the injection, note the area of reduced labeling corresponding to territory innervated by ipsilateral projections from the non-deprived eye. Scale bars = 1.0 mm. Other conventions as in Figure 1.
Figure 7
Figure 7
(a) Ocular dominance columns in the hemisphere ipsilateral to the deprived eye appear to correlate with areas of reduced myelin density [arrows in (b)] in some monocularly deprived rats. Scale bars = 1.0 mm. (c) Schematic diagram of the relationship between projections from the deprived and non-deprived eye in V1 of rats monocularly deprived at the beginning of the critical period and perfused at adulthood. Contralateral projections are represented in black. Note that the contralateral projections from the non-deprived eye are distributed throughout V1, invading and intermixing with the ipsilateral ODCs serving the deprived eye. In contrast, little or no intermixing of contralateral and ipsilateral projections occurs in the hemisphere ipsilateral to the non-deprived eye. (d) Quantitative analysis of binocularity in central and lateral segments of V1 in Long Evans and in V1 ipsilateral to the non-deprived eye in monocularly deprived rats. In the central segment, the CBI shifts from moderate dominance by the contralateral eye in normal rats (CBI = 0.33, n = 33 recording sites) to more binocular responses in monocularly enucleated rats (CBI = 0.12, n = 33 recording sites). In the lateral segment, there is a sizable shift from strong dominance by the contralateral eye in normal rats (CBI = 0.74, n = 5 recording sites) to more binocular responses in monocularly enucleated rats (CBI = 0.26, n = 9 recording sites). Number over the bars indicate recording sites. Error bars indicate SEM.
Figure 8
Figure 8
Patch index and %V1 occupied by ipsilateral projections from the injected eye. (a) Comparison of the patch indices for groups studied during the precritical and critical periods. (b) Comparison of the %V1 occupied by the ipsilateral projections from the injected eye for groups studied during the precritical and critical periods. ME: monocularly enucleated; MD: monocularly deprived by eyelid suture. Numbers above the bars indicate number of cases in each group of animals. Error bars indicate SEM.
Figure 9
Figure 9
3D surface plots of the labeling density distribution of ipsilateral projections from the injected eye to V1 in a representative case from each experimental group in this study. ME: monocularly enucleated; MD: monocularly deprived by eyelid suture. For each plot, the location of the original case is indicated, as well as the values for patch index and %V1 occupied by ipsilateral eye projections.
Figure 10
Figure 10
Pattern of callosal patches in V1 of normal adult, normal P10 and in rats monocularly enucleated at P10-P13. The callosal pattern was revealed following intracortical Injections of horseradish peroxidase (HRP) in the opposite hemisphere. The thin lines in (a),(d),(g) illustrate the region used for analysis. This region does not include the band of callosal labeling at the 17/18a border. (a),(b),(c) Callosal patterns in the right hemisphere of normal adult rats. Bottom, left arrows in (a) indicate anterior (A) and lateral (L). Note the distinctly labeled patches in the CS of V1 and the densely labeled band in the LS. (d),(e),(f) Callosal patterns in V1 of rats perfused at P10. Note that both the callosal patches in the CS and the band of callosal connections in the LS are visible at this age. Asterisk in (e) indicates artifact. (g),(h) Callosal patterns in the hemisphere ipsilateral to the remaining eye. Arrows indicate callosal patches. Asterisk in (g) indicates artifact. (i) Dense HRP-labeling is widely distributed over the lateral half of V1 in the hemisphere ipsilateral to the enucleation. Scale bars = 1.0 mm. Other conventions as in Figures 1.
Figure 11
Figure 11
Effect on the callosal pattern of monocular enucleation at P19-P21 and perfusion at adulthood. (a),(b),(c) Labeling ipsilateral to the remaining eye. Note the callosal patches in the region corresponding to the CS, and the densely labeled band in the region corresponding to the LS. (d) V1 myelin pattern (white dots) for case in (c). (e),(f),(g) HRP labeling ipsilateral to the enucleated orbit. Note that no callosal patches are observed. h) High magnification view of retrogradely labeled callosal cells from case in (f). The thin lines in (a),(e) illustrate the region used for analysis. This area does not include the band of callosal labeling at the 17/18a border. (i) Comparison of the %V1 occupied by callosal connections in the central segment of either the hemisphere ipsilateral to the remaining eye, or ipsilateral to the enucleated orbit following monocular enucleation at P10–13 or P19-P21. ME = monocular enucleation. Numbers above the bars indicate number of cases in each group of animals. Error bars indicate SEM. Scale bar in (h) = 100 um, other scale bars = 1.0 mm.
Figure 12
Figure 12
Effect on the callosal pattern of monocular deprivation at P20-P22 and perfusion at adulthood. (a),(b),(c) Labeling ipsilateral to the non deprived eye. (d),(e),(f) Labeling ipsilateral to the deprived eye. The thin lines in (a),(d) illustrate the region used for analysis. This area does not include the band of callosal labeling at the 17/18a border. (g) Comparison of patch indices in the central segment in normal adult, in the hemisphere ipsilateral to the non deprived eye, and in the hemisphere ipsilateral to the deprived eye. (h) Comparison of the %V1 occupied by callosal patches in normal adult, in the hemisphere ipsilateral to the non deprived eye, and in the hemisphere ipsilateral to the deprived eye. Numbers above the bars indicate number of cases in each group of animals. Error bars indicate SEM. MD = monocular deprivation. Scale bars = 1.0 mm.
Figure 13
Figure 13
Callosal pattern in the right hemisphere in rats binocularly enucleated at, or after, P10 and perfused at adulthood. Note the distinctly labeled patches in a region corresponding to the central segment of V1, and the densely-labeled band in a region corresponding to the lateral segment. Scale bars = 1 mm.
Figure 14
Figure 14
Potential contribution of callosal connections to the effect of monocular deprivation assessed in the hemisphere ipsilateral to the non-deprived eye. In Long Evans rats, callosal connections connect asymmetric, but topographically corresponding, loci in V1, such that opposite central and lateral segments connect reciprocally with each other (Lewis & Olavarria, 1995). (a) In normal Long Evans rats, ODCs and patchy callosal connections prevent the passage of ipsilateral eye input to the lateral segment. The left lateral segment (blue) cannot receive transcallosal input from the left, ipsilateral nasal retina (yellow) because the contralaterally dominated territory in the right central segment (yellow) is deprived of callosal connections (callosal patches overlap with ipsilateral ODCs, colored blue, Laing et al., 2015). (b) In contrast, in the hemisphere ipsilateral to the deprived eye, contralateral projections from the non-deprived eye (yellow) intermix with ODCs (circles) innervated by projections (blue) from the deprived eye (yellow+blue = green). Due to the intermixing, and because ODCs correlate with patches of callosal connections (Laing et al. 2015), the LS in the hemisphere ipsilateral to the non-deprived eye can now receive ipsilateral input from the non-deprived eye (yellow) via the callosum. Although the transcallosal input is depicted as binocular (green), it is likely that it is mostly ipsilateral because the input from the deprived eye (blue) is weak due to the deprivation. Inhibiting callosal communication would reduce ipsilateral eye responses in the hemisphere ipsilateral to the non-deprived eye, thereby reducing the effect of monocular deprivation in that hemisphere (Restani et al., 2009). CS, central segment; LS, lateral segment; MS, medial segment.

Similar articles

Cited by

References

    1. Aggoun-Zouaoui D, Kiper DC, & Innocenti GM (1996). Growth of callosal terminal arbors in primary visual areas of the cat. European Journal of Neuroscience, 8(6), 1132–1148. - PubMed
    1. Andelin AK, Doyle Z, Laing RJ, Turecek J, Lin B, & Olavarria JF (2020). Influence of ocular dominance columns and patchy callosal connections on binocularity in lateral striate cortex: Long Evans vs. Albino Rats. The Journal of Comparative Neurology, 528(4), 650–663. - PMC - PubMed
    1. Anderson PA, Olavarria J, & Van Sluyters RC (1988). The overall pattern of ocular dominance bands in cat visual cortex. The Journal of Neuroscience, 8(6), 2183–2200. - PMC - PubMed
    1. Antonini A, Fagiolini M, & Stryker MP (1999). Anatomical correlates of functional plasticity in mouse visual cortex. The Journal of Neuroscience, 19(11), 4388–4406. - PMC - PubMed
    1. Boyd J, & Matsubara J (1994). Tangential organization of callosal connectivity in the cat’s visual cortex. The Journal of Comparative Neurology, 347(2), 197–210. - PubMed

Publication types

LinkOut - more resources