. 2021 Jul;69(7):1679-1693.
doi: 10.1002/glia.23983. Epub 2021 Mar 8.

Reproducing diabetic retinopathy features using newly developed human induced-pluripotent stem cell-derived retinal Müller glial cells

Affiliations

Reproducing diabetic retinopathy features using newly developed human induced-pluripotent stem cell-derived retinal Müller glial cells

Aude Couturier et al. Glia. 2021 Jul.

Abstract

Muller glial cells (MGCs) are responsible for the homeostatic and metabolic support of the retina. Despite the importance of MGCs in retinal disorders, reliable and accessible human cell sources to be used to model MGC-associated diseases are lacking. Although primary human MGCs (pMGCs) can be purified from post-mortem retinal tissues, the donor scarcity limits their use. To overcome this problem, we developed a protocol to generate and bank human induced pluripotent stem cell-derived MGCs (hiMGCs). Using a transcriptome analysis, we showed that the three genetically independent hiMGCs generated were homogeneous and showed phenotypic characteristics and transcriptomic profile of pMGCs. These cells expressed key MGC markers, including Vimentin, CLU, DKK3, SOX9, SOX2, S100A16, ITGB1, and CD44 and could be cultured up to passage 8. Under our culture conditions, hiMGCs and pMGCs expressed low transcript levels of RLPB1, AQP4, KCNJ1, KCJN10, and SLC1A3. Using a disease modeling approach, we showed that hiMGCs could be used to model the features of diabetic retinopathy (DR)-associated dyslipidemia. Indeed, palmitate, a major free fatty acid with elevated plasma levels in diabetic patients, induced the expression of inflammatory cytokines found in the ocular fluid of DR patients such as CXCL8 (IL-8) and ANGPTL4. Moreover, the analysis of palmitate-treated hiMGC secretome showed an upregulation of proangiogenic factors strongly related to DR, including ANG2, Endoglin, IL-1β, CXCL8, MMP-9, PDGF-AA, and VEGF. Thus, hiMGCs could be an alternative to pMGCs and an extremely valuable tool to help to understand and model glial cell involvement in retinal disorders, including DR.

Keywords: Muller glial cells; diabetes; disease modeling; dyslipidemia; iPSC; retinopathy; stem cells.


Conflict of interest statement

OG, J‐AS, and SR are inventors on pending patents related to generation of retinal cells from human pluripotent stem cells.

Figures

FIGURE 1
FIGURE 1
Generation and characterization of hiMGCs. (a) Schematic representation of RO generation and maturation. (b) Representative micrographs of the immunohistochemical detection of the following MGC makers: GS, SOX9 SOX2, and VIM in cryostated ROs at D245 (hiPSC clone AHF1pi2) showing the presence of MGCs in ROs. (c) Schematic representation of hiMGC selection, banking, and amplification. hiMGCs at P4 were used for palmitate‐based assays. (d) Representative micrographs of the immunohistochemical detection of the following MGC markers: SOX9 and VIM (left), SOX9 and GS (middle), and GFAP and VIM (right) P4 hiMGCs (top panels) and pMGCs (bottom panels) showing that the immunohistochemical labeling of MGC markers was similar between hiMGCs at P4 and pMGCs. Nuclei were stained with DAPI. GS, glutamine synthetase; hiMGCs, human iPSC‐derived MGCs; hiPSC, human induced‐pluripotent stem cell; MGC, Muller glial cell; pMGCs, primary MGCs; P, passage; PA, palmitate; RO, retinal organoid; VIM, vimentin. Scale bar = 50 μm [Color figure can be viewed at wileyonlinelibrary.com]
FIGURE 2
FIGURE 2
The gene expression profile of hiMGCs is very close to that of pMGCs. (a) PCA of normalized counts of three iPSCs (blue dots), three pMGCs (red dots), and three hiMGCs (green dots). The first two PC revealed that iPSCs, pMGCs, and hiMGCs clustered in three highly homogeneous cell populations. PC1 allowed differentiating hiPSCs from pMGCs and hiMGCs and PC2 allowed differentiating pMGCs from hiMGCs. (b) Heatmap representation of TPM values of the 5,841 genes with an expression level >40 TPM in pMGCs, hiMGCs and hiPSCs. Genes were ranked according to their expression level in pMGCs. In line with the PCA, the overall log2 (TPM + 1) expression profile of hiMGCs was similar to that of pMGCs while the log2 (TPM + 1) expression profile of hiPSCs highly differed. (c) Heatmap representation of the expression level of neuronal, glial and microglial markers in pMGCs and hiMGCs. MGC markers, including CLU, GLUL, DKK3, and RLBP1 were similarly expressed in hiMGCs and pMGCs. (d) Heatmap representation of the expression levels in pMGCs and hiMGCs of the 50 genes with the highest AUC enrichment score in hMacroglia. The AUC scores have been determined by Menon et al for the cluster of hMacroglia from a human retina and downloaded from a public repository (GSE137537, GSE137847). All genes were similarly expressed in hiMGCs and pMGCs. (e) Heatmap representation of the expression level of 7 classical MGC markers not found in the 50 genes with the highest AUC in hMacroglia. All genes were similarly expressed in hiMGCs and pMGCs. The expression levels in pMGCs and hiMGCs are expressed in FPKM (to allow comparison with Hoang et al study). AUC, area under the curve; FPKM, fragment per kilobase million; hiPSCs, human induced pluripotent stem cells; hiMGCs, human iPSC‐derived MGCs; hMacroglia, human macroglial cell cluster determined by Menon and al and containing Muller cells and astrocytes; PC, principal component; PCA, principal component analysis; pMGCs, primary MGCs; TPM, transcripts per kilobase million. TPM and FPKM are represented in b, c d and e as their log2 (value +1) to have positive values [Color figure can be viewed at wileyonlinelibrary.com]
FIGURE 3
FIGURE 3
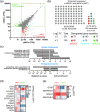
Genes differentially expressed between hiMGCs and pMGCs. (a) Scatter plot of all the transcripts detected in hiMGCs (Y axis) or pMGCs (X axis) with a mean TPM value >40. Grey dots represent genes that were not differentially expressed (DESeq2, p‐value >.05). Colored dots represent genes differentially expressed with a log2 FC ≥2. Green and red dots represent genes only expressed in hiMGCs and pMGCs, respectively. Blue dots represent genes differentially expressed in both groups of cells. (b) Schematic representation of the distribution of the 4,267 genes not differentially expressed (grey dots) or differentially expressed (colored dots) between hiMGCs and pMGCs. Red and hatched red dots represent the 75 and 65 genes differentially expressed (p < .05) found only in pMGCs (Log2 FC ≥2 or <2, respectively). Blue and hatched blue dots represent the 183 and 10 genes differentially expressed (p < .05) found in pMGCs and hiMGCs (log2 FC ≥2 or <2, respectively). Green and hatched green dots represent the 73 and 25 genes differentially expressed (p < .05) found only in hiMGCs (log2 FC ≥2 or <2, respectively). (c) GO enrichment analysis (upper panel, cellular components; lower panel, biological components) of the 100 genes differentially expressed between hiMGCs and pMGCs with a log2 FC ≥2. Left panels represent the Benjamini statistical p‐values for the enrichment test; right panel represents the fold enrichment. Extracellular components were highly represented in the cellular component analysis and the GO term of “extracellular matrix organization” was associated with the highest fold enrichment and the lowest Benjamini p‐values among the biological processes. (Numbers) indicate the total number of transcripts identified for each GO term (d) Heatmap representation of the log2 VST DESeq2 values for the 11 genes differentially expressed involved in the “extracellular matrix organization” in the three pMGCs and the three hiMGCs. (e) Heatmap representation of the log2 TPM expression of four genes differentially expressed found in MGCs from AIR retinas in the three pMGCs and the three hiMGCs. AIR, autoimmune retinitis; hiMGCs, human induced‐pluripotent stem cell‐derived MGCs; pMGCs, primary Müller glial cells; TPM, transcripts per kilobase million; VST, variance stabilizing transformation [Color figure can be viewed at wileyonlinelibrary.com]
FIGURE 4
FIGURE 4
Response of hiMGCs and pMGCs to a DR‐related stress. Gene expression level analyzed by RT‐qPCR after 18 hr of cell incubation with normal or high glucose concentrations  ± palmitic acid. (a) Graph bar representation of the mean (± SEM) relative expression level of ATF3, CXCL8 (IL‐8), CXCL2, and ANGPTL4 in hiMGC‐1 cultured with NG in the presence of increasing PA concentration (0, 5, 250, or 500 μM). Low concentration of PA (5 μM) did not induce any significant changes in the expression level of ATF3, CXCL8, CXCL2, and ANGPTL4 while high concentrations (250 and 500 μM) induced an increase in the expression level of these genes. The expression level represented is the mean of n = 3 independent points. Two tailed Kruskal‐Wallis non‐parametric test (4 groups, 12 values), with p = .0064; p = .0014; p = .0020; p = .0064 followed by Dunn's multiple comparisons tests, * p = .0382; p = .0197; p = .0382; p = .0064, respectively (b) Heatmap representation of the Log2 relative expression level of ATF3, CXCL8 (IL‐8), CXCL2, and ANGPTL4 transcripts in the three pMGCs and the three hiMGCs incubated with NG, HG, NG + PA and HG + PA. The expression of ATF3, CXCL8, CXCL2, and ANGPTL4 was strongly induced in all hiMGCs and pMGCs in response to PA with NG and HG. HG alone did not induce the regulation of these genes in hiMGCs and pMGCs. DR, diabetic retinopathy; HG, high glucose concentration (25 mM); hiMGCs: human iPSC‐derived Müller glial cells; NG, normal glucose concentration (5 mM); pMGCS, primary Müller glial cells; PA, palmitate [Color figure can be viewed at wileyonlinelibrary.com]
FIGURE 5
FIGURE 5
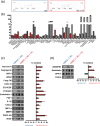
Elevated levels of potent angiogenic factors in the supernatant of hiMGCs treated with palmitate. Semi‐quantitative analysis of the expression level of 55 angiogenic proteins in the supernatant of hiMGCs (hiMGC‐1) treated for 24 hr using an angiogenic blot assay. (a) Representative photography of a blot using the supernatant of hiMGCs treated with NG (left) and NG + PA (right) as a probe. (b) Raw pixel intensity quantification of the 55 proteins found in the supernatant of hiMGCs treated with in NG + PA. Values are expressed in RDU versus membrane background (red bars represent upregulated proteins, blue bars represent downregulated proteins and grey bars represent unregulated proteins compared to the supernatant of hiMGCs cultured with NG). The supernatant of hiMGC‐1 treated for 24 hr with NG + PA contained detectable amounts of 41 angiogenic proteins. (c and d) Graph bar representation of the 20 regulated proteins. Values are expressed in RDU as a percent variation between hiMGCs treated with NG and NG + PA. (c) Regulated pro‐angiogenic proteins (red bars represent the proteins upregulated in the supernatant of hiMGCs treated with NG + PA). (d) Regulated anti‐angiogenic proteins (red bars represent the proteins upregulated in the supernatant of hiMGCs treated with NG + PA, the blue bar represents the protein upregulated in the supernatant of hiMGCs treated with NG). PA regulated 19 angiogenic proteins tested: 16 were proangiogenic and 3 were anti‐angiogenic. Error bars represent the SEM of the duplicate spots, each membrane was incubated with a pool of three independent supernatant. hiMGCs, human iPSC‐derived Müller glial cells; NG, normal glucose concentration (5 mM); PA, palmitate; RDU, relative density units [Color figure can be viewed at wileyonlinelibrary.com]

Similar articles

Cited by

References

    1. Abcouwer, S. F. (2017). Muller cell‐microglia cross talk drives neuroinflammation in diabetic retinopathy. Diabetes, 66(2), 261–263. 10.2337/dbi16-0047 - DOI - PMC - PubMed
    1. ACCORD Study group , ACCORD Eye Study Group , Chew, E. Y. , Ambrosius, W. T. , Davis, M. D. , Danis, R. P. , … Fine, L. J. (2010). Effects of medical therapies on retinopathy progression in type 2 diabetes. The New England Journal of Medicine, 363(3), 233–244. 10.1056/NEJMoa1001288 - DOI - PMC - PubMed
    1. Ahn, J. , Han, S. , Ahn, S. M. , Kim, S. W. , & Oh, J. (2020). Clinical implications of suspended scattering particles in motion observed by optical coherence tomography angiography. Scientific Reports, 10(1), 15. 10.1038/s41598-019-55606-9 - DOI - PMC - PubMed
    1. Babapoor‐Farrokhran, S. , Jee, K. , Puchner, B. , Hassan, S. J. , Xin, X. , Rodrigues, M. , … Sodhi, A. (2015). Angiopoietin‐like 4 is a potent angiogenic factor and a novel therapeutic target for patients with proliferative diabetic retinopathy. Proceedings of the National Academy of Sciences of the United States of America, 112(23), E3030–E3039. 10.1073/pnas.1423765112 - DOI - PMC - PubMed
    1. Bromberg‐White, J. L. , Glazer, L. , Downer, R. , Furge, K. , Boguslawski, E. , & Duesbery, N. S. (2013). Identification of VEGF‐independent cytokines in proliferative diabetic retinopathy vitreous. Investigative Ophthalmology & Visual Science, 54(10), 6472–6480. 10.1167/iovs.13-12518 - DOI - PubMed

Publication types