. 2021 Mar 8:10:e61869.
doi: 10.7554/eLife.61869.

Opposing effects of T cell receptor signal strength on CD4 T cells responding to acute versus chronic viral infection

Affiliations

Opposing effects of T cell receptor signal strength on CD4 T cells responding to acute versus chronic viral infection

Marco Künzli et al. Elife. .

Abstract

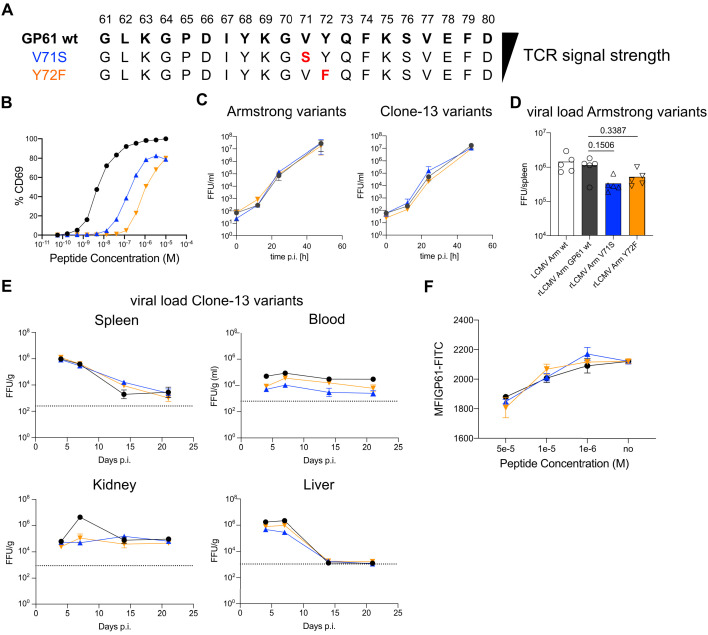
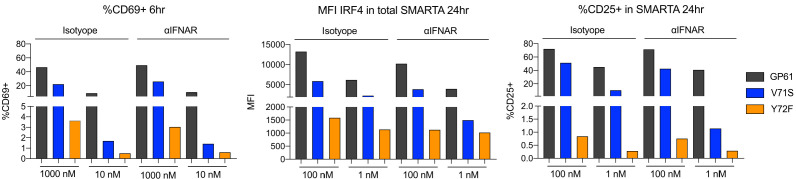
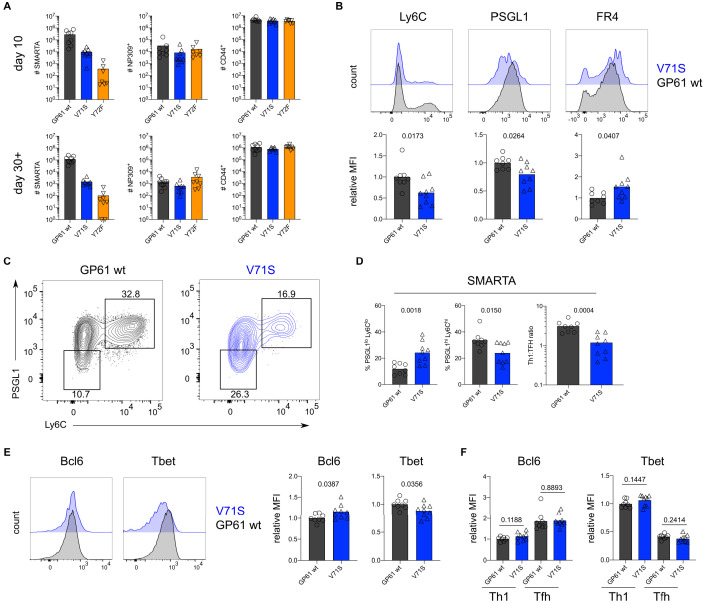
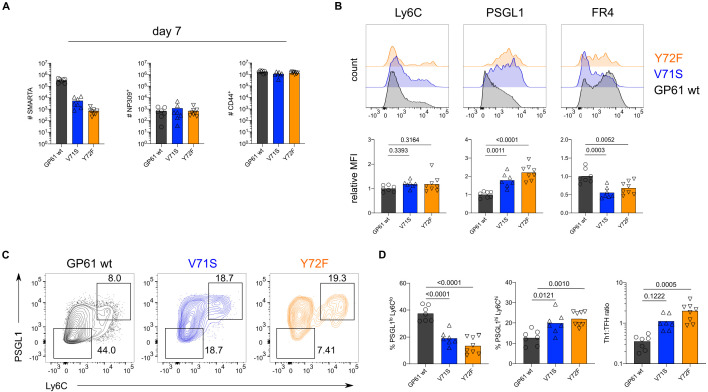
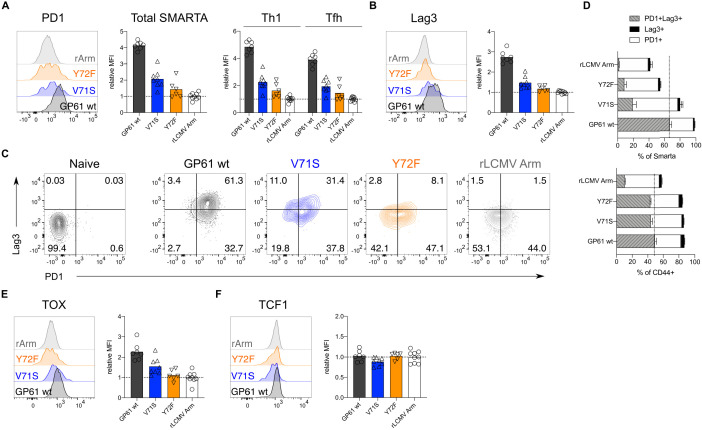
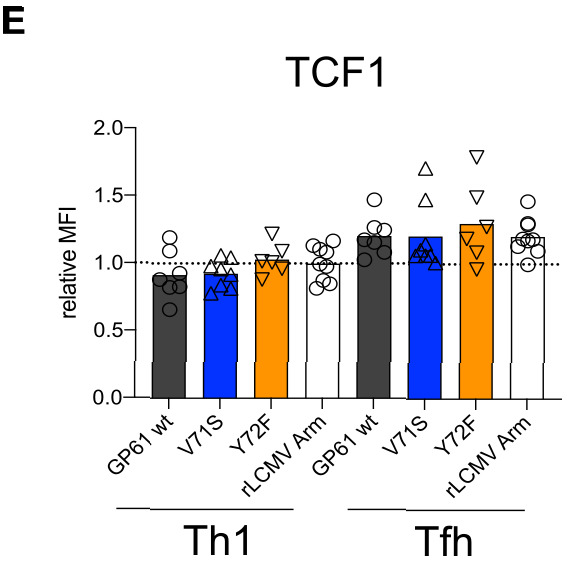
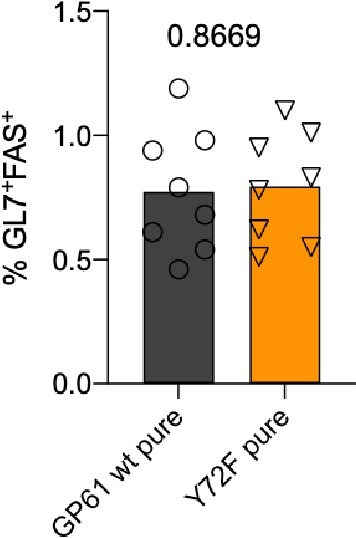
A hallmark of adaptive immunity is CD4 T cells' ability to differentiate into specialized effectors. A long-standing question is whether T cell receptor (TCR) signal strength can dominantly instruct the development of Th1 and T follicular helper (Tfh) cells across distinct infectious contexts. We characterized the differentiation of murine CD4 TCR transgenic T cells responding to altered peptide ligand lymphocytic choriomeningitis viruses (LCMV) derived from acute and chronic parental strains. We found that TCR signal strength exerts opposite and hierarchical effects on the balance of Th1 and Tfh cells responding to acute versus persistent infection. TCR signal strength correlates positively with Th1 generation during acute but negatively during chronic infection. Weakly activated T cells express lower levels of markers associated with chronic T cell stimulation and may resist functional inactivation. We anticipate that the panel of recombinant viruses described herein will be valuable for investigating a wide range of CD4 T cell responses.

Keywords: CD4 T cell; T cell differentiation; T cell exhaustion; T cell receptor signal; chronic infection; immunology; infection; inflammation; mouse.


Conflict of interest statement

MK, PR, CK No competing interests declared, DP a founder, consultant and shareholder of Hookipa Pharma Inc. commercializing arenavirus-based vector technology, and he is listed as inventor on corresponding patents (Replication-defective arenavirus vectors, WO 2009/083210; Anti-mycobacterial vaccines. PCT-Patent Application No. PCT/EP14/055144; Tri-segmented arenaviruses as vaccine vectors. PCT/EP2015/076458; Tri-segmented Pichinde viruses as vaccine vectors, WO 2017/198726).

Figures

Figure 1.
Figure 1.. Generation and viral fitness of GP61 lymphocytic choriomeningitis virus (LCMV) variants.
(A) Scheme of GP61 wt and altered peptide ligand (APL) sequences with mutations highlighted in red ordered hierarchically according to T cell receptor (TCR) signal strength. (B) Peptide dose–activation curves of overnight cultured SMARTA cells with peptide pulsed splenocytes using the percentage of CD69+ SMARTA cells as a readout for activation. EC50 values are ~5 nM for GP61 wt, ~0.1 µM for V71S, and ~1 µM for Y72F. (C) In vitro growth kinetics depicting the viral load in the culture medium (focus forming units [FFU]/ml) of GP61 wt or V71S and Y72F variants of Armstrong (left) and Clone-13 (right) variant infection on BHK21 cells over time. Data are displayed as mean ± SD. (D) Early splenic viral load day 3 post infection (p.i.) in Armstrong variants. Bars represent the mean and symbols represent individual mice. (E) Viral load (FFU) in indicated organs per gram tissue over time in C57BL/6 mice. The dotted line represents the limit of detection. Data are displayed as mean ± SEM of 7–10 samples. (F) Peptide dose–response curves depicting the out-competition of the GP61 FITC signal by unlabeled GP61 wt or APLs on B220+ B cells. Data are displayed as mean ± SD of two to three technical replicates. Data represent one of n = 2 independent experiments (B, D, F) or pooled data from n = 2 independent experiments (C, E).
Figure 1—figure supplement 1.
Figure 1—figure supplement 1.. GP61 altered peptide ligand (APL) screening.
Peptide dose–activation curves of overnight cultured SMARTA cells with peptide pulsed splenocytes using the percentage of CD69+ SMARTA cells as a readout for activation. Data represent one of n = 2 independent experiments.
Figure 1—figure supplement 2.
Figure 1—figure supplement 2.. Interferon (IFN) type-I signaling exerts minor effects on the expression of activation markers in vitro.
Naïve SMARTA T cells were cultured in the presence of splenocytes and various concentrations of GP61 wt and altered peptide ligands (APLs). Proportion of CD69+ SMARTA cells 6 hr after stimulation (left), mean fluorescence intensity (MFI) of IRF4 (middle), and % of CD25+ SMARTA cells 24 hr after stimulation in the presence of anti-IFNAR antibody or isotype control (right). Data are representative of n = 2 independent experiments.
Figure 1—figure supplement 3.
Figure 1—figure supplement 3.. Viral load in organs and blood of DBA/2 mice.
Viral load (focus forming units [FFU]) in indicated organs per gram tissue 21 days post infection and in blood over time in DBA/2 mice. Data points represent the mean ± SEM of 4–10 samples pooled from n = 1–2 independent experiments. The dotted line represents the limit of detection.
Figure 2.
Figure 2.. T cell receptor (TCR) signal strength positively correlates with Th1 cell differentiation during lymphocytic choriomeningitis virus (LCMV) Armstrong variant infection.
(A) Number of SMARTA (left), NP309+ (middle), and CD44+ cells (right) 10 days (top) or >30 days (bottom) post infection (p.i.). (B) Histograms (top) and relative mean fluorescence intensity (MFI) (bottom) of indicated phenotypic markers in the SMARTA compartment 10 days p.i. (C) Identification of Th1 (Ly6ChiPSGL1hi) and T follicular helper (Tfh) (Ly6CloPSGL1lo) subset in the SMARTA compartment by flow cytometry 10 days p.i. (D) Proportion of Tfh (left), Th1 cells (middle), and the Th1:Tfh ratio (right) of the SMARTA compartment 10 days p.i. (E) Histograms (left) and relative MFI (right) of Bcl6 and Tbet expression in the SMARTA compartment 10 days p.i. (F) Bcl6 and Tbet MFI in SMARTA Th1 and Tfh subsets. Data are pooled from n = 2 independent experiments with seven to nine samples per group. Bars represent the mean and symbols represent individual mice. Significance was determined by unpaired two-tailed Student’s t-tests.
Figure 2—figure supplement 1.
Figure 2—figure supplement 1.. SMARTA cell numbers 4 days post infection (p.i.).
Number of SMARTA (left) and CD44+ cells (right) 4 days p.i. Data are pooled from n = 2 independent experiments with seven to eight samples per group. Bars represent the mean and symbols represent individual mice.
Figure 2—figure supplement 2.
Figure 2—figure supplement 2.. T cell receptor (TCR) signal strength positively correlates with early Th1 cell differentiation during lymphocytic choriomeningitis virus (LCMV) Armstrong variant infection.
Histograms (left) and proportion of CD25+ SMARTA T cells (right) 4 days post infection (p.i.). Data are pooled from n = 2 independent experiments with seven to eight samples per group. Bars represent the mean and symbols represent individual mice. Significance was determined by unpaired two-tailed Student’s t-tests.
Figure 2—figure supplement 3.
Figure 2—figure supplement 3.. Germinal center B cell differentiation 4 days post infection (p.i.) is unaffected by lymphocytic choriomeningitis virus (LCMV) Armstrong variant infection.
Identification (left), proportion (middle), and quantification (right) of GL7+FAS+ B cells 4 days p.i. Data are pooled from n = 2 independent experiments with seven to eight samples per group. Bars represent the mean and symbols represent individual mice. Significance was determined by unpaired two-tailed Student’s t-tests.
Figure 2—figure supplement 4.
Figure 2—figure supplement 4.. The endogenous nucleoprotein (NP)-specific CD4 response is unaffected by lymphocytic choriomeningitis virus (LCMV) Armstrong variant infection.
Proportion of T follicular helper (Tfh) (left), Th1 cells (middle), and the Th1:Tfh ratio (right) of the NP309+ compartment 10 days post infection (p.i.). Data are pooled from n = 2 independent experiments with eight to nine samples per group. Bars represent the mean and symbols represent individual mice. Significance was determined by unpaired two-tailed Student’s t-tests.
Figure 2—figure supplement 5.
Figure 2—figure supplement 5.. Alternative gating strategy to identify SMARTA T follicular helper (Tfh) cells.
Identification and proportion of PD1hi FR4hi Tfh cells in the SMARTA compartment by flow cytometry. Data are pooled from n = 2 independent experiments with eight to nine samples per group. Bars represent the mean and symbols represent individual mice. Significance was determined by unpaired two-tailed Student’s t-tests.
Figure 2—figure supplement 6.
Figure 2—figure supplement 6.. T cell receptor (TCR) signal strength does not impact Bcl6 and Tbet expression in Ly6Clo Th1 SMARTA cells.
Relative mean fluorescence intensity (MFI) of Bcl6 and Tbet expression in the Ly6Clo Th1 SMARTA compartment. Data are pooled from n = 2 independent experiments with eight to nine samples per group. Bars represent the mean and symbols represent individual mice. Significance was determined by unpaired two-tailed Student’s t-tests.
Figure 2—figure supplement 7.
Figure 2—figure supplement 7.. T cell receptor (TCR) signal strength does not impact the generation of Ly6Clo Th1 SMARTA cells.
Identification and proportion of Ly6Clo Th1 (Ly6CloPSGL1hi) in the SMARTA compartment by flow cytometry. Data are pooled from n = 2 independent experiments with eight to nine samples per group. Bars represent the mean and symbols represent individual mice. Significance was determined by unpaired two-tailed Student’s t-tests.
Figure 3.
Figure 3.. T cell receptor (TCR) signal strength positively correlates with T follicular helper (Tfh) cell differentiation during lymphocytic choriomeningitis virus (LCMV) Clone-13 variant infection. Spleens were harvested 7 days after infection with LCMV Clone-13 variants.
(A) Number of SMARTA (left), NP309+ (middle), and CD44+ cells (right). (B) Histograms (top) and relative mean fluorescence intensity (MFI) (bottom) of indicated phenotypic markers in the SMARTA compartment. (C) Identification of Th1 (Ly6ChiPSGL1hi) and Tfh (Ly6CloPSGL1lo) subset in the SMARTA compartment by flow cytometry. (D) Proportion of Tfh (left), Th1 cells (middle), and the Th1:Tfh ratio (right) of the SMARTA compartment. Data are pooled from n = 2 independent experiments with seven to eight samples per group. Bars represent the mean and symbols represent individual mice. Significance was determined by one-way ANOVA followed by Tukey’s post-test.
Figure 3—figure supplement 1.
Figure 3—figure supplement 1.. Lymphocytic choriomeningitis virus (LCMV) Armstrong and Clone-13 infection induce similar expansion of CD4 compartments.
Spleens were harvested 7 days after infection with LCMV Clone-13 variants. (A) Number of SMARTA (left), NP309+ (middle), and CD44+ cells (right). Data are pooled from n = 2 independent experiments with seven to eight samples per group. Bars represent the mean and symbols represent individual mice.
Figure 3—figure supplement 2.
Figure 3—figure supplement 2.. Lymphocytic choriomeningitis virus (LCMV) Clone-13 infection results in a T follicular helper (Tfh)-based differentiation of SMARTA cells.
Spleens were harvested 7 days after infection with LCMV Clone-13 variants. (Left panel) Identification of Th1 (Ly6ChiPSGL1hi) and Tfh (Ly6CloPSGL1lo) subset in the SMARTA compartment by flow cytometry. (Right panel) Proportion of Tfh (left), Th1 cells (middle), and the Th1:Tfh ratio (right) of the SMARTA compartment. Data are pooled from n = 2 independent experiments with seven to eight samples per group. Bars represent the mean and symbols represent individual mice. Significance was determined by one-way ANOVA followed by Tukey’s post-test.
Figure 3—figure supplement 3.
Figure 3—figure supplement 3.. T cell receptor (TCR) signal strength negatively correlates with Ly6Clo Th1 differentiation during lymphocytic choriomeningitis virus (LCMV) Clone-13 variant infection.
Spleens were harvested 7 days after infection with LCMV Clone-13 variants. Identification and proportion of Ly6Clo Th1 (Ly6CloPSGL1hi) in the SMARTA compartment by flow cytometry. Data are pooled from n = 2 independent experiments with seven to eight samples per group. Bars represent the mean and symbols represent individual mice. Significance was determined by one-way ANOVA followed by Tukey’s post-test.
Figure 3—figure supplement 4.
Figure 3—figure supplement 4.. High viral load in kidneys 7 days post infection in all three viruses.
Viral load in kidneys (FFU/g) 7 days post infection. Data represent one of n = 2 independent experiments with four samples per group. Bars represent the mean and symbols represent individual mice.
Figure 3—figure supplement 5.
Figure 3—figure supplement 5.. The endogenous nucleoprotein (NP)-specific CD4 response is unaffected by lymphocytic choriomeningitis virus (LCMV) Clone-13 variant infection.
Spleens were harvested 7 days after infection with LCMV Clone-13 variants. Proportion of T follicular helper (Tfh) (left), Th1 cells (middle), and the Th1:Tfh ratio (right) of the NP309+ compartment. Data are pooled from n = 2 independent experiments with seven to eight samples per group. Bars represent the mean and symbols represent individual mice. Significance was determined by one-way ANOVA followed by Tukey’s post-test.
Figure 3—figure supplement 6.
Figure 3—figure supplement 6.. SMARTA cell numbers 4 and 14 days post infection (p.i.).
Number of SMARTA cells at day 4 (left) and 14 (right) p.i. Data are pooled from n = 2 independent experiments with six to nine samples per group. Bars represent the mean and symbols represent individual mice.
Figure 3—figure supplement 7.
Figure 3—figure supplement 7.. T cell receptor (TCR) signal strength negatively correlates with early Th1 cell differentiation during lymphocytic choriomeningitis virus (LCMV) Clone-13 variant infection.
Histograms and proportion of CD25+ SMARTA T cells (far left and left) or Ly6C+ cells (right and far right) 4 days post infection. Data are pooled from n = 2 independent experiments with seven to nine samples per group. Bars represent the mean and symbols represent individual mice. Significance was determined by one-way ANOVA followed by Tukey’s post-test.
Figure 3—figure supplement 8.
Figure 3—figure supplement 8.. Th1 bias is maintained in Clone-13 variants 14 days post infection (p.i.).
Identification and proportion of Th1 (Ly6ChiPSGL1hi) and T follicular helper (Tfh) (Ly6CloPSGL1lo) subset and Th1:Tfh ratio in the SMARTA compartment 14 days p.i. Data are pooled from n = 2 independent experiments with six to eight samples per group. Bars represent the mean and symbols represent individual mice. Significance was determined by one-way ANOVA followed by Tukey’s post-test.
Figure 3—figure supplement 9.
Figure 3—figure supplement 9.. Germinal center B cell differentiation is unaffected by lymphocytic choriomeningitis virus (LCMV) Clone-13 variant infection.
Identification (left), proportion (middle), and quantification (right) of GL7+FAS+ B cells 4 days post infection (p.i.) (top row) or 14 days p.i. (bottom row). Cells are pregated for B220+dump-. Data are pooled from n = 2 independent experiments with six to eight samples per group. Bars represent the mean and symbols represent individual mice. Significance was determined by one-way ANOVA followed by Tukey’s post-test.
Figure 3—figure supplement 10.
Figure 3—figure supplement 10.. Antigen load exerts different effects on strongly versus weakly activated SMARTA T cells.
(Left) Experimental setup. Number of SMARTA cells (middle) and proportion of Th1 (Ly6ChiPSGL1hi) and T follicular helper (Tfh) (Ly6CloPSGL1lo) subset and Th1:Tfh ratio in the SMARTA compartment (right) from the spleen 7 days post infection. Data are pooled from n = 2 independent experiments with eight to nine samples per group. Bars represent the mean and symbols represent individual mice. Significance was determined by unpaired two-tailed Student’s t-tests.
Figure 4.
Figure 4.. Increased T cell receptor (TCR) signal strength induces expression of markers associated with chronic T cell stimulation. Spleens were harvested 14 days after infection with lymphocytic choriomeningitis virus (LCMV) Clone-13-based variants.
(A) Histograms (left) and relative mean fluorescence intensity (MFI) (right) of PD1 in the total SMARTA compartment (left) or SMARTA Th1 and T follicular helper (Tfh) subsets (right). (B) Histograms (left) and relative MFI (right) of Lag3 in the SMARTA compartment. (C) Identification of PD1+Lag3+ SMARTA cells by flow cytometry compared to naïve CD62L+ CD44 CD4 T cells from an uninfected mouse. (D) Quantification of PD1+Lag3+ SMARTA cells in the SMARTA (top) or CD44+ (bottom) compartment. (E) Histogram (left) and relative MFI (right) of TOX in the SMARTA compartment. (F) Histogram (left) and relative MFI (right) of TCF1 in the SMARTA compartment. Data are pooled from n = 2 independent experiments with six to nine samples per group. Bars represent the mean and symbols represent individual mice. Significance was determined by one-way ANOVA followed by Tukey’s post-test.
Figure 4—figure supplement 1.
Figure 4—figure supplement 1.. Viral load in kidneys 14 days post infection.
Viral load in kidneys (FFU/kidney) 14 days post infection. Data represents one of n = 2 independent experiments with four to five samples per group. Bars represent the mean and symbols represent individual mice.
Figure 4—figure supplement 2.
Figure 4—figure supplement 2.. Similar activation marker expression of CD4+ CD44+ T cells across all viruses.
Spleens were harvested 14 days after infection with lymphocytic choriomeningitis virus (LCMV) Clone-13-based variants. Relative mean fluorescence intensity (MFI) (right) of PD1 and Lag3 in the CD44+ compartment. Data are pooled from n = 2 independent experiments with six to nine samples per group. Bars represent the mean and symbols represent individual mice.
Figure 4—figure supplement 3.
Figure 4—figure supplement 3.. T cell receptor (TCR) signal strength impacts TOX expression in SMARTA Th1 and T follicular helper (Tfh) compartments.
Spleens were harvested 14 days after infection with lymphocytic choriomeningitis virus (LCMV) Clone-13-based variants. Relative mean fluorescence intensity (MFI) of TOX in SMARTA Th1 and Tfh. Data are pooled from n = 2 independent experiments with six to nine samples per group. Symbols represent individual mice. Significance was determined by paired two-tailed Student’s t-tests.
Figure 4—figure supplement 4.
Figure 4—figure supplement 4.. TOX expression is not affected in CD44+ CD4+ T cells by lymphocytic choriomeningitis virus (LCMV) Clone-13 variant infection.
Spleens were harvested 14 days after infection with LCMV Clone-13-based variants. Relative mean fluorescence intensity (MFI) (right) of TOX in the CD44+ compartment. Data are pooled from n = 2 independent experiments with six to nine samples per group. Bars represent the mean and symbols represent individual mice.
Figure 4—figure supplement 5.
Figure 4—figure supplement 5.. T cell receptor (TCR) signal strength does not impact TCF1 expression.
Spleens were harvested 14 days after infection with lymphocytic choriomeningitis virus (LCMV) Clone-13-based variants. Relative mean fluorescence intensity (MFI) of TCF1 in the SMARTA Th1 and T follicular helper (Tfh) subsets. Data are pooled from n = 2 independent experiments with six to nine samples per group. Bars represent the mean and symbols represent individual mice.
Author response image 1.
Author response image 1.. Germinal center B cell differentiation 7 days post LCMV Clone-13 variant infection.
Proportion and numbers of GL7+FAS+ B cells 7 days p.i. Data are pooled from n = 2 independent experiments with 8 samples per group. Bars represent the mean and symbols represent individual mice. Significance was determined by unpaired two-tailed Student’s t-tests.

References

    1. Alfei F, Kanev K, Hofmann M, Wu M, Ghoneim HE, Roelli P, Utzschneider DT, von Hoesslin M, Cullen JG, Fan Y, Eisenberg V, Wohlleber D, Steiger K, Merkler D, Delorenzi M, Knolle PA, Cohen CJ, Thimme R, Youngblood B, Zehn D. TOX reinforces the phenotype and longevity of exhausted T cells in chronic viral infection. Nature. 2019;571:265–269. doi: 10.1038/s41586-019-1326-9. - DOI - PubMed
    1. Allison KA, Sajti E, Collier JG, Gosselin D, Troutman TD, Stone EL, Hedrick SM, Glass CK. Affinity and dose of TCR engagement yield proportional enhancer and gene activity in CD4+ T cells. eLife. 2016;5:e10134. doi: 10.7554/eLife.10134. - DOI - PMC - PubMed
    1. Andargachew R, Martinez RJ, Kolawole EM, Evavold BD. CD4 T cell affinity diversity is equally maintained during acute and chronic infection. The Journal of Immunology. 2018;201:19–30. doi: 10.4049/jimmunol.1800295. - DOI - PMC - PubMed
    1. Battegay M. Quantification of lymphocytic choriomeningitis virus with an immunological focus assay in 24 well plates] Altex. 1993;10:6–14. doi: 10.1016/0166-0934(91)90018-U. - DOI - PubMed
    1. Bergthaler A, Merkler D, Horvath E, Bestmann L, Pinschewer DD. Contributions of the lymphocytic choriomeningitis virus glycoprotein and polymerase to strain-specific differences in murine liver pathogenicity. Journal of General Virology. 2007;88:592–603. doi: 10.1099/vir.0.82428-0. - DOI - PubMed

Publication types

MeSH terms

Substances

LinkOut - more resources