. 2021 Mar 8;17(3):e1008825.
doi: 10.1371/journal.pcbi.1008825. eCollection 2021 Mar.

A computational study of co-inhibitory immune complex assembly at the interface between T cells and antigen presenting cells

Affiliations

A computational study of co-inhibitory immune complex assembly at the interface between T cells and antigen presenting cells

Zhaoqian Su et al. PLoS Comput Biol. .

Abstract

The activation and differentiation of T-cells are mainly directly by their co-regulatory receptors. T lymphocyte-associated protein-4 (CTLA-4) and programed cell death-1 (PD-1) are two of the most important co-regulatory receptors. Binding of PD-1 and CTLA-4 with their corresponding ligands programed cell death-ligand 1 (PD-L1) and B7 on the antigen presenting cells (APC) activates two central co-inhibitory signaling pathways to suppress T cell functions. Interestingly, recent experiments have identified a new cis-interaction between PD-L1 and B7, suggesting that a crosstalk exists between two co-inhibitory receptors and the two pairs of ligand-receptor complexes can undergo dynamic oligomerization. Inspired by these experimental evidences, we developed a coarse-grained model to characterize the assembling of an immune complex consisting of CLTA-4, B7, PD-L1 and PD-1. These four proteins and their interactions form a small network motif. The temporal dynamics and spatial pattern formation of this network was simulated by a diffusion-reaction algorithm. Our simulation method incorporates the membrane confinement of cell surface proteins and geometric arrangement of different binding interfaces between these proteins. A wide range of binding constants was tested for the interactions involved in the network. Interestingly, we show that the CTLA-4/B7 ligand-receptor complexes can first form linear oligomers, while these oligomers further align together into two-dimensional clusters. Similar phenomenon has also been observed in other systems of cell surface proteins. Our test results further indicate that both co-inhibitory signaling pathways activated by B7 and PD-L1 can be down-regulated by the new cis-interaction between these two ligands, consistent with previous experimental evidences. Finally, the simulations also suggest that the dynamic and the spatial properties of the immune complex assembly are highly determined by the energetics of molecular interactions in the network. Our study, therefore, brings new insights to the co-regulatory mechanisms of T cell activation.


Conflict of interest statement

The authors have declared that no competing interests exist.

Figures

Fig 1
Fig 1. A simple network motif of T cell coregulation is used as a test system to study immune complex assembly.
In specific, four proteins are involved in the network. Their interactions are shown in (A). These receptors and ligands contain different types of binding interfaces and are located at the interface between T cell and antigen presenting cell (APC), as described by our coarse-grained model (B). Based on this model representation, a diffusion-reaction algorithm is applied to simulate the system. The simulation starts from an initial configuration, the top view of which is illustrated in (C). CTLA-4 is shown in green, B7 is shown in red, PD-L1 is shown in orange, and PD-1 is shown in blue.
Fig 2
Fig 2. We started our simulations from a simple system which only contains receptor CTLA-4 and its ligand B7.
The kinetics profiles of protein-protein interactions in an initial test are plotted in (A) as a function of simulation time. Some representative snapshots were selected along the simulation trajectory. The same color code and representation are used as before. The initial configuration is shown in (B). The simulation shows that small linear oligomers (C) can grow into two-dimensional clusters (D). These small clusters finally merged into a single large cluster (E). The close-up view of a linear oligomer and a two-dimensional cluster are further plotted in (F) and (G), respectively.
Fig 3
Fig 3. We systematically changed the binding affinities in both CTLA-4/B7 trans-interactions and B7 homo-dimerization from 0 to -13kT.
The contours in the two-dimensional heat maps indicate the number of CTLA-4/B7 trans-interactions (A) and the number of B7-B7 dimers (B), respectively. Detailed color indices are listed on the right-hand sides of each map. The x and y axes represent the values of two binding affinities. The final configurations from some representative areas in the contour maps were selected. The configuration corresponding to the black arrows in the maps is shown in (C). The configuration corresponding to the while arrows in the maps is shown in (D). The configuration corresponding to the red arrows in the maps is shown in (E). Finally, the configuration corresponding to the blue arrows in the maps is shown in (F).
Fig 4
Fig 4. In addition to CTLA-4 and B7, we further introduced PD-L1 into the simulation system.
We systematically changed the surface density of PD-L1 and the binding affinity of its cis-interaction with B7. The tested results are summarized as two-dimensional heat maps. The contours in the maps indicate the number of PD-L1/B7 cis-interactions (A), the number of B7-B7 dimers (B) and the number of CTLA-4/B7 trans-interactions (C), respectively. Detailed color indices are listed on the right-hand sides of each map. The x axis represents the values of cis-binding affinity, and the y axis indicates the number of PD-L1 on the APC surface.
Fig 5
Fig 5. The kinetic profiles are compared between two selected systems.
The changes of B7/PD-L1 cis-interactions as a function of simulation time were plotted in (A). The changes of B7 dimers as a function of simulation time were plotted in (B). The changes of CTLA-4/B7 trans-interactions as a function of simulation time were plotted in (C). The system with strong cis-binding affinity of -13kT is represented by red curves, while the system with weak cis-binding affinity of -3kT is represented by black curves. Finally, the final configurations from these two comparing systems were plotted. The configuration with strong affinity is shown in (D) and the configuration with weak affinity is shown in (E), respectively.
Fig 6
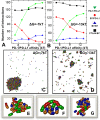
Fig 6. The dynamics of the system with all four proteins in the network was simulated.
We changed the binding affinities of the PD-1/PD-L1 trans-interactions in two scenarios. In the first scenario, moderate binding affinities of -7kT were assigned to all the other interaction, while strong affinities of -13kT were assigned to all the other interactions in the second scenario. The numbers of all types of interactions obtained under different values of PD-1/PD-L1 trans-interactions are plotted in (A) and (B) for the first and second scenarios, respectively. Final configurations from these two scenarios were also plotted in (C) and (D). Detailed structure of three clusters formed along the simulation trajectories are displayed in (E), (F) and (G).
Fig 7
Fig 7. We have performed a computational experiment in the cis-interactions between B7 and PD-L1 was turn on and off in two separate simulation scenarios.
We collected the numbers of different interactions along the last 2×10⁶ns of both simulation trajectories. Their distributions are compared with each other as box-whisker plots in (A), (B), (C), and (D). The boxes in these plots give the range from 25 to 75 percentiles for the number of interactions, while their average number of interactions is marked in the middle of each box. The whisker indicates the outlier of the distribution with the coefficient equal 1.5. The type of interactions is indicated on top of each plot. The system with cis-interaction (WT) is shown by green boxes, while the system without cis-interaction (MT) is shown by red boxes. Finally, the close-up view of the largest cluster formed in the final configuration of the MT scenario is shown in (E), and the close-up view of the largest cluster formed in the final configuration of the WT scenario is shown in (F).

Similar articles

Cited by

References

    1. Huang J, Meyer C, Zhu C. T cell antigen recognition at the cell membrane. Molecular immunology. 2012;52(3–4):155–64. Epub 2012/06/12. 10.1016/j.molimm.2012.05.004 - DOI - PMC - PubMed
    1. Chen L, Flies DB. Molecular mechanisms of T cell co-stimulation and co-inhibition. Nature reviews Immunology. 2013;13(4):227–42. Epub 2013/03/09. 10.1038/nri3405 - DOI - PMC - PubMed
    1. Buchbinder EI, Desai A. CTLA-4 and PD-1 Pathways: Similarities, Differences, and Implications of Their Inhibition. American journal of clinical oncology. 2016;39(1):98–106. Epub 2015/11/13. 10.1097/COC.0000000000000239 - DOI - PMC - PubMed
    1. Ying Z, He T, Wang X, Zheng W, Lin N, Tu M, et al.. Parallel Comparison of 4-1BB or CD28 Co-stimulated CD19-Targeted CAR-T Cells for B Cell Non-Hodgkin’s Lymphoma. Molecular therapy oncolytics. 2019;15:60–8. Epub 2019/10/28. 10.1016/j.omto.2019.08.002 - DOI - PMC - PubMed
    1. Buhlmann JE, Elkin SK, Sharpe AH. A role for the B7-1/B7-2:CD28/CTLA-4 pathway during negative selection. Journal of immunology (Baltimore, Md: 1950). 2003;170(11):5421–8. Epub 2003/05/22. 10.4049/jimmunol.170.11.5421 . - DOI - PubMed

Publication types

MeSH terms