

Variety-seeking, learning and performance
- PMID: 33684105
- PMCID: PMC7939370
- DOI: 10.1371/journal.pone.0247034
Variety-seeking, learning and performance
Abstract
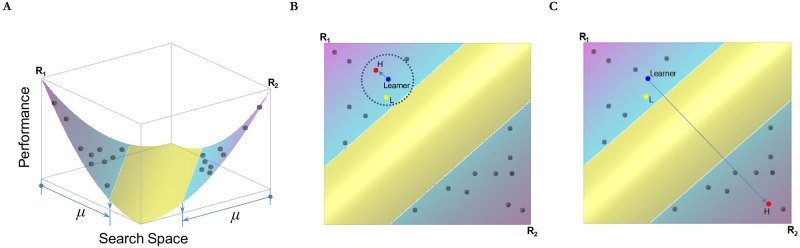
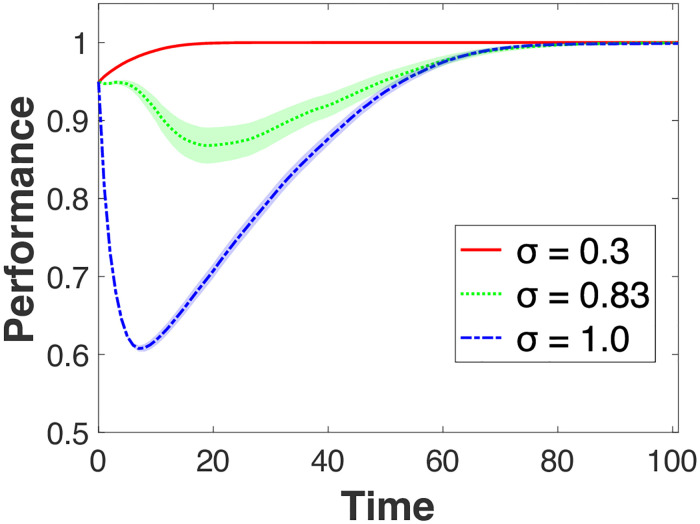
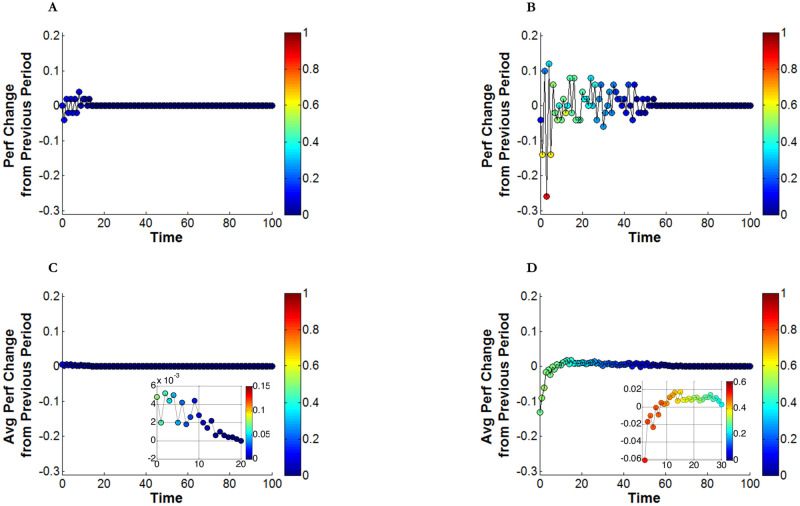
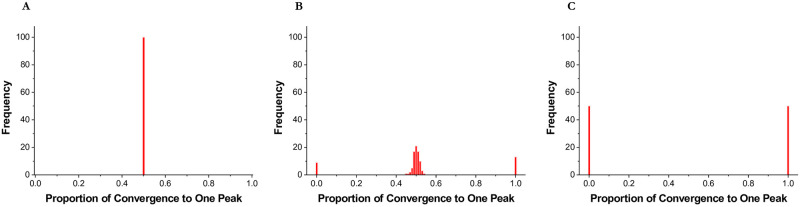
According to the variance hypothesis, variety-seeking or exploration is a critical condition for improving learning and performance over time. Extant computational learning models support this hypothesis by showing how individuals who are exposed to diverse knowledge sources are more likely to find superior solutions to a particular problem. Yet this research provides no precise guidelines about how broadly individuals should search. Our goal in this paper is to elucidate the conditions under which variety-seeking in organizations is beneficial. To this end, we developed a computational model in which individuals learn as they interact with other individuals, and update their knowledge as a result of this interaction. The model reveals how the type of learning environment (performance landscape) in which the learning dynamic unfolds determines when the benefits of variety-seeking outweigh the costs. Variety-seeking is performance-enhancing only when the knowledge of the chosen learning targets (i.e., individuals to learn from) provide useful information about the features of the performance landscape. The results further suggest that superior knowledge might be available locally, i.e., in the proximity of an individual's current location. We also identify the point beyond which variety-seeking causes a sharp performance decline and show how this point depends on the type of landscape in which the learning dynamic unfolds and the degree of specialization of individual knowledge. The presence of this critical point explains why exploration becomes very costly. The implications of our findings for establishing the boundaries of exploration are discussed.
Conflict of interest statement
The authors have declared that no competing interests exist.
Figures
References
-
- Dahlander L, O’Mahony S, Gann DM. One foot in, one foot out: how does individuals’ external search breadth affect innovation outcomes? Strategic Management Journal. 2016;37(2):280–302.
-
- Fang C, Lee J, Schilling MA. Balancing exploration and exploitation through structural design: The isolation of subgroups and organizational learning. Organization Science. 2010;21(3):625–642.
-
- March JG. Exploration and exploitation in organizational learning. Organization science. 1991;2(1):71–87.
-
- Miller KD, Zhao M, Calantone RJ. Adding interpersonal learning and tacit knowledge to March’s exploration-exploitation model. Academy of Management Journal. 2006;49(4):709–722.
-
- Winter SG, Cattani G, Dorsch A. The value of moderate obsession: Insights from a new model of organizational search. Organization Science. 2007;18(3):403–419.
Publication types
MeSH terms
LinkOut - more resources
Full Text Sources
Other Literature Sources
