. 2021 Mar 9;19(1):75.
doi: 10.1186/s12916-021-01948-z.

Quantifying the potential value of antigen-detection rapid diagnostic tests for COVID-19: a modelling analysis

Affiliations

Quantifying the potential value of antigen-detection rapid diagnostic tests for COVID-19: a modelling analysis

Saskia Ricks et al. BMC Med. .

Abstract

Background: Testing plays a critical role in treatment and prevention responses to the COVID-19 pandemic. Compared to nucleic acid tests (NATs), antigen-detection rapid diagnostic tests (Ag-RDTs) can be more accessible, but typically have lower sensitivity and specificity. By quantifying these trade-offs, we aimed to inform decisions about when an Ag-RDT would offer greater public health value than reliance on NAT.

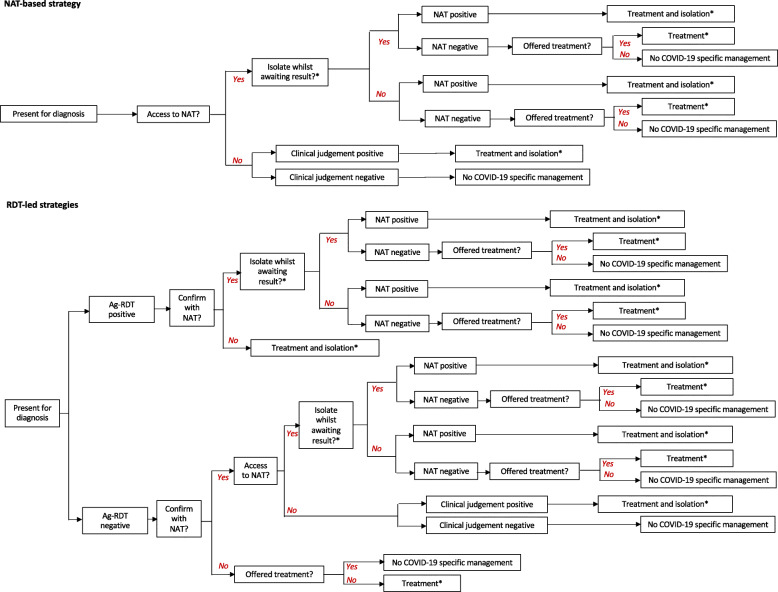
Methods: Following an expert consultation, we selected two use cases for analysis: rapid identification of people with COVID-19 amongst patients admitted with respiratory symptoms in a 'hospital' setting and early identification and isolation of people with mildly symptomatic COVID-19 in a 'community' setting. Using decision analysis, we evaluated the health system cost and health impact (deaths averted and infectious days isolated) of an Ag-RDT-led strategy, compared to a strategy based on NAT and clinical judgement. We adopted a broad range of values for 'contextual' parameters relevant to a range of settings, including the availability of NAT and the performance of clinical judgement. We performed a multivariate sensitivity analysis to all of these parameters.

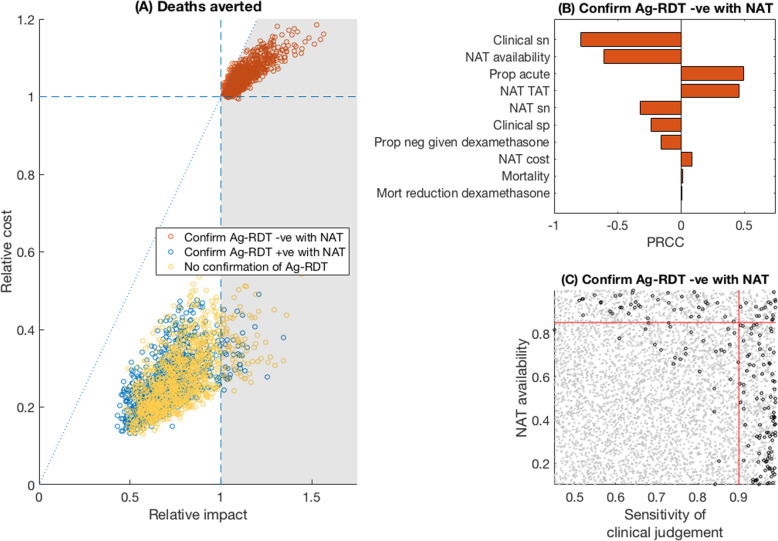
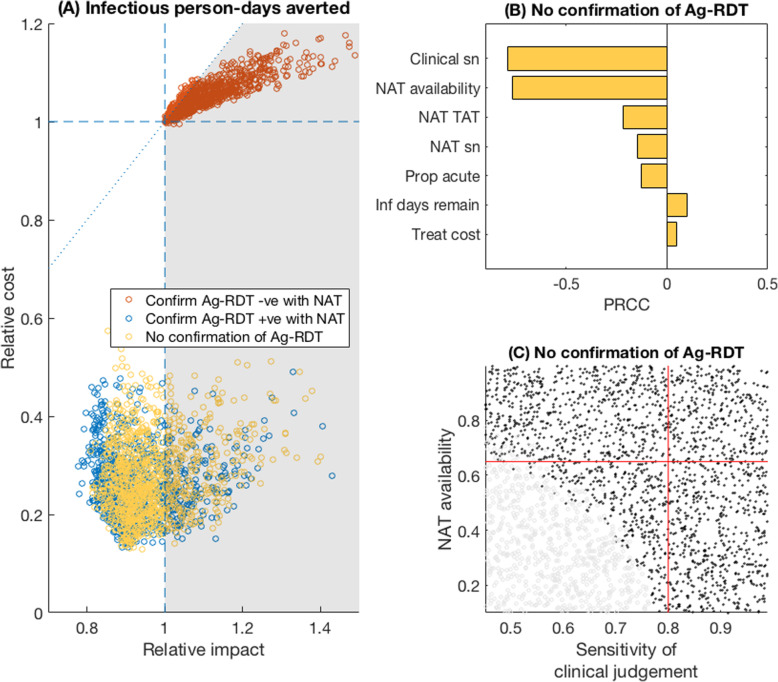
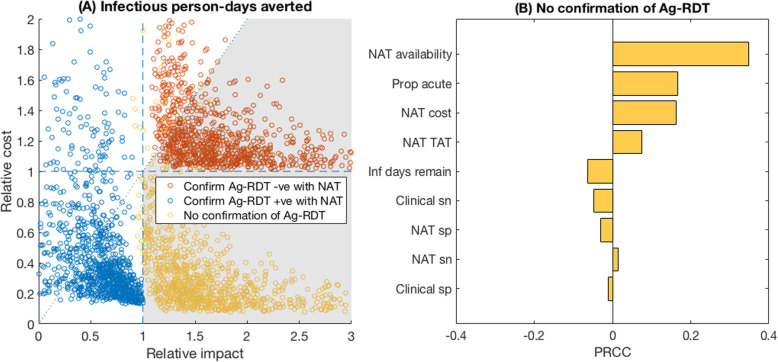
Results: In a hospital setting, an Ag-RDT-led strategy would avert more deaths than a NAT-based strategy, and at lower cost per death averted, when the sensitivity of clinical judgement is less than 90%, and when NAT results are available in time to inform clinical decision-making for less than 85% of patients. The use of an Ag-RDT is robustly supported in community settings, where it would avert more transmission at lower cost than relying on NAT alone, under a wide range of assumptions.

Conclusions: Despite their imperfect sensitivity and specificity, Ag-RDTs have the potential to be simultaneously more impactful, and have a lower cost per death and infectious person-days averted, than current approaches to COVID-19 diagnostic testing.

Keywords: Antigen; COVID-19; Rapid diagnostic tests.


Conflict of interest statement

The authors declare no competing interests.

Figures

Fig. 1
Fig. 1
Schematic illustration of the decision tree approach. As described in the main text, our analysis focuses on the direct benefit to patients being tested in different settings. *In the hospital setting, we assumed that all patients were provided with supportive care (e.g. oxygen support) regardless of test results, as such care would be provided based on symptoms and not aetiology. However, we modelled the use of the test in guiding decisions about whom to isolate and to treat with dexamethasone. Treatment did not apply to the community setting. Costs and deaths/infectious days averted were accumulated along each branch of the diagram as appropriate (for example, counting the cost of interim isolation along any branch labelled ‘Yes’ following ‘Isolate whilst awaiting result?’)
Fig. 2
Fig. 2
Relative value of Ag-RDT vs NAT testing, for averting deaths in a hospital setting. a Scatter plots for the relative impact of Ag-RDT vs NAT (horizontal axis) vs the relative cost of the two strategies (vertical axis). Each dot represents a single simulation with parameter values drawn from the ranges in Table 2. The grey-shaded area shows the region where an Ag-RDT-led strategy was ‘favourable’ over a NAT-only strategy, meaning that it averted more deaths, and at a lower cost per death averted (Additional file 3: Fig.S1). Colours of points indicate the adjunctive, confirmatory role of NAT in an Ag-RDT-led strategy (see in-figure legend). Of the red points, 96% fell in the favourable region. b Sensitivity analysis on the red points in a, to assess when these points fell above, or below, the diagonal dotted reference line. PRCC denotes ‘partial rank correlation coefficient’, against the cost per death averted. The longest bars indicate the most influential parameters; positive values indicate parameters that increased the favourability of the algorithm with increasingly positive values, and conversely for negative PRCCs. For example, when NAT was used to confirm negative results, the favourability of an Ag-RDT-led strategy was improved in settings having lower clinical sensitivity and a higher proportion of acute infection. c The joint role of the two most influential parameters in b. Grey and black points show parameter combinations where an Ag-RDT was favourable, and non-favourable, respectively, relative to NAT. Red lines show 90% sensitivity of clinical judgement (vertical line), and 85% NAT availability (horizontal line). In the lower left quadrant of these lines, an Ag-RDT was favourable over NAT in 99% of simulations. In these results, it is assumed that patients were placed in isolation (where indicated) while awaiting a NAT result: Additional file 5: Fig.S2 in the supporting information shows results in the alternative scenario where they were not isolated, pending NAT results
Fig. 3
Fig. 3
Relative value of Ag-RDT vs NAT testing, for averting infections in a hospital setting. a Scatter plots for the relative impact of Ag-RDT vs NAT (horizontal axis) vs the relative cost of the two strategies (vertical axis). Of the yellow points (no NAT confirmation of Ag-RDT results), 27% fell in the favourable region shaded in grey. Details as in Fig. 2a and Additional file 3: Fig.S1. b Sensitivity analysis for model parameters on the yellow points in a. The interpretation of PRCC is explained in further detail in the caption of Fig. 2. c concentrates on the two most influential parameters in this case, NAT availability and sensitivity of clinical judgement. As in Fig. 2c, grey and black points show parameter regimes where an Ag-RDT was, respectively, favourable and unfavourable, relative to NAT. Red lines show 80% sensitivity of clinical judgement (vertical line) and 65% NAT availability (horizontal line). In the lower left quadrant of these lines, an Ag-RDT was favourable over NAT in 66% of simulations. In these results, it was assumed that patients were placed in isolation while awaiting a NAT result: Additional file 6: Fig.S3 in the supporting information shows results in the alternative scenario where they were not isolated
Fig. 4
Fig. 4
Relative value of Ag-RDT vs NAT testing in a community setting. We assumed that in a community setting, the focus is on averting infection, and that any severe cases of respiratory disease are more likely to present in hospital settings (Fig. 3). Hence, in this setting, we focused on infectious person-days averted; we also assumed that individuals awaiting NAT results were not isolated during this time, owing to the infeasibility of doing so in this setting. a Scatter plot of the relative impact of Ag-RDT vs NAT (horizontal axis) vs the relative cost of Ag-RDT vs NAT (vertical axis). Dashed reference lines are as explained in Fig. 2 and in Additional file 3: Fig.S1. Of the yellow points (no NAT confirmation of Ag-RDT results), 98% fell in the favourable region shaded in grey; of the red points (confirm Ag-RDT negatives with a NAT), 80% fell in the favourable region. b Subgroup sensitivity analysis of the yellow points in a. Interpretation of PRCCs are as explained in Fig. 2 caption. Because the vast majority (98%) of simulations show Ag-RDT was favourable to NAT in this scenario, we did not conduct additional bivariate sensitivity analyses as for Figs. 2c and 3c

References

    1. World Health Organisation . WHO COVID-19 Preparedness and Response Progress Report - 1 February to 30 June 2020. Geneva: WHO; 2020.
    1. Cheng MP, Papenburg J, Desjardins M, Kanjilal S, Quach C, Libman M, et al. Diagnostic testing for severe acute respiratory syndrome–related coronavirus-2. Ann Internal Med. 2020; M20–1301. Available from: doi:10.7326/M20-1301. - PMC - PubMed
    1. Grassly NC, Pons-Salort M, Parker EPK, White PJ, Ferguson NM, Imperial College COVID-19 response team. Comparison of molecular testing strategies for COVID-19 control: a mathematical modelling study. Lancet Infectious Dis. 2020; Available from: doi:10.1016/S1473-3099(20)30630-7 - PMC - PubMed
    1. Wiersinga WJ, Rhodes A, Cheng AC, et al. Pathophysiology, transmission, diagnosis, and treatment of coronavirus disease 2019 (COVID-19) JAMA. 2020;324(8):782–793. doi: 10.1001/jama.2020.12839. - DOI - PubMed
    1. Schiffer JT, Johnston C, Wald A, Corey L. An early test-and-treat strategy for severe acute respiratory syndrome coronavirus 2. Open Forum Infect Dis. 2020;7(7): ofaa232. Available from. 10.1093/ofid/ofaa232. - PMC - PubMed

Publication types

Substances