. 2021 Mar 8;16(1):15.
doi: 10.1186/s13024-021-00435-6.

Cholesterol alters mitophagy by impairing optineurin recruitment and lysosomal clearance in Alzheimer's disease

Affiliations

Cholesterol alters mitophagy by impairing optineurin recruitment and lysosomal clearance in Alzheimer's disease

Vicente Roca-Agujetas et al. Mol Neurodegener. .

Abstract

Background: Emerging evidence indicates that impaired mitophagy-mediated clearance of defective mitochondria is a critical event in Alzheimer's disease (AD) pathogenesis. Amyloid-beta (Aβ) metabolism and the microtubule-associated protein tau have been reported to regulate key components of the mitophagy machinery. However, the mechanisms that lead to mitophagy dysfunction in AD are not fully deciphered. We have previously shown that intraneuronal cholesterol accumulation can disrupt the autophagy flux, resulting in low Aβ clearance. In this study, we examine the impact of neuronal cholesterol changes on mitochondrial removal by autophagy.

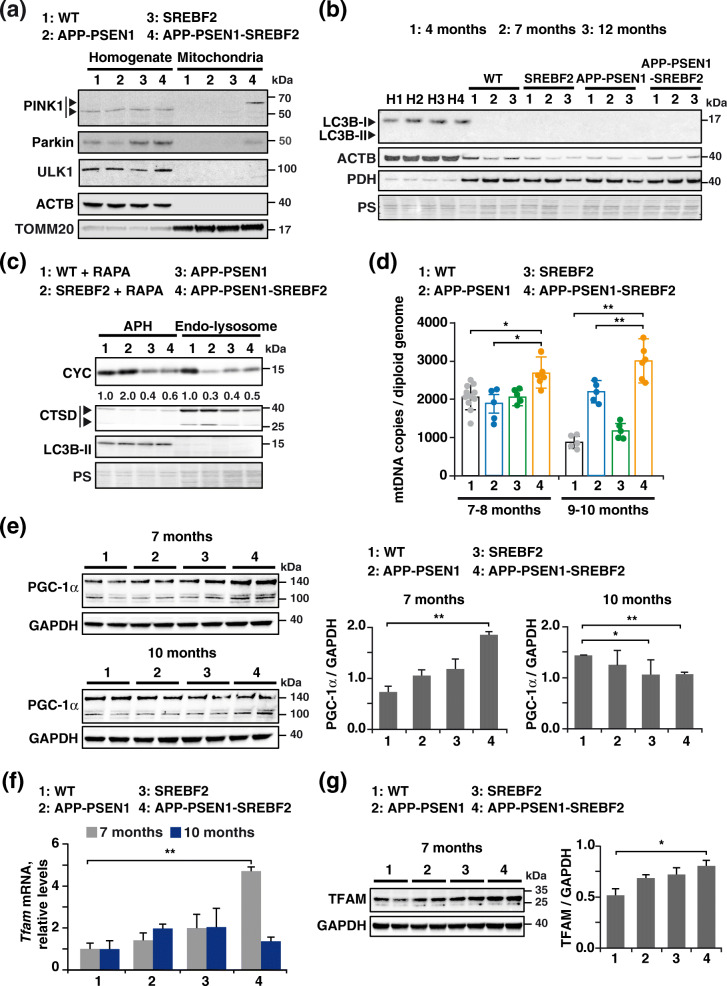
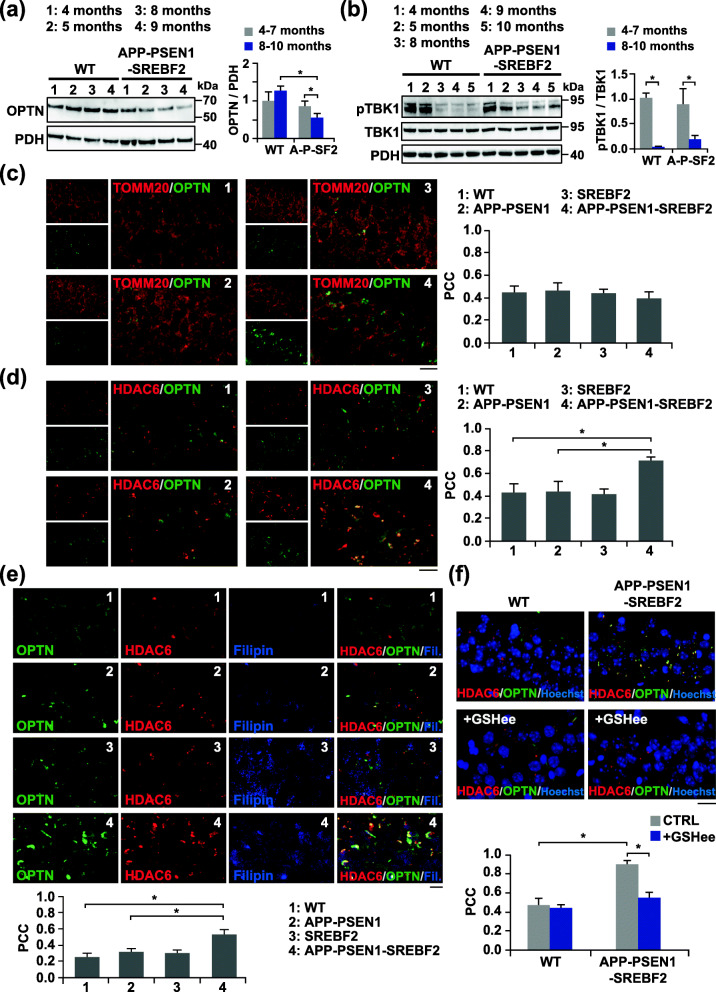
Methods: Regulation of PINK1-parkin-mediated mitophagy was investigated in conditions of acute (in vitro) and chronic (in vivo) high cholesterol loading using cholesterol-enriched SH-SY5Y cells, cultured primary neurons from transgenic mice overexpressing active SREBF2 (sterol regulatory element binding factor 2), and mice of increasing age that express the amyloid precursor protein with the familial Alzheimer Swedish mutation (Mo/HuAPP695swe) and mutant presenilin 1 (PS1-dE9) together with active SREBF2.

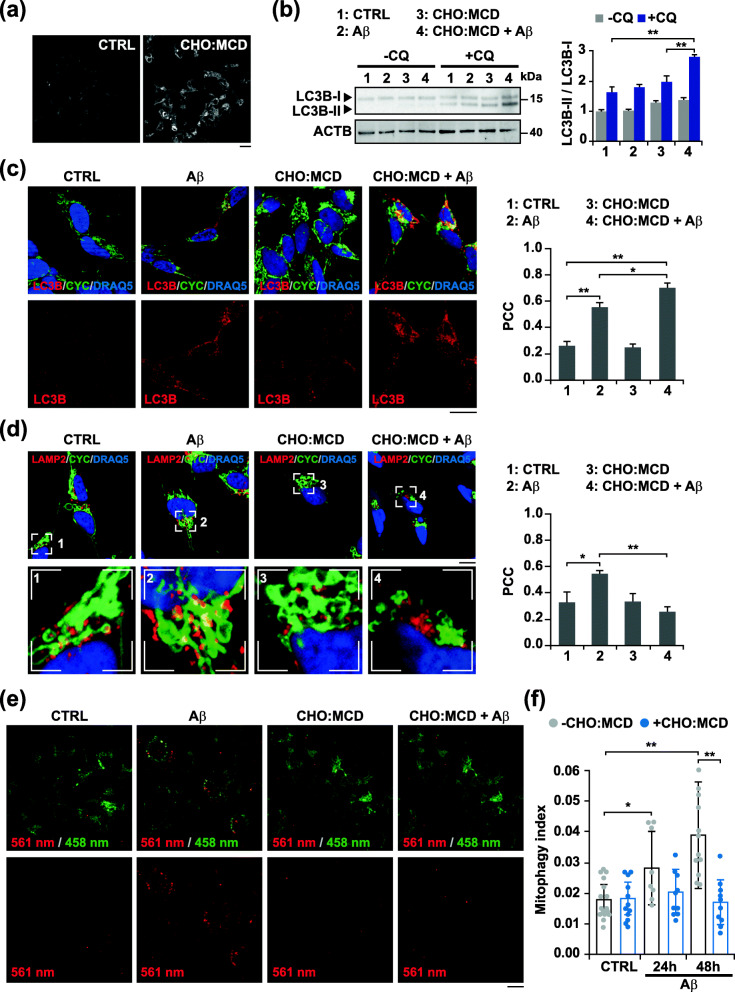
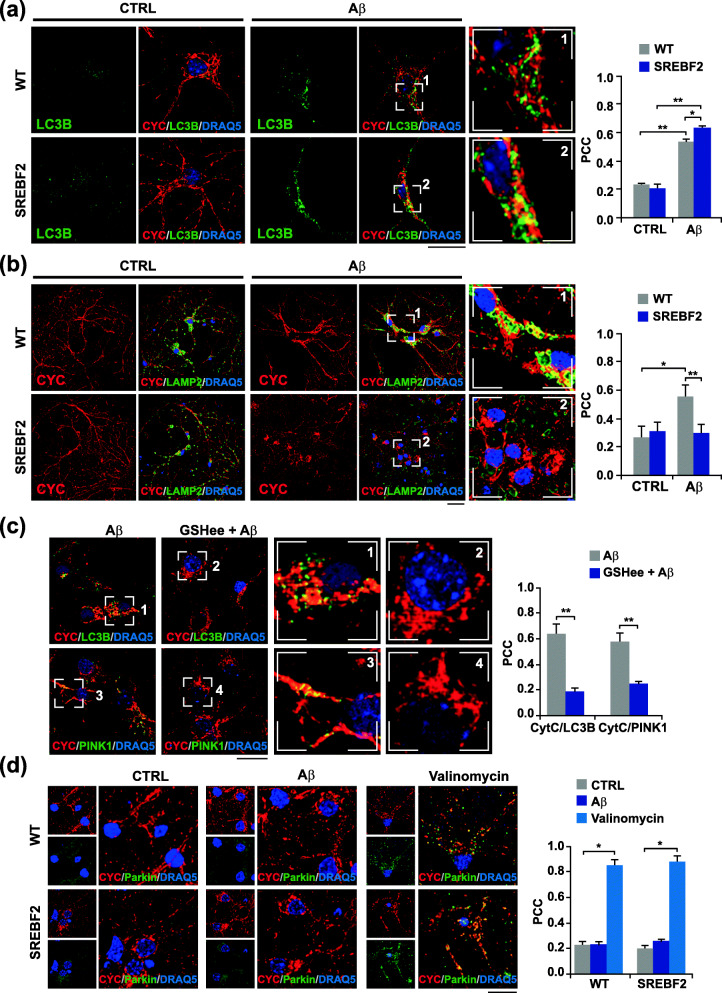
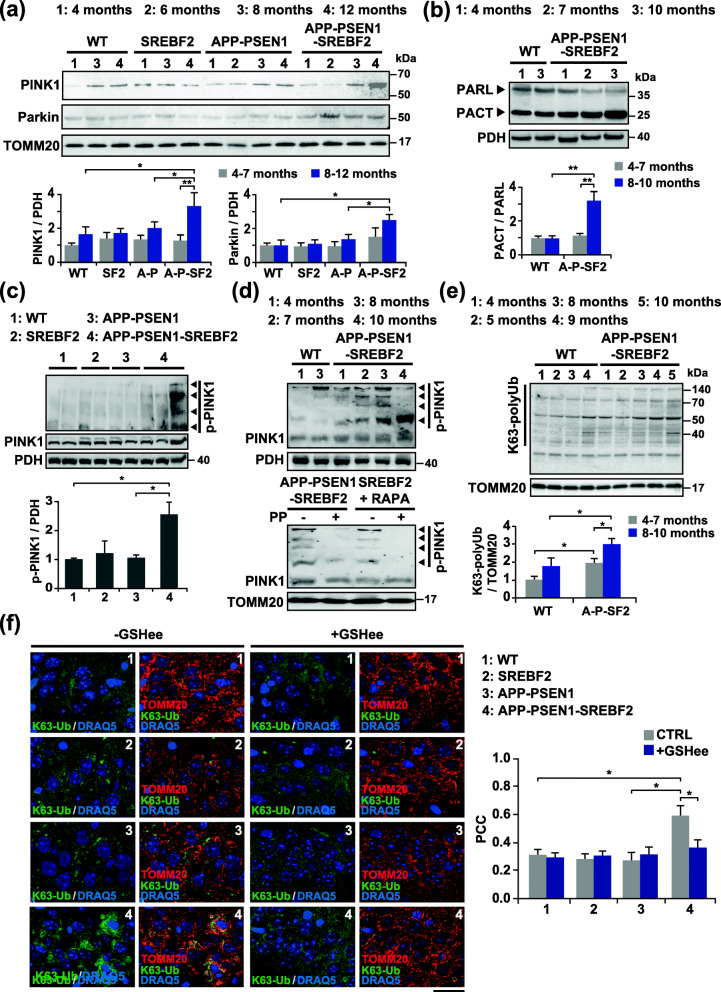
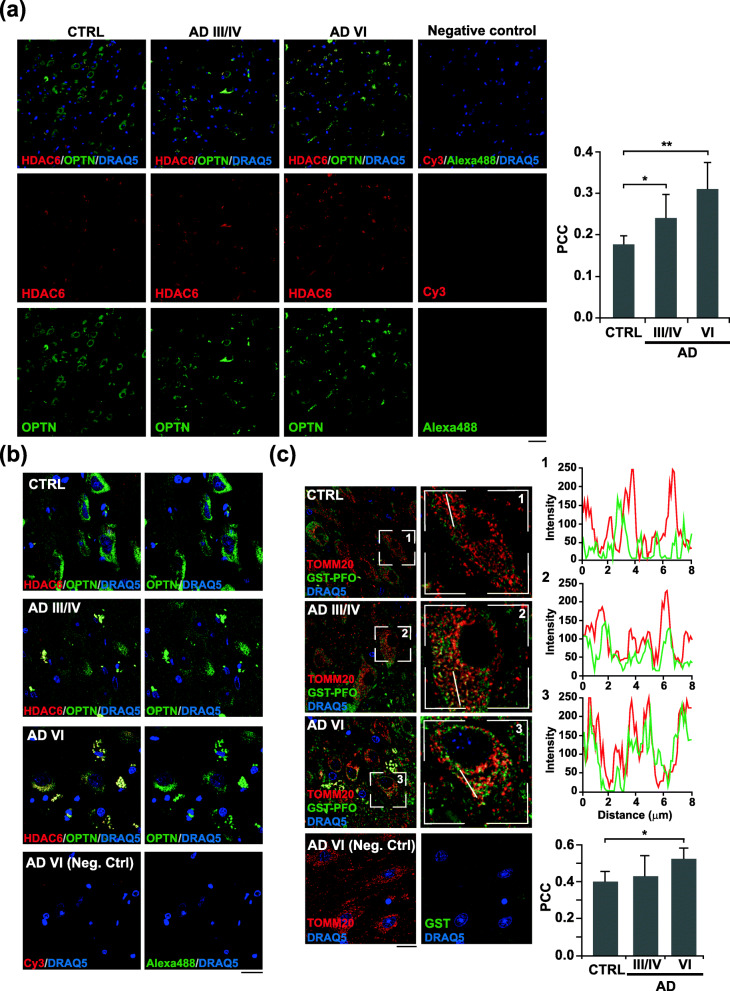
Results: In cholesterol-enriched SH-SY5Y cells and cultured primary neurons, high intracellular cholesterol levels stimulated mitochondrial PINK1 accumulation and mitophagosomes formation triggered by Aβ while impairing lysosomal-mediated clearance. Antioxidant recovery of cholesterol-induced mitochondrial glutathione (GSH) depletion prevented mitophagosomes formation indicating mitochondrial ROS involvement. Interestingly, when brain cholesterol accumulated chronically in aged APP-PSEN1-SREBF2 mice the mitophagy flux was affected at the early steps of the pathway, with defective recruitment of the key autophagy receptor optineurin (OPTN). Sustained cholesterol-induced alterations in APP-PSEN1-SREBF2 mice promoted an age-dependent accumulation of OPTN into HDAC6-positive aggresomes, which disappeared after in vivo treatment with GSH ethyl ester (GSHee). The analyses in post-mortem brain tissues from individuals with AD confirmed these findings, showing OPTN in aggresome-like structures that correlated with high mitochondrial cholesterol levels in late AD stages.

Conclusions: Our data demonstrate that accumulation of intracellular cholesterol reduces the clearance of defective mitochondria and suggest recovery of the cholesterol homeostasis and the mitochondrial scavenging of ROS as potential therapeutic targets for AD.

Keywords: APP-PSEN1 mice; Aggressomes; Glutathione; Mitochondria; Optineurin; Oxidative stress; PINK1; Parkin.


Conflict of interest statement

The authors declare that they have no conflict of interest.

Figures

Fig. 1
Fig. 1
Cholesterol-enrichment in SH-SY5Y cells enhances Aβ-induced mitophagosomes formation while impairing mitochondrial clearance by lysosomes. Cells were incubated with a complex of cholesterol:methyl-β-cyclodextrin (CHO:MCD) containing 50 μg/ml cholesterol during 1 h followed by 4 h of recovery. a Filipin staining of unesterified cholesterol. Representative images of the increased fluorescence after CHO:MCD treatment (n = 3). Scale bar: 25 μm. b Representative immunoblots of cell extracts showing LC3B levels. To assess changes in the autophagy flux, cells were treated with chloroquine (CQ, 10 μM). Densitometry values of the bands were normalized to values of the corresponding ACTB/actin β bands and expressed as LC3B-II/LC3B-I ratio (n = 3). See Supplementary Figure 16 for uncropped blots. c and d Representative confocal images of control (CTRL) and cholesterol-enriched cells after treatment with Aβ (10 μM) for 24 h, and double immunostained with antibodies for LC3B (red) and CYC (green) (c) and for LAMP2 (red) and CYC (green) (d). The Pearson’s correlation coefficient (PCC) was calculated from 3 independent experiments (at least 6 random fields were analyzed per condition). Nuclei were counterstained with DRAQ5 (blue). Insets show a 3-fold magnification of the indicated regions. Scale bar: 25 μm. e Dual-excitation ratiometric imaging of mt-mKeima. Representative confocal images of control and cholesterol-enriched cells stably expressing mt-mKeima after Aβ (10 μM) incubation for 48 h. The emission signal obtained after excitation with the 458 nm laser is shown in green, and that obtained after excitation with the 561 nm laser is shown in red. Scale bar: 25 μm. f Mitophagy index calculated from 3 independent experiments (at least 10 random fields were analyzed per condition). One-way ANOVA. *P < 0.05; **P < 0.01 (data are mean ± SD)
Fig. 2
Fig. 2
Cholesterol-induced depletion of mitochondrial GSH stimulates incomplete PINK1-mediated mitophagy in cultured primary neurons exposed to Aβ. Embryonic cortical and hippocampal neurons isolated from WT and SREBF2 mice were treated with Aβ (5 μM) for 24 h or valinomycin (10 μM) for 3 h to trigger mitophagy. a and b Representative confocal images of neuronal-enriched cultures double immunostained with antibodies for LC3B (green) and CYC (red) (a) and for LAMP2 (green) and CYC (red) (b). Scale bar: 25 μm. c SREBF2 cells were pre-incubated with GSH ethyl ester (GSHee, 0.5 mM) for 30 min prior mitophagy induction with Aβ. Shown are representative confocal images of double immunostainings for LC3B (green) and CYC (red) and for PINK1(green) and CYC (red). Scale bar: 25 μm. d Representative confocal images of a double immunolabeling for CYC (red) and parkin (green). Scale bar: 25 μm. Nuclei were counterstained with DRAQ5 (blue). Insets show a 3-fold magnification of the indicated regions. In all the cases, the Pearson’s correlation coefficient (PCC) was calculated from 3 independent experiments (at least 6 random fields were analyzed per condition). *P < 0.05; **P < 0.01 (data are mean ± SD)
Fig. 3
Fig. 3
APP-PSEN1-SREBF2 brains show mitophagy impairment with disrupted recruitment of core proteins for mitophagosome synthesis that leads to mitochondria accumulation. a Western blot analysis of PINK1, parkin, and ULK1 in homogenates and the mitochondrial fraction of brains from 8-month-old WT (wild-type) and the indicated transgenic mice. Arrows in the PINK1 blot indicate the mature (52-kDa) and full-length (62-kDa) form. ACTB/actin β and TOMM20 levels were used as protein loading control in homogenates and mitochondria samples, respectively. b Immunoblot analysis of LC3B levels in mitochondria isolated from brains of WT and the indicated transgenic mice from 4 to 12 months of age. H1-H4: homogenate from 9-month-old WT (1), SREBF2 (2), APP-PSEN1 (3), and APP-PSEN1-SREBF2 (4) mice. c Western blot analysis of CYC in autophagosome (APH) and endo-lysosomes isolated from brains of 8-month-old WT and the indicated transgenic mice. To induce mitophagy, WT and SREBF2 mice were treated with rapamycin (RAPA, 5 mg/kg, i.p.) for 24 h. All densitometry values were first normalized to Ponceau S (PS) staining to adjust for protein loading. Then, values of CYC bands were normalized to the values of the corresponding LC3B-II (autophagosomes) or mature CTSD (lysosomes) bands. CTSD: Cathepsin D, intermediate (40 kDa) and mature (25 kDa) forms. d Quantification of mitochondrial DNA (mtDNA) in the hippocampus from WT and the indicated transgenic mice analyzed by range of age. mtDNA copy numbers were normalized to the copy number of Bax and Gsk3β genes as a mean of total diploid genome (n = 5–11 per range of age and genotype). e Expression levels of PGC-1α in total brain extracts. f Tfam mRNA expression in the hippocampus from WT and the indicated transgenic mice. Transcripts copies were expressed as relative levels referred to the expression in WT mice (n = 6). g Western blot analysis of TFAM in total brain extracts. e and g Densitometric values of the bands representing the specific protein immunoreactivity were normalized to the values of the corresponding GAPDH bands (n = 6). One-way ANOVA. *P < 0.05; **P < 0.01 (data are mean ± SD). See Supplementary Figure 17 for uncropped blots
Fig. 4
Fig. 4
Age-dependent activation of the PINK1-parkin pathway in mitochondria from brains of APP-PSEN1-SREBF2 mice. Mitochondria-rich fractions were isolated from brain extracts of WT and the indicated transgenic mice at increasing ages. a and b Representative immunoblots showing the expression levels of PINK1, parkin and PARL in the mitochondria-rich fraction. PACT: C-terminal PARL fragment. c and d Phos-tag™ SDS-PAGE analysis of phospho-PINK (p-PINK1) in the mitochondria-rich fraction from WT and the indicated transgenic mice. As a control, samples were treated with 50 U of alkaline phosphatase (PP) for 1 h at 37 °C to inhibit phosphorylation. SREBF2 mice were treated with the autophagy inducer rapamycin (RAPA, 5 mg/kg, i.p.) for 24 h. PDH and TOMM20 were used to confirm equal loading. e Representative K63 polyubiquitin (K63-polyUb) western blot. K63-linkage specific polyubiquitin antibodies were used to detect K63 ubiquitination of proteins in the mitochondrial fractions. During mitochondria isolation, deubiquitination of the proteins was prevented by including 10 mM N-ethylmaleimide (NEM) in the isolation buffer. a, b, c, and e Densitometry of the bands representing specific protein immunoreactivity was assessed from samples grouped in the indicated range of age and values were normalized to the corresponding PDH or TOMM20 values. C-terminal PARL (PACT) fragment values were normalized to unprocessed PARL values (n = 3–4 per range of age and genotype). SF2: SREBF2 mice, A-P: APP-PSEN1 mice, A-P-SF2: APP-PSEN1-SREBF2 mice. See Supplementary Figure 18 for uncropped blots. f Hippocampal slices from 10-month-old WT and the indicated transgenic mice. Shown are confocal photomicrograph of K63-polyUb (green) and TOMM20 (red) immunoreactivity. To recover the mitochondrial GSH content, mice were treated with 1.25 mmol/kg of GSH ethyl ester (GSHee) every 12 h for 2 weeks. Nuclei were counterstained by DRAQ5 (blue). Scale bars: 25 μm. The Pearson’s correlation coefficient (PCC) was calculated from 3 random fields per condition. One-way ANOVA. *P < 0.05; **P < 0.01 (data are mean ± SD)
Fig. 5
Fig. 5
Reduced recruitment of OPTN to mitochondria that correlates with oxidative-induced OPTN-positive aggresomes in old APP-PSEN1-SREF2 mice. a and b Representative immunoblots of OPTN levels (a) and the protein levels of TBK1 and its phosphorylated form (pTBK1) (b) in the mitochondrial fraction isolated from brain extracts of WT and APP-PSEN1-SREBF2 mice at increasing ages. Densitometry of the bands representing specific protein immunoreactivity was assessed from samples grouped in the indicated range of age and values were normalized to the corresponding PDH values. pTBK1 values were normalized to TBK1 values. (n = 4 per range of age and genotype). A-P-SF2: APP-PSEN1-SREBF2 mice. See Supplementary Figure 19 for uncropped blots. c-f Hippocampal slices from 10-month-old WT and the indicated transgenic mice. Shown are photomicrograph of OPTN (green) and TOMM20 (red) immunoreactivity (c) or OPTN (green) and HDAC6 (red) immunoreactivity (d-f) with filipin staining (e). To recover the mitochondrial GSH content, mice were treated with 1.25 mmol/kg of GSH ethyl ester (GSHee) every 12 h for 2 weeks. Nuclei were counterstained by bisBenzimide Hoechst 33258 (blue). Scale bars: 25 μm. The Pearson’s correlation coefficient (PCC) was calculated from 3 independent experiments (at least 4 random fields were analyzed per condition). One-way ANOVA. *P < 0.05; **P < 0.01 (data are mean ± SD)
Fig. 6
Fig. 6
Pyramidal neurons in the hippocampus from AD patients display OPTN in HDA6C-positive aggregates associated with high mitochondrial cholesterol levels. a and b Hippocampal slices from control (CTRL) and AD patients classified into three groups following the “ABC” score: CTRL, intermediate AD (AD III-IV) and high AD (AD VI). Shown are representative confocal photomicrograph of double immunofluorescence for OPTN (green) and HDAC6 (red) at 20X magnification (a) and 63X magnification (b). A negative control slide incubated only with secondary antibodies was included. c Shown are representative confocal photomicrograph of double immunofluorescence for GST-PFO (green) and TOMM20 (red). Sections were incubated with 20 μg/ml GST-PFO for 3 h prior immunolabeling. Insets show a 3-fold magnification of the indicated regions. A negative control without GST-PFO incubation was included. Graphs depict the intensity profiles of GST-PFO and TOMM20 fluorescence in the cross-section. Nuclei were counterstained by DRAQ5 (blue). Scale bar: 50 μm (a) and 25 μm (b and c). In all the cases, the Pearson’s correlation coefficient (PCC) was calculated from 5 individuals per group (at least 6 random fields were analyzed per sample). *P < 0.05; **P < 0.01 (data are mean ± SD)

References

    1. Spinelli JB, Haigis MC. The multifaceted contributions of mitochondria to cellular metabolism. Nat Cell Biol. 2018;20:745–754. doi: 10.1038/s41556-018-0124-1. - DOI - PMC - PubMed
    1. Rangaraju V, Calloway N, Ryan TA. Activity-driven local ATP synthesis is required for synaptic function. Cell. 2014;156:825–835. doi: 10.1016/j.cell.2013.12.042. - DOI - PMC - PubMed
    1. Gusdon AM, Chu CT. To eat or not to eat: neuronal metabolism, mitophagy, and Parkinson's disease. Antioxid Redox Signal. 2011;14:1979–1987. doi: 10.1089/ars.2010.3763. - DOI - PMC - PubMed
    1. Kawamata H, Manfredi G. Proteinopathies and OXPHOS dysfunction in neurodegenerative diseases. J Cell Biol. 2017;216:3917–3929. doi: 10.1083/jcb.201709172. - DOI - PMC - PubMed
    1. Grimm A, Friedland K, Eckert A. Mitochondrial dysfunction: the missing link between aging and sporadic Alzheimer's disease. Biogerontology. 2016;17:281–296. doi: 10.1007/s10522-015-9618-4. - DOI - PubMed

Publication types