

Heterogeneous contributions of change in population distribution of body mass index to change in obesity and underweight
- PMID: 33685583
- PMCID: PMC7943191
- DOI: 10.7554/eLife.60060
Heterogeneous contributions of change in population distribution of body mass index to change in obesity and underweight
Abstract
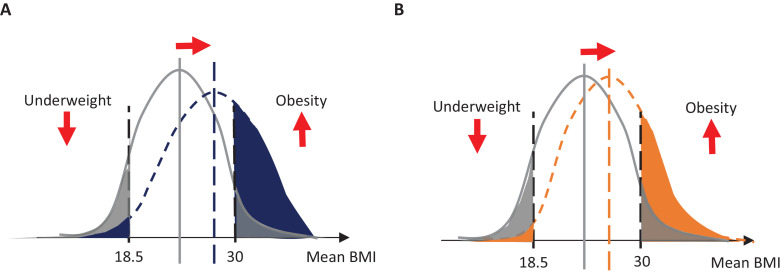
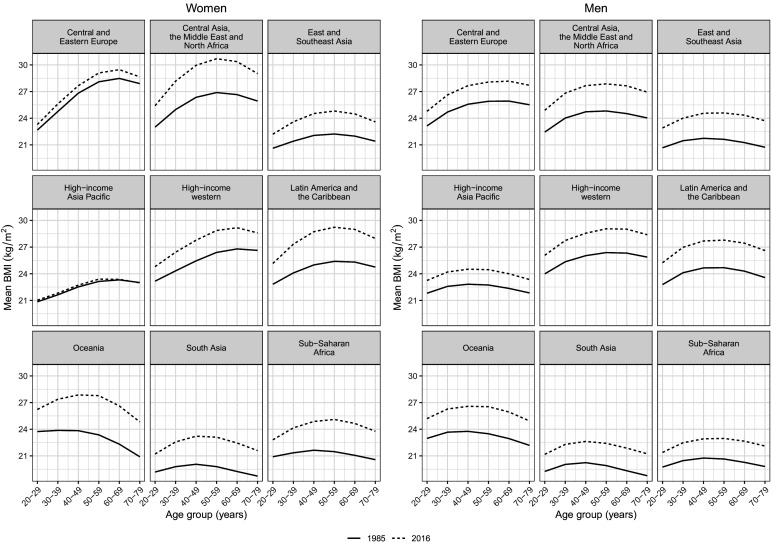
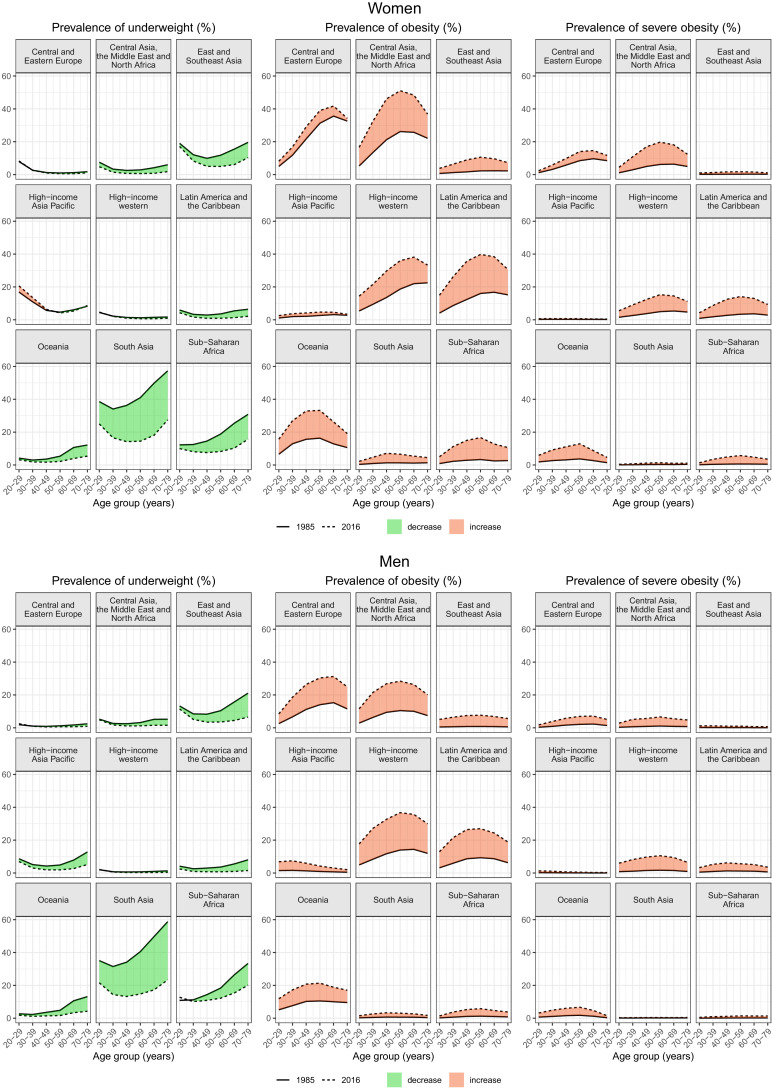
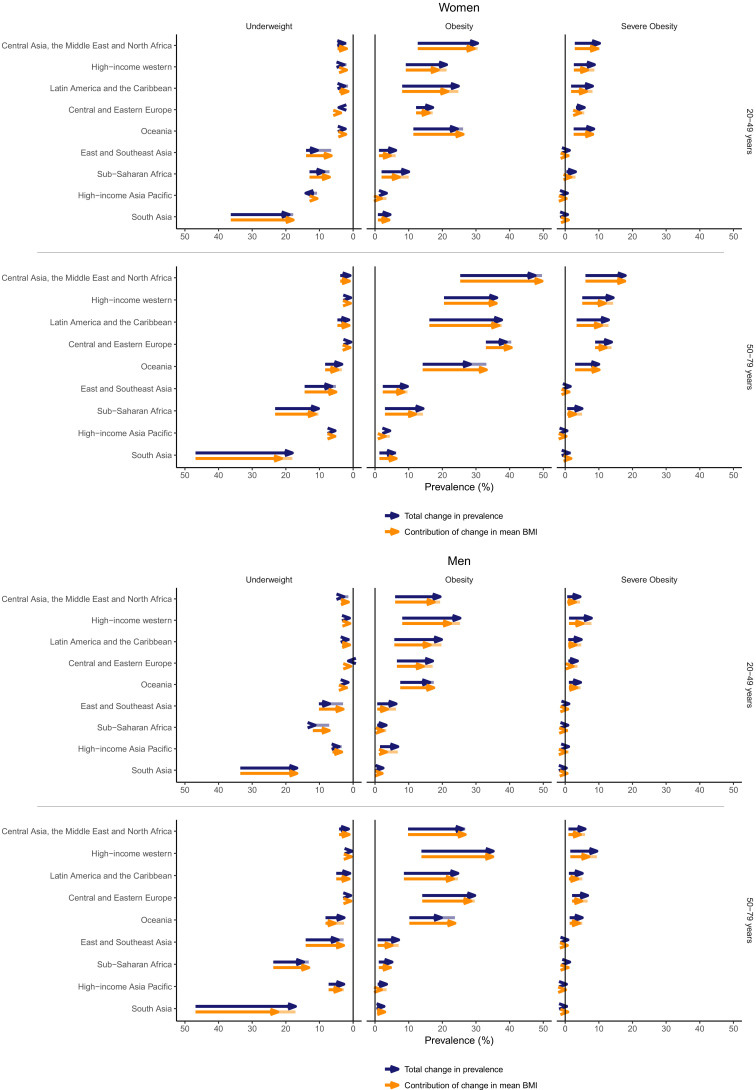
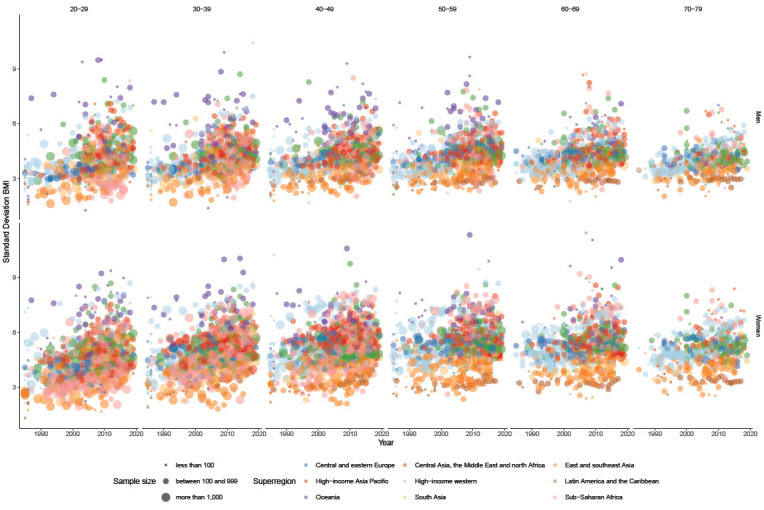
From 1985 to 2016, the prevalence of underweight decreased, and that of obesity and severe obesity increased, in most regions, with significant variation in the magnitude of these changes across regions. We investigated how much change in mean body mass index (BMI) explains changes in the prevalence of underweight, obesity, and severe obesity in different regions using data from 2896 population-based studies with 187 million participants. Changes in the prevalence of underweight and total obesity, and to a lesser extent severe obesity, are largely driven by shifts in the distribution of BMI, with smaller contributions from changes in the shape of the distribution. In East and Southeast Asia and sub-Saharan Africa, the underweight tail of the BMI distribution was left behind as the distribution shifted. There is a need for policies that address all forms of malnutrition by making healthy foods accessible and affordable, while restricting unhealthy foods through fiscal and regulatory restrictions.
Keywords: BMI; epidemiology; global health; none; obesity; underweight.
© 2021, NCD Risk Factor Collaboration (NCD-RisC).
Conflict of interest statement
No competing interests declared
Figures


References
-
- Ahmad OB, Boschi-Pinto C, Lopez AD, Murray CJ, Lozano R, Inoue M. Age Standardization of Rates: A New WHO Standard. Geneva: World Health Organization; 2001. https://www.who.int/healthinfo/paper31.pdf
-
- Danaei G, Finucane MM, Lu Y, Singh GM, Cowan MJ, Paciorek CJ, Lin JK, Farzadfar F, Khang YH, Stevens GA, Rao M, Ali MK, Riley LM, Robinson CA, Ezzati M, Global Burden of Metabolic Risk Factors of Chronic Diseases Collaborating Group (Blood Glucose) National, regional, and global trends in fasting plasma glucose and diabetes prevalence since 1980: systematic analysis of health examination surveys and epidemiological studies with 370 country-years and 2·7 million participants. The Lancet. 2011a;378:31–40. doi: 10.1016/S0140-6736(11)60679-X. - DOI - PubMed
Publication types
MeSH terms
Grants and funding
- K43 TW010698/TW/FIC NIH HHS/United States
- MC_U147585819/MRC_/Medical Research Council/United Kingdom
- MC_PC_21001/MRC_/Medical Research Council/United Kingdom
- MC_UP_A620_1014/MRC_/Medical Research Council/United Kingdom
- MC_UU_12011/3/MRC_/Medical Research Council/United Kingdom
- MC_UU_00017/1/MRC_/Medical Research Council/United Kingdom
- MC_UU_12011/1/MRC_/Medical Research Council/United Kingdom
- WT_/Wellcome Trust/United Kingdom
- MC_UU_00006/1/MRC_/Medical Research Council/United Kingdom
- MC_U147585827/MRC_/Medical Research Council/United Kingdom
- MC_PC_21000/MRC_/Medical Research Council/United Kingdom
- G0400491/MRC_/Medical Research Council/United Kingdom
- MC_UP_A620_1016/MRC_/Medical Research Council/United Kingdom
- MC_U147585824/MRC_/Medical Research Council/United Kingdom
- MR/S019669/1/MRC_/Medical Research Council/United Kingdom
LinkOut - more resources
Full Text Sources
Other Literature Sources
Medical
