. 2021 Mar 8;12(1):1508.
doi: 10.1038/s41467-021-21829-6.

Oxidation inhibits autophagy protein deconjugation from phagosomes to sustain MHC class II restricted antigen presentation

Affiliations

Oxidation inhibits autophagy protein deconjugation from phagosomes to sustain MHC class II restricted antigen presentation

Laure-Anne Ligeon et al. Nat Commun. .

Abstract

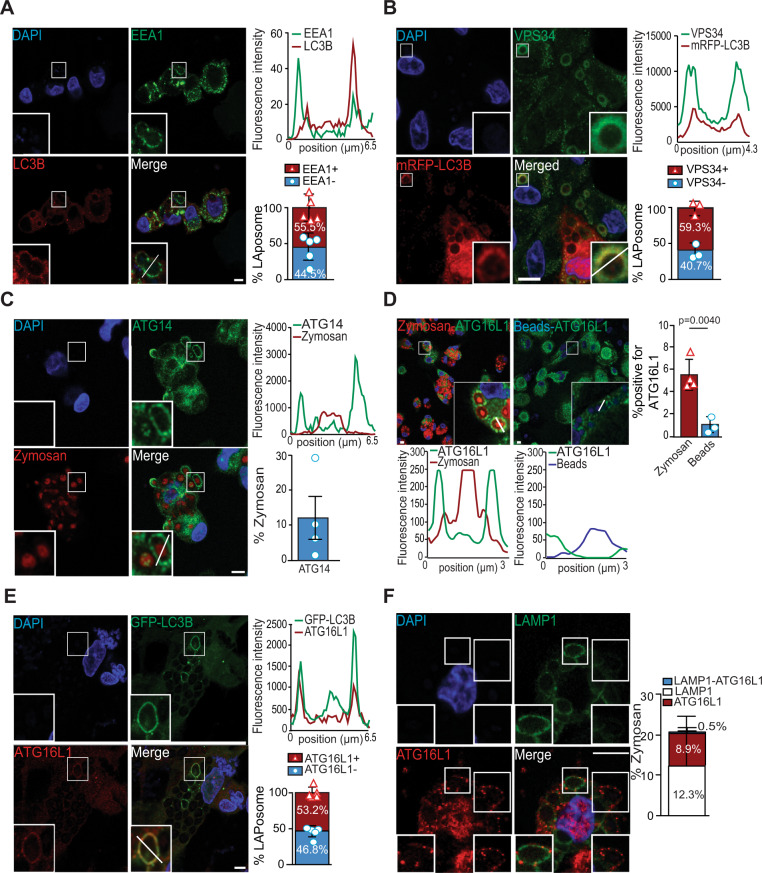
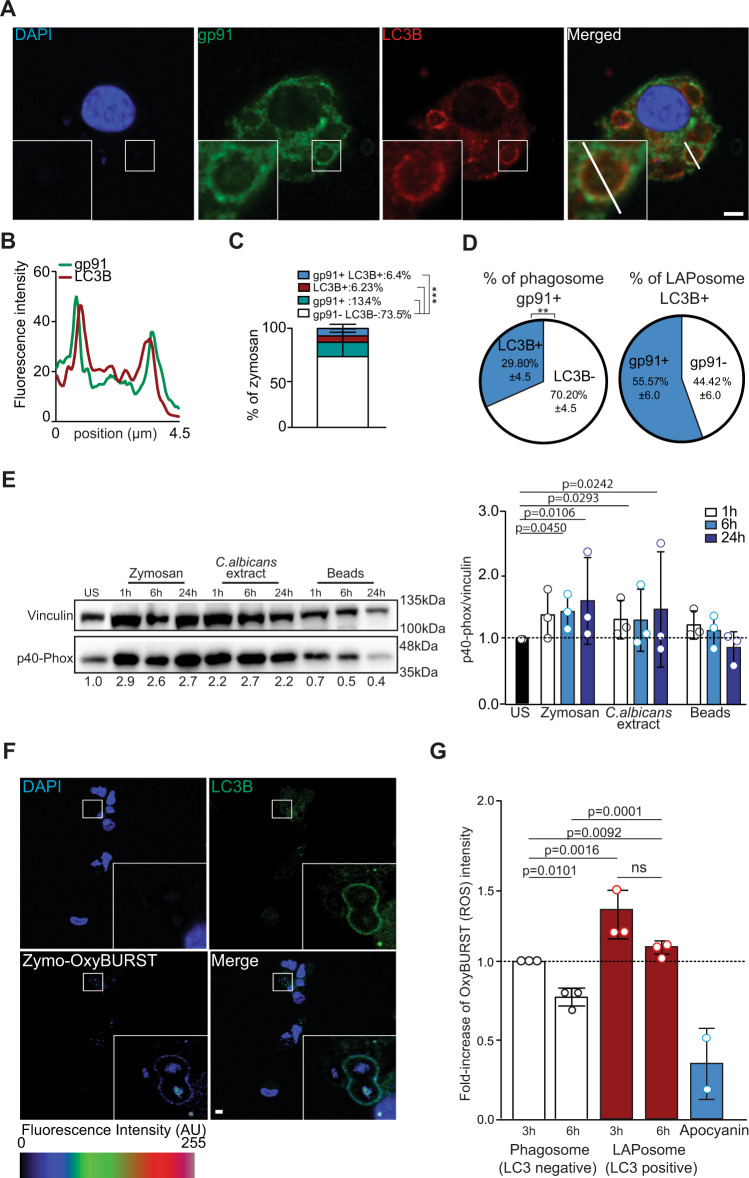
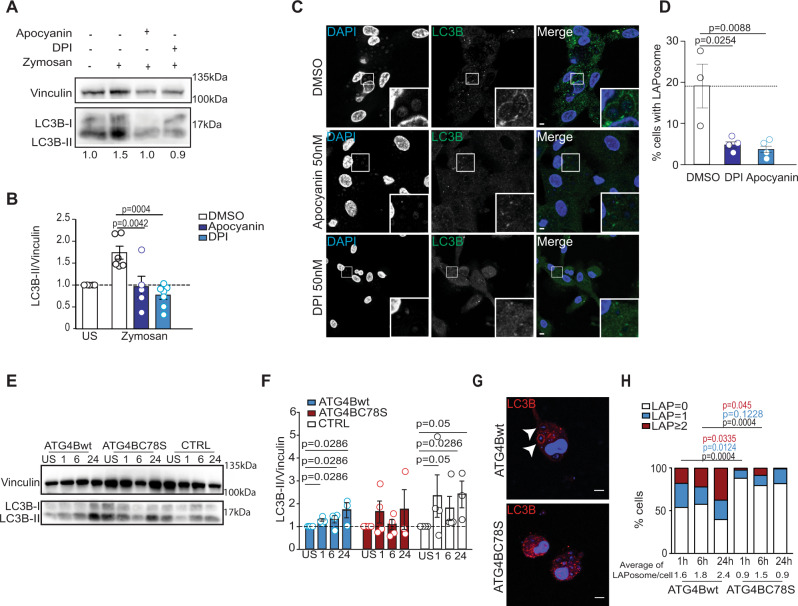
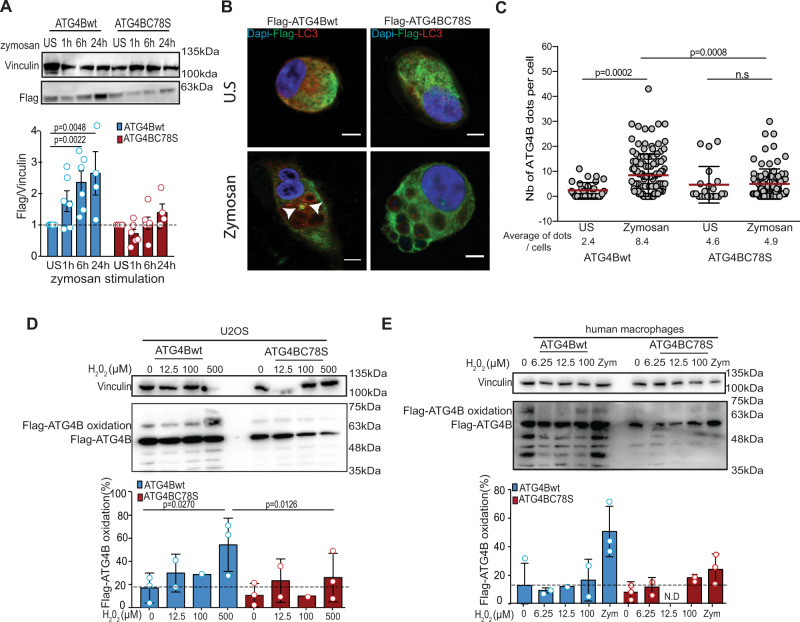
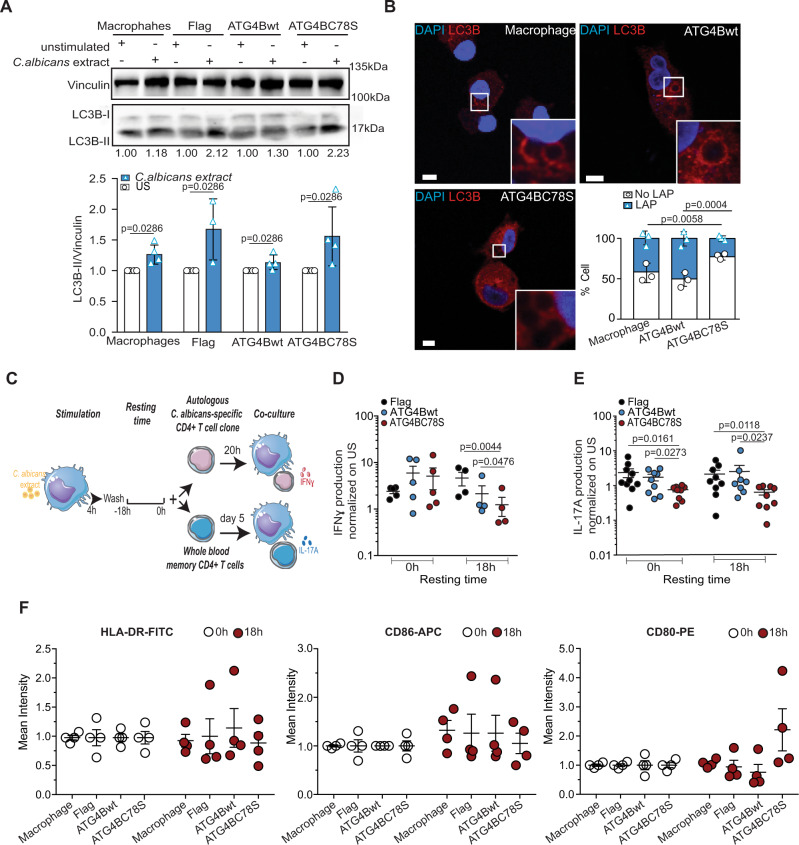
LC3-associated phagocytosis (LAP) contributes to a wide range of cellular processes and notably to immunity. The stabilization of phagosomes by the macroautophagy machinery in human macrophages can maintain antigen presentation on MHC class II molecules. However, the molecular mechanisms involved in the formation and maturation of the resulting LAPosomes are not completely understood. Here, we show that reactive oxygen species (ROS) produced by NADPH oxidase 2 (NOX2) stabilize LAPosomes by inhibiting LC3 deconjugation from the LAPosome cytosolic surface. NOX2 residing in the LAPosome membrane generates ROS to cause oxidative inactivation of the protease ATG4B, which otherwise releases LC3B from LAPosomes. An oxidation-insensitive ATG4B mutant compromises LAP and thereby impedes sustained MHC class II presentation of exogenous Candida albicans antigens. Redox regulation of ATG4B is thereby an important mechanism for maintaining LC3 decoration of LAPosomes to support antigen processing for MHC class II presentation.


Conflict of interest statement

The authors declare no competing interests.

Figures

Fig. 1
Fig. 1. The VPS34/ATG14 and ATG16L1 complexes are recruited to LAPosomes.
A Human macrophages stimulated with zymosan for 1 h and costained for EEA1 (green) and LC3B (red). Bar graph shows the percentage of LAPosomes colocalizing with EEA1; n = 5; each symbol represents an individual experiment. B mRFP-LC3B transduced macrophages stimulated with zymosan for 6 h and stained for VPS34 (green). Bar graph shows the percentage of LAPosomes in mRFP/GST-LC3B cells colocalizing with VPS34. Bar represents mean ± SD of data pooled from three independent experiments and each symbol represents an individual experiment. C Macrophages stimulated with zymosan-Texas Red for 1 h and stained for ATG14 (green). Graph shows the percentage of zymosan-containing phagosomes displaying ATG14, each symbol represents an individual experiment. Bar represents the mean ± SD of three independent experiments quantified by two independent investigators. D Macrophages stimulated with zymosan-Texas Red (red) or with inert beads (blue) for 6 h and stained for ATG16L1 (green). Quantification of the percentage of zymosan or beads positive for ATG16L1 is shown in the bar graph. Bars represent the mean ± SD; data pooled from n = 4 (zymosan) and n = 3 (beads) independent experiments, quantified by two independent investigators and each symbol represents an individual experiment; unpaired Student’s t test, two-tailed. E GFP-LC3B transduced macrophages stimulated with zymosan for 6 h and stained for ATG16L1 (red). Bar graph shows the quantification of the percentage of LAPosomes in GFP/GST-LC3B cells colocalizing with ATG16L1; n = 5 and each symbol represents an individual experiment. AE Fluorescence intensities were quantified along the white segment as shown in the merged panel and plotted as a histogram. F Macrophages stimulated with zymosan for 6 h and costained for LAMP1 (green) and ATG16L1 (red). Left-bottom inserts show a zymosan-containing phagosome decorated with LAMP1 but not ATG16L1. Right-bottom inserts show a zymosan-containing phagosome negative for LAMP1 but positive for ATG16L1. Bar graph shows the percentage of zymosan-containing phagosomes displaying single staining for LAMP1 or ATG16L1, or both. The bar graph represents the mean ± SD of three independent experiments, quantified by two investigators blinded to the experimental conditions. All confocal images are representative images of three different independent experiments. Scale bar is 5 µm, and inserts are zoomed 5× from white-framed regions of the immune fluorescence micrographs. Source data are provided as a Source Data file.
Fig. 2
Fig. 2. Elevated ROS levels inside LAPosomes are maintained for several hours.
A Human macrophages were stimulated with zymosan for 6 h, fixed and costained for gp91 (green) and LC3B (red). B Histogram shows the fluorescence intensity of gp91 (green) and LC3 (red) along the white segment in the merged fluorescence panel of A. Confocal images are representative of three different independent experiments. Scale bar is 5 µm, and inserts are zoomed 5× from white-framed regions of the immune fluorescence micrographs. C Quantitative analysis of the percentage of zymosan-containing vesicles displaying only LC3 or gp91, both or none. Bar graph represents the mean ± SD of three independent experiments, quantified by two independent investigators. One-way ANOVA test: ***p < 0.005. D The first pie chart shows the percentage of gp91+ phagosomes displaying LC3B. Second pie chart on the left shows the percentage of LAPosome (LC3B+) colocalizing with gp91, Mann–Whitney test, two-tailed: **p < 0.005. E Macrophages were stimulated with zymosan, Candida albicans extract, or beads for 1 up to 24 h, lysed and the change on p40-phox protein level were assessed by western blotting. One representative experiment of three is shown. Bars represent the mean of band intensity of p40-phox normalized to the loading control vinculin from three independent experiments (symbols represent one experiment). All conditions are normalized to the unstimulated condition (US), which is set to 1. One-way ANOVA test. F Macrophages were stimulated with OxyBURST-coated zymosan for 6 h, fixed and stained for LC3 (red). OxyBURST intensity levels were measured inside LAPosomes and LC3-negative phagosomes. Confocal images are representative of three different independent experiments. Scale bar is 5 µm, and inserts are zoomed 5× from white-framed regions of the immune fluorescence micrographs. G Bar graph represents OxyBURST intensity increase after 3 or 6 h of OxyBURST-coated zymosan stimulation inside phagosomes or LAPosomes. All conditions are normalized to the condition of phagosome after 3 h of stimulation, which is set to 1. Bars represent the mean ± SD of three independent experiments (symbols represent one experiment) and for each, more than 50 LAPosomes and phagosomes were analyzed. One-way ANOVA test. Source data are provided as a Source Data file.
Fig. 3
Fig. 3. Regulation of ATG4B-delipidation activity by ROS is involved in LAPosome stabilization.
A Macrophages pretreated with NOX inhibitors were stimulated with zymosan for 6 h and then lysed. Cell lysates were subjected to SDS-PAGE gel electrophoresis and immunoblotted for LC3B and the loading control vinculin. One representative experiment of three is shown and US represents unstimulated conditions. B Bar graph shows the level of LC3B-II protein expression normalized to vinculin. All conditions are normalized to the DMSO unstimulated condition, which is set to 1. Bars represent the mean ± SD: DMSO (n = 6), apocynin (n = 5), and DPI (n = 7) independent experiments, and each symbol represents a single experiment, ordinary one-way ANOVA. C Macrophages were pretreated with NOX inhibitors (apocynin 50 nM and DPI 50 nM) and stimulated for 6 h with zymosan, fixed and stained for LC3B (green). Representative images from three independent experiments are shown, scale bar is 5 µm, and inserts are 5× zoomed from white-framed regions in the original images. D Bar graph displays the percentage of cells with LAPosomes in each condition. Mean of three independent experiments and each symbol represents a single experiment. Unpaired t test two-tailed. E, F Macrophages transduced with lentiviruses encoding Flag, Flag-ATG4Bwt, or Flag-ATG4BC78S were stimulated with zymosan for 1–24 h, lysed, and LC3B protein levels were assessed by western blot. Image from one representative of three independent experiments. Bar graph shows the level of LC3B-II expression normalized to vinculin. All conditions are normalized to the respective unstimulated conditions (US), which are set to 1, and bars represent mean ± SD of three independent experiments, and each symbol represents a single experiment. Mann–Whitney test, two-tailed. G Macrophages transduced with lentiviruses encoding Flag-ATG4Bwt or Flag-ATG4BC78S were stimulated with zymosan for 6 h, fixed and stained for LC3B (red). White arrows indicate the recruitment of LC3B to zymosan-containing phagosomes. Representative images from three independent experiments are shown with scale bar of 5 µM. H Bar graph shows the percentage of LAPosomes formed per cell upon zymosan stimulation (1 h up to 24 h) in macrophages overexpressing Flag-ATG4Bwt or Flag-ATG4BC78S. Bars represent the fraction of total mean of five independent experiments. One-way ANOVA test. Source data are provided as a Source Data file.
Fig. 4
Fig. 4. ATG4B is regulated by cysteine oxidation during LAP.
A Macrophages transduced with lentiviruses encoding Flag-ATG4Bwt or Flag-ATG4BC78S were stimulated with zymosan for 1–24 h, lysed, and the level of Flag tagged proteins assessed by western blot. Bar graph shows the accumulation of Flag-ATG4Bwt upon LAP stimulation while no accumulation of the Flag-ATG4BC78S is observed. Bar graph represents mean ± SD of n = 6 independent experiments for the US to 6 h conditions and n = 4 independent experiments for the 24 h condition. Each symbol represents a single experiment. Mann–Whitney test, two-tailed. B Macrophages transduced with lentivirus expressing Flag-ATG4Bwt or Flag-ATG4BC78S were stimulated or not with zymosan for 6 h, fixed, and then stained for Flag (green) or LC3 (red). Representative images from three independent experiments are shown with scale bars of 5 µM. White arrows show Flag-ATG4B dots and US represents unstimulated conditions. C Graph shows the number of Flag-ATG4B dots per cells in unstimulated or zymosan stimulated conditions. Each dot represents a single cell and more than 20 cells per experiment were analyzed from three independent experiments. Unpaired Student’s t test, two-tailed. D U20S cells transduced with lentiviruses encoding Flag-ATG4Bwt or Flag-ATG4BC78S were treated with H2O2 and assessed for oxidation of ATG4B by PEG-switch assays. Bar graph shows quantification of Flag-ATG4B oxidation from treated U20S and bars represent mean ± SD of three independent experiments, and each symbol represents a single experiment. One-way ANOVA test. E Human macrophages transduced with lentiviruses encoding Flag-ATG4Bwt or Flag-ATG4BC78S were treated with H2O2 and assessed for oxidation of ATG4B by PEG-switch assays. Bar graph shows quantification of Flag-ATG4B oxidation from treated human macrophages and bars represent mean ± SD of three independent experiments, and each symbol represents a single experiment. N.D stands for not detected. Source data are provided as a Source Data file.
Fig. 5
Fig. 5. Inhibition of ATG4B-delipidation activity sustains MHC class II antigen presentation.
Macrophages transduced with the indicated lentiviruses encoding Flag, Flag-ATG4Bwt, or Flag-ATG4BC78S were investigated. A Transduced macrophages were stimulated with Candida (C.) albicans extract for 6 h and the expression of LC3B was analyzed by western blot. Bar graph shows the level of LC3B-II expression normalized to vinculin. All conditions are normalized to each unstimulated condition (US), which is set to 1. Bars represent mean ± SD of three independent experiments, Mann–Whitney test, two-tailed. B Transduced macrophages were stimulated with C. albicans extract-coated beads for 6 h and then stained for LC3 (red). Representative images from three independent experiments, scale bars 5 µm, and inserts are zoomed 5× from white-framed regions of the original images. Bar graph shows the percentage of cells with or without LAPosomes. Bars represent the mean ± SD from three independent experiments, and each symbol represents a single experiment. One-way ANOVA test. C Experimental outline of MHC class II antigen-presentation assay. We created this diagram using the free online platform Smart Servier Medical Art. D ELISA assays on supernatants of a C. albicans-specific CD4+ T-cell clone cocultured with MHC class II matched macrophages transduced with the indicated Flag tagged constructs. Transduced macrophages were pulsed with C. albicans extract. Time indicated below the graph corresponds to the resting time of the pulsed macrophages before coculture. Scatter plot represents the IFNγ production normalized to unstimulated conditions (US) from five independent experiments and only values above the detection limit are displayed. Each symbol represents a single experiment. Ratio paired Student’s t test, two-tailed. E ELISA on supernatants of whole blood memory CD4+ T cells with autologous macrophages transduced with the indicated Flag tagged constructs. Transduced macrophages were pulsed with C. albicans extract. Time indicated below the graph corresponds to the resting time of the pulsed macrophages before coculture. Scatter plot represents the IL-17A production normalized to unstimulated conditions (US) from five independent experiments with five different donors and each symbol represents a biological replicate. Kruskal–Wallis test. F Macrophages transduced with the indicated lentiviruses were stimulated with C. albicans extract for 4 h. The macrophages were washed and then incubated for 18 h without stimuli or directly analyzed by FACS. Scatter plot from four independent experiments and each symbol represents a different experiment. Source data are provided as a Source Data file.

Comment in

Similar articles

Cited by

References

    1. Levine B, Kroemer G. Biological functions of autophagy genes: a disease perspective. Cell. 2019;176:11–42. doi: 10.1016/j.cell.2018.09.048. - DOI - PMC - PubMed
    1. Münz C. Enhancing immunity through autophagy. Annu. Rev. Immunol. 2009;27:423–449. doi: 10.1146/annurev.immunol.021908.132537. - DOI - PubMed
    1. Loi M, et al. Macroautophagy proteins control MHC class I levels on dendritic cells and shape anti-viral CD8+ T cell responses. Cell Rep. 2016;15:1076–1087. doi: 10.1016/j.celrep.2016.04.002. - DOI - PubMed
    1. Keller CW, et al. ATG-dependent phagocytosis in dendritic cells drives myelin-specific CD4+ T cell pathogenicity during CNS inflammation. Proc. Natl Acad. Sci. USA. 2017;114:E11228–E11237. doi: 10.1073/pnas.1713664114. - DOI - PMC - PubMed
    1. Gannagé M, da Silva RB, Münz C. Antigen processing for MHC presentation via macroautophagy. Methods Mol. Biol. 2013;960:473–488. doi: 10.1007/978-1-62703-218-6_35. - DOI - PubMed

Publication types

MeSH terms