. 2021 Mar 9;12(1):1502.
doi: 10.1038/s41467-021-21783-3.

Time-resolved single-cell analysis of Brca1 associated mammary tumourigenesis reveals aberrant differentiation of luminal progenitors

Affiliations

Time-resolved single-cell analysis of Brca1 associated mammary tumourigenesis reveals aberrant differentiation of luminal progenitors

Karsten Bach et al. Nat Commun. .

Abstract

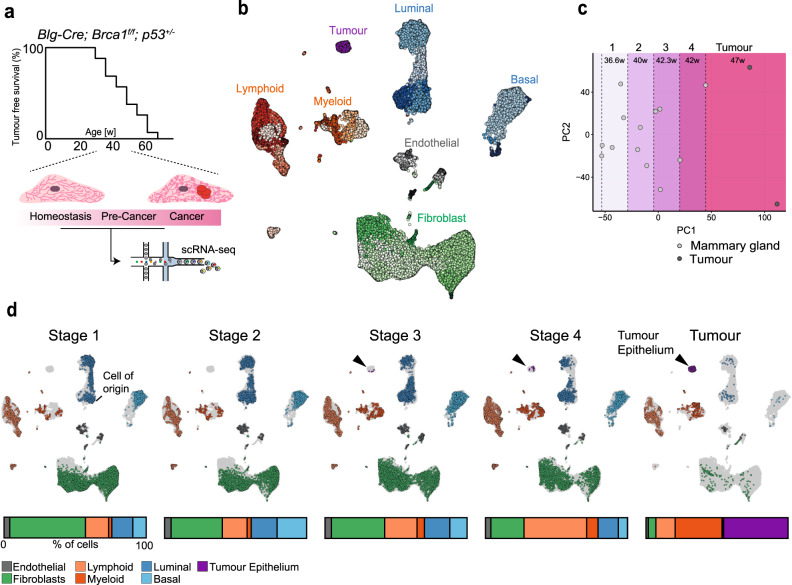
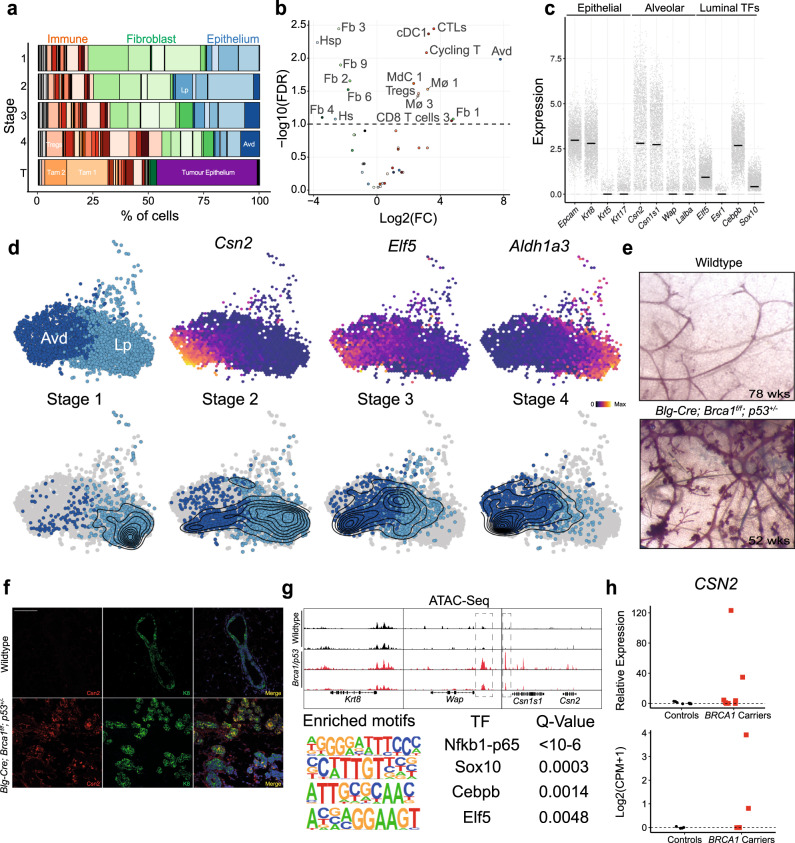
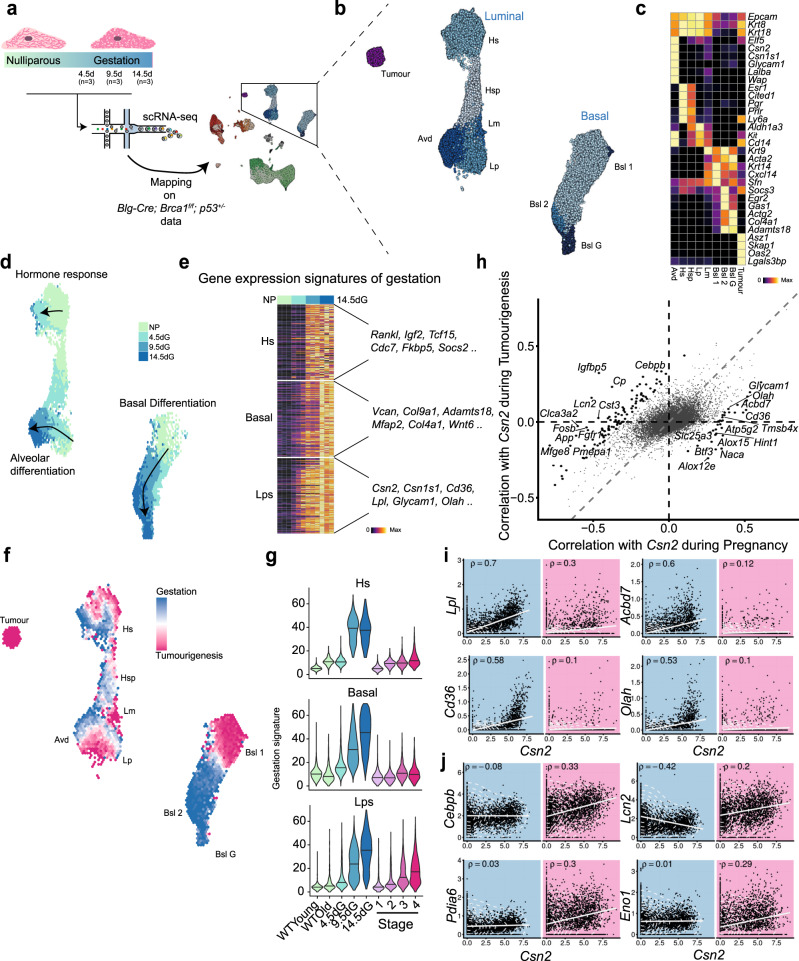
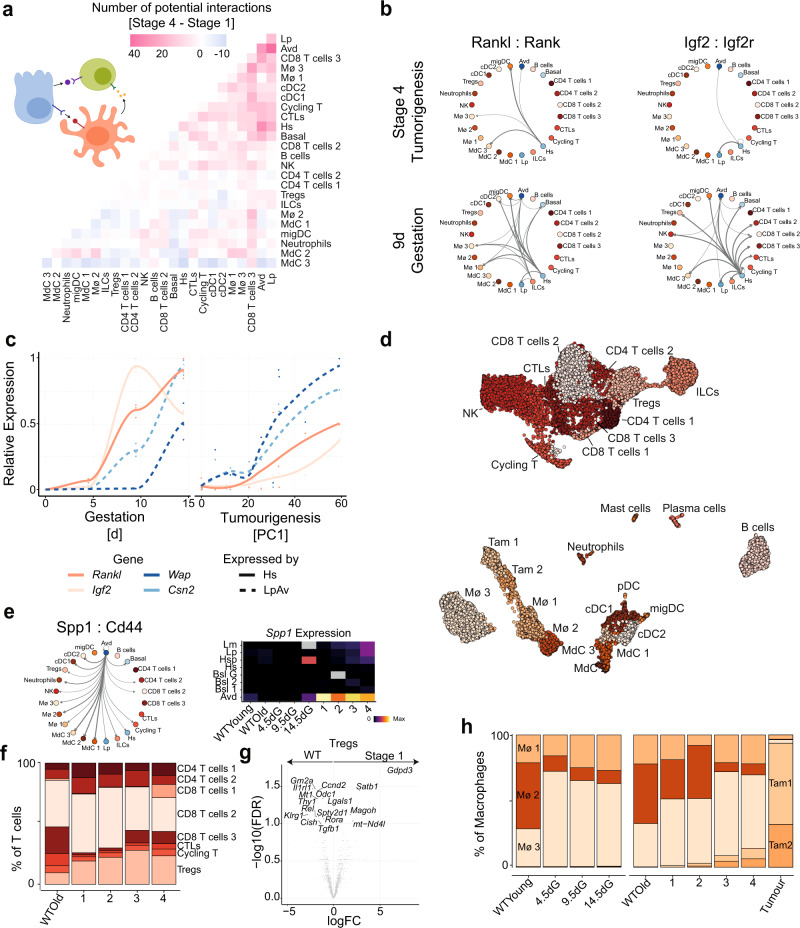
It is unclear how genetic aberrations impact the state of nascent tumour cells and their microenvironment. BRCA1 driven triple negative breast cancer (TNBC) has been shown to arise from luminal progenitors yet little is known about how BRCA1 loss-of-function (LOF) and concomitant mutations affect the luminal progenitor cell state. Here we demonstrate how time-resolved single-cell profiling of genetically engineered mouse models before tumour formation can address this challenge. We found that perturbing Brca1/p53 in luminal progenitors induces aberrant alveolar differentiation pre-malignancy accompanied by pro-tumourigenic changes in the immune compartment. Unlike alveolar differentiation during gestation, this process is cell autonomous and characterised by the dysregulation of transcription factors driving alveologenesis. Based on our data we propose a model where Brca1/p53 LOF inadvertently promotes a differentiation program hardwired in luminal progenitors, highlighting the deterministic role of the cell-of-origin and offering a potential explanation for the tissue specificity of BRCA1 tumours.


Conflict of interest statement

The authors declare no competing interests.

Figures

Fig. 1
Fig. 1. A time-resolved view of TNBC development in the Blg-Cre; Brca1f/f; p53+/− mouse model at single-cell level.
a Schematic overview of the experimental design. Mammary glands from 13 animals between 30 and 48 weeks of age as well as two fully developed tumours were prepared for scRNA sequencing after depleting dead cells. b UMAP of all samples, including wild-type controls, cells are coloured by cell type annotation. For the complete annotation see Supplementary Fig. 3b. c Principal component analysis computed on the pseudo-bulked, normalised and log-transformed counts from all samples of the Blg-Cre; Brca1f/f; p53+/ animals. Dashed lines highlight the boundaries of the four stages pre-malignancy and the tumour stage. The mean age in each stage is noted at the top of the plot (Stage 1: 36.6w [30–41], Stage 2: 40w [38–41], Stage 3 42.3w [33–48], Stage 4: 42w [38–46], Tumour: 47w [46–48]). d UMAP from b subsetted by the stages identified in c. Cells are coloured by cell compartments. Grey cells in the background represent cells from all samples not present at the stage of interest. Bars underneath the UMAPs represent the tissue composition at each stage. PC principal component.
Fig. 2
Fig. 2. Luminal progenitor cells aberrantly differentiate towards an alveolar fate during BRCA1 LOF-dependent TNBC development.
a Cell type composition of all Blg-Cre; Brca1f/f; p53+/− samples grouped by stages. Key cell types are highlighted, for full annotation see Supplementary Fig. 3a. b Volcano plot showing the results of the differential abundance test during tumour development from stage 1 to 4. The logFC represents the coefficient of a robust regression of normalised log-transformed cell type abundance on the 0–1 scaled PC1 values from Fig. 1c. Colour scheme corresponds to a and Supplementary Fig. 3. c Gene expression of various lineage-markers for the Avd cluster. Expression values represent normalised, log-transformed counts. The horizontal line depicts the median expression. Expression values are derived from n = 15 independent animals. d UMAP coordinates from Fig. 1, only showing the Lp and Avd cluster. The top row highlights the location of the two clusters as well as gene expression of three marker genes. The bottom row is facetted by stages with overlaid density estimate. e Wholemounts of mammary glands from wild-type and Blg-Cre; Brca1f/f; p53+/− animals. Weeks (wks) of age are shown in the bottom right corner. Additional examples are shown in Supplementary Fig. 3c. f Immunofluorescence staining for Csn2 (red), Cytokeratin-8 (K8, green) and DAPI (blue) from wild-type (top row) and Blg-Cre; Brca1f/f; p53+/− (bottom row) mammary glands. Scale bars represent 100 µm. Ten individual images from three independent animals were analysed. g ATAC-sequencing data from sorted luminal progenitor cells of wild-type (top) and Blg-Cre; Brca1f/f; p53+/− (bottom) animals. h Expression of CSN2 in sorted luminal progenitors from either reduction mammoplasties of healthy controls or prophylactic mastectomies from BRCA1 carriers. The top panel shows expression in eight controls and eight BRCA1 carriers of CSN2 as measured by qPCR. The bottom panel shows expression in four controls vs. four BRCA1 carriers as measured by RNA-sequencing of sorted luminal progenitors. FC fold change, TF transcription factor, CPM counts per million. Source data for the qPCR is provided as a source data file.
Fig. 3
Fig. 3. The aberrant differentiation of luminal progenitors in the context of homoeostatic differentiation during gestation.
a Schematic overview of the experimental strategy. Mammary glands of 12 animals from four time points (Nulliparous, 4.5dG, 9.5dG, 14.5dG; three samples and a minimum of 18,000 cells per time point) were digested to prepare single-cell suspensions for scRNA sequencing after depletion of dead cells. The dataset was integrated with the tumourigenesis dataset presented in Fig. 1. b Same UMAP as in a showing only the epithelial compartment. c Gene expression of marker genes for all epithelial cell types. Values are scaled from 0 to 1 per row. d Binned UMAP from b only showing cells collected from the gestation time points, coloured by the time point at which the majority of the cells in the respective bin were collected. e Gene signatures of gestation for each of the three main epithelial compartments defined as the top 100 up-regulated genes between 14.5dG (Basal and Lps) or 9.5dG (Hs) and nulliparous samples. f Binned UMAP from b coloured by the percentage of cells in each bin deriving from the tumourigenesis dataset with blue representing 100% of cells deriving from the gestation samples and purple representing 100% of cells derived from the Blg-Cre; Brca1f/f; p53+/− animals. Datasets were down sampled to the same number of cells. g Summed expression of signatures from e across all conditions. h Differential correlation analysis with Csn2 during tumourigenesis and gestation computed on all Lps and Avds. The values represent the distance to median correlation in the two conditions. Highlighted dots represent genes with and FDR < 0.001 and |Δρ|> 0.3. i, j Some genes from h are highlighted. The left (blue) panel represents the correlation with Csn2 (X-axis) during gestation and the right (purple) plot the correlation during tumourigenesis. Gene expression values are normalised, log-transformed counts. The line represents a linear, least-square regression and the dashed lines a 2D density estimate. dG day gestation.
Fig. 4
Fig. 4. Aberrant differentiation of luminal progenitor cells is accompanied by an altered microenvironment with tumour-promoting characteristics.
a Net difference in the number of potential interactions between any immune and epithelial cell types between stage 4 and stage 1. The number of potential interactions was estimated in each stage using cellphoneDB at an FDR of 0.05. b Graphs representing potential interactions for Rankl:Rank and Igf2:Igf2r for Stage 4 of tumourigenesis (top row) and 9dG (bottom row). Nodes represent cell types and edges represent significant interactions with the width of the edge illustrating the mean expression of ligand and receptor. The arrow of the edges represents the direction from ligand expressing to receptor expressing. c Gene expression for the paracrine signalling factors Rankl and Igf2 in hormone-sensing cells and the alveolar markers Csn2 and Wap in luminal progenitors and alveolar cells. Expression is scaled across gestation and tumourigenesis to 0 and 1. In the tumourigenesis panel, the X-axis represents the values of PC1 that were scaled by (PC1 + min(PC1))/max(PC1−min(PC1)) × 100 d UMAP for all immune cell types captured in the gestation and tumourigenesis dataset. e Interaction plot as in b for Spp1:Cd44 during stage 1 of tumourigenesis. Right panel shows mean log expression of Spp1 across epithelial cell types in the mammary gland across various conditions. Grey represents conditions with no cells of that particular cell type. f Barplot of relative frequency of T-lymphocytes during tumourigenesis. g Differential expression analysis of Tregs from old wild-type animals and Tregs from stage 1. h Distribution of macrophage populations during gestation and tumourigenesis as in g. Data in barplots represent the mean per stage. For all pregnancy time points n = 3 independent animals were analysed; for the tumourigenesis stages the sample sizes are specified in Supplementary Fig. 1a. FC fold change, FDR false discovery rate.

References

    1. Lim E, et al. Aberrant luminal progenitors as the candidate target population for basal tumor development in BRCA1 mutation carriers. Nat. Med. 2009;15:907–913. doi: 10.1038/nm.2000. - DOI - PubMed
    1. Molyneux G, et al. BRCA1 basal-like breast cancers originate from luminal epithelial progenitors and not from basal stem cells. Cell Stem Cell. 2010;7:403–417. doi: 10.1016/j.stem.2010.07.010. - DOI - PubMed
    1. Bach K, et al. Differentiation dynamics of mammary epithelial cells revealed by single-cell RNA sequencing. Nat. Commun. 2017;8:2128. doi: 10.1038/s41467-017-02001-5. - DOI - PMC - PubMed
    1. Watson CJ, Khaled WT. Mammary development in the embryo and adult: a journey of morphogenesis and commitment. Development. 2008;135:995–1003. doi: 10.1242/dev.005439. - DOI - PubMed
    1. Poole AJ, et al. Prevention of Brca1-mediated mammary tumorigenesis in mice by a progesterone antagonist. Science. 2006;314:1467–1470. doi: 10.1126/science.1130471. - DOI - PubMed

Publication types

MeSH terms