

Characterisation, identification, clustering, and classification of disease
- PMID: 33686097
- PMCID: PMC7940639
- DOI: 10.1038/s41598-021-84860-z
Characterisation, identification, clustering, and classification of disease
Abstract
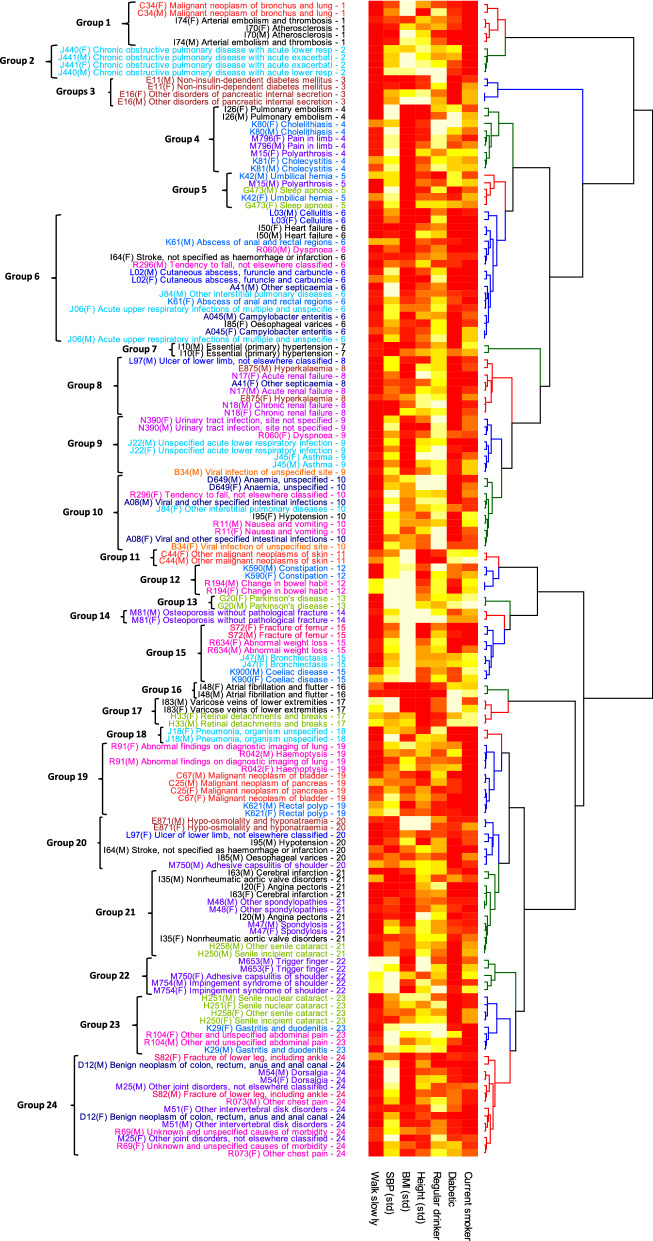
The importance of quantifying the distribution and determinants of multimorbidity has prompted novel data-driven classifications of disease. Applications have included improved statistical power and refined prognoses for a range of respiratory, infectious, autoimmune, and neurological diseases, with studies using molecular information, age of disease incidence, and sequences of disease onset ("disease trajectories") to classify disease clusters. Here we consider whether easily measured risk factors such as height and BMI can effectively characterise diseases in UK Biobank data, combining established statistical methods in new but rigorous ways to provide clinically relevant comparisons and clusters of disease. Over 400 common diseases were selected for analysis using clinical and epidemiological criteria, and conventional proportional hazards models were used to estimate associations with 12 established risk factors. Several diseases had strongly sex-dependent associations of disease risk with BMI. Importantly, a large proportion of diseases affecting both sexes could be identified by their risk factors, and equivalent diseases tended to cluster adjacently. These included 10 diseases presently classified as "Symptoms, signs, and abnormal clinical and laboratory findings, not elsewhere classified". Many clusters are associated with a shared, known pathogenesis, others suggest likely but presently unconfirmed causes. The specificity of associations and shared pathogenesis of many clustered diseases provide a new perspective on the interactions between biological pathways, risk factors, and patterns of disease such as multimorbidity.
Conflict of interest statement
The authors declare no competing interests.
Figures
References
-
- Graunt, C. J. Natural and Political OBSERVATIONS Mentioned in a following INDEX, and made upon the Bills of Mortality (Printed by John Martyn, Printer to the Royal Society, at the Sign of the Bell in St. Paul’s Church-yard. MDCLXXVI., 1665). Appendix—The table of casualties—Table of Casualties in Economic Writings (vol. 2) by William Petty (1899), between p. 406 and 407.
-
- Organization, W. H. International statistical classification of diseases and related health problems 10th revision (2016).
-
- Organization, W. H. ICD-11 for mortality and morbidity statistics (icd-11 mms) 2018 version (2018).
-
- Editorial. Icd-11. Lancet393, 2275. 10.1016/s0140-6736(19)31205-x (2019).
Publication types
MeSH terms
Grants and funding
LinkOut - more resources
Full Text Sources
Other Literature Sources
