

Optimal proteome allocation and the temperature dependence of microbial growth laws
- PMID: 33686098
- PMCID: PMC7940435
- DOI: 10.1038/s41540-021-00172-y
Optimal proteome allocation and the temperature dependence of microbial growth laws
Abstract
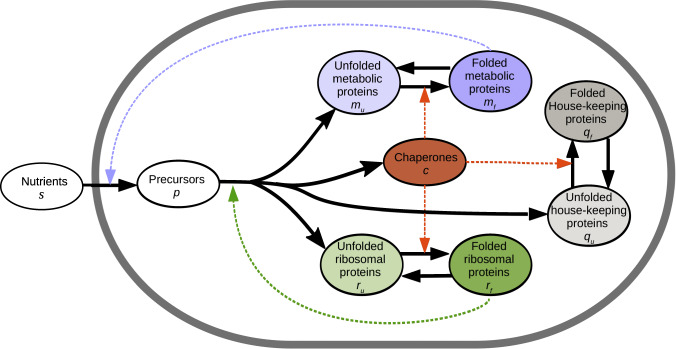
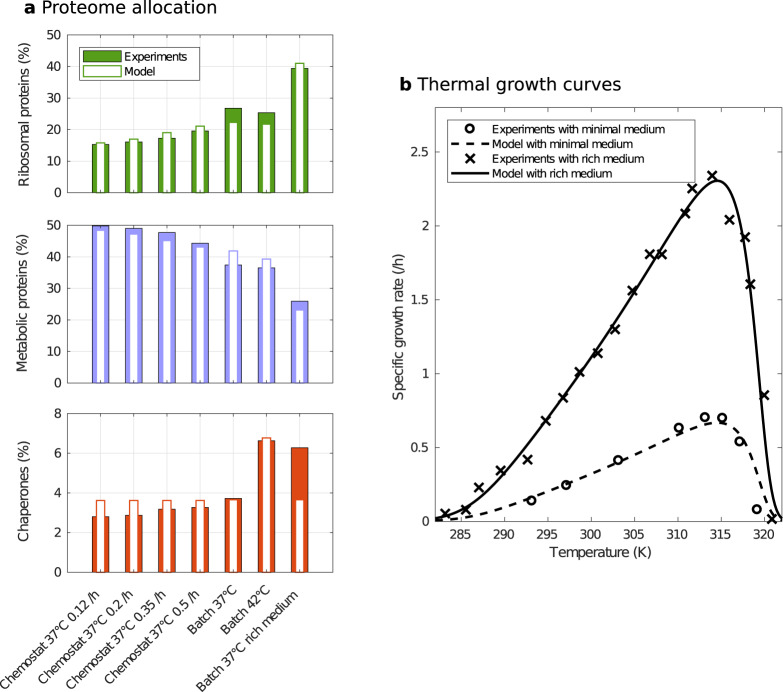
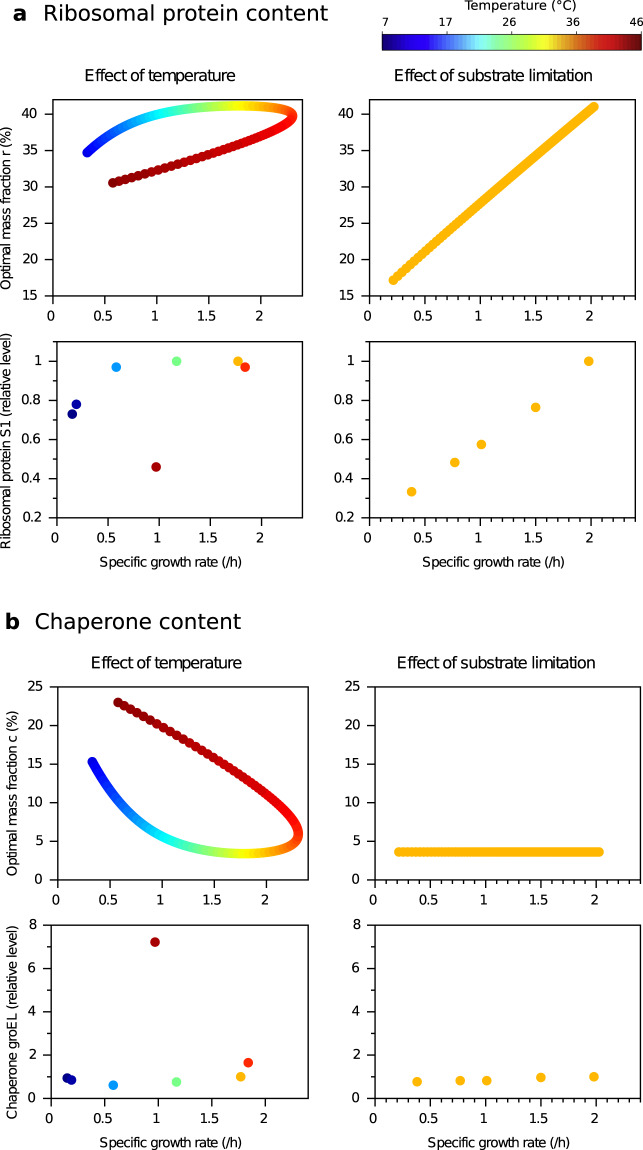
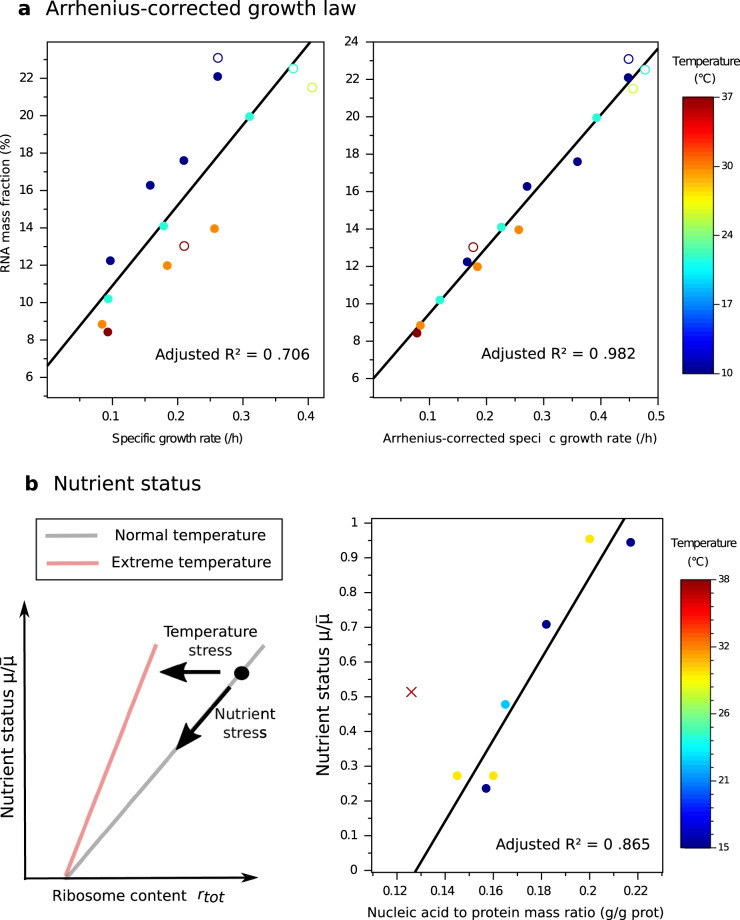
Although the effect of temperature on microbial growth has been widely studied, the role of proteome allocation in bringing about temperature-induced changes remains elusive. To tackle this problem, we propose a coarse-grained model of microbial growth, including the processes of temperature-sensitive protein unfolding and chaperone-assisted (re)folding. We determine the proteome sector allocation that maximizes balanced growth rate as a function of nutrient limitation and temperature. Calibrated with quantitative proteomic data for Escherichia coli, the model allows us to clarify general principles of temperature-dependent proteome allocation and formulate generalized growth laws. The same activation energy for metabolic enzymes and ribosomes leads to an Arrhenius increase in growth rate at constant proteome composition over a large range of temperatures, whereas at extreme temperatures resources are diverted away from growth to chaperone-mediated stress responses. Our approach points at risks and possible remedies for the use of ribosome content to characterize complex ecosystems with temperature variation.
Conflict of interest statement
The authors declare no competing interests.
Figures
Similar articles
-
Modeling the cost and benefit of proteome regulation in a growing bacterial cell.Phys Biol. 2018 May 9;15(4):046005. doi: 10.1088/1478-3975/aabe43. Phys Biol. 2018. PMID: 29658492
-
Thermosensitivity of growth is determined by chaperone-mediated proteome reallocation.Proc Natl Acad Sci U S A. 2017 Oct 24;114(43):11548-11553. doi: 10.1073/pnas.1705524114. Epub 2017 Oct 10. Proc Natl Acad Sci U S A. 2017. PMID: 29073085 Free PMC article.
-
The catabolic nature of fermentative substrates influences proteomic rewiring in Escherichia coli under anoxic growth.Microb Cell Fact. 2025 Mar 25;24(1):71. doi: 10.1186/s12934-025-02658-4. Microb Cell Fact. 2025. PMID: 40133894 Free PMC article.
-
Probing the molecular physiology of the microbial organism, Escherichia coli using proteomics.Adv Biochem Eng Biotechnol. 2003;83:27-55. Adv Biochem Eng Biotechnol. 2003. PMID: 12934925 Review.
-
Cellular resource allocation strategies for cell size and shape control in bacteria.FEBS J. 2022 Dec;289(24):7891-7906. doi: 10.1111/febs.16234. Epub 2021 Oct 30. FEBS J. 2022. PMID: 34665933 Free PMC article. Review.
Cited by
-
Distantly related bacteria share a rigid proteome allocation strategy with flexible enzyme kinetics.Proc Natl Acad Sci U S A. 2025 May 6;122(18):e2427091122. doi: 10.1073/pnas.2427091122. Epub 2025 Apr 29. Proc Natl Acad Sci U S A. 2025. PMID: 40299698 Free PMC article.
-
An optimal regulation of fluxes dictates microbial growth in and out of steady state.Elife. 2023 Mar 10;12:e84878. doi: 10.7554/eLife.84878. Elife. 2023. PMID: 36896805 Free PMC article.
-
Resource allocation accounts for the large variability of rate-yield phenotypes across bacterial strains.Elife. 2023 May 31;12:e79815. doi: 10.7554/eLife.79815. Elife. 2023. PMID: 37255080 Free PMC article.
-
Biosensor characterization: formal methods from the perspective of proteome fractions.Synth Biol (Oxf). 2025 Feb 12;10(1):ysaf002. doi: 10.1093/synbio/ysaf002. eCollection 2025. Synth Biol (Oxf). 2025. PMID: 39959635 Free PMC article.
-
Thermal acclimation of methanotrophs from the genus Methylobacter.ISME J. 2023 Apr;17(4):502-513. doi: 10.1038/s41396-023-01363-7. Epub 2023 Jan 18. ISME J. 2023. PMID: 36650275 Free PMC article.
References
-
- Madigan, M.T. et al. Brock biology of microorganisms, vol. 11 (Prentice Hall, 1997).
Publication types
MeSH terms
Substances
LinkOut - more resources
Full Text Sources
Other Literature Sources
