. 2021 Mar 8;11(1):5429.
doi: 10.1038/s41598-021-84817-2.

Pharmacological targeting of host chaperones protects from pertussis toxin in vitro and in vivo

Affiliations

Pharmacological targeting of host chaperones protects from pertussis toxin in vitro and in vivo

Katharina Ernst et al. Sci Rep. .

Abstract

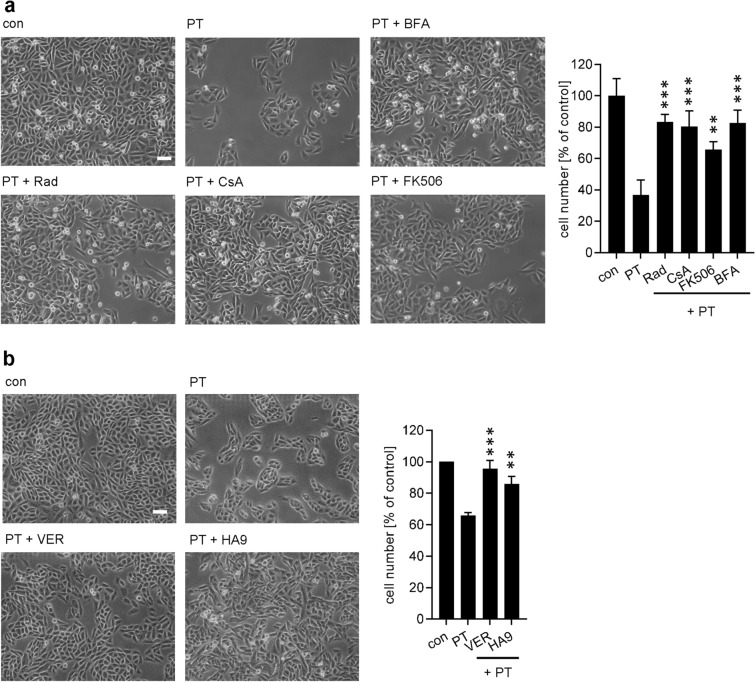
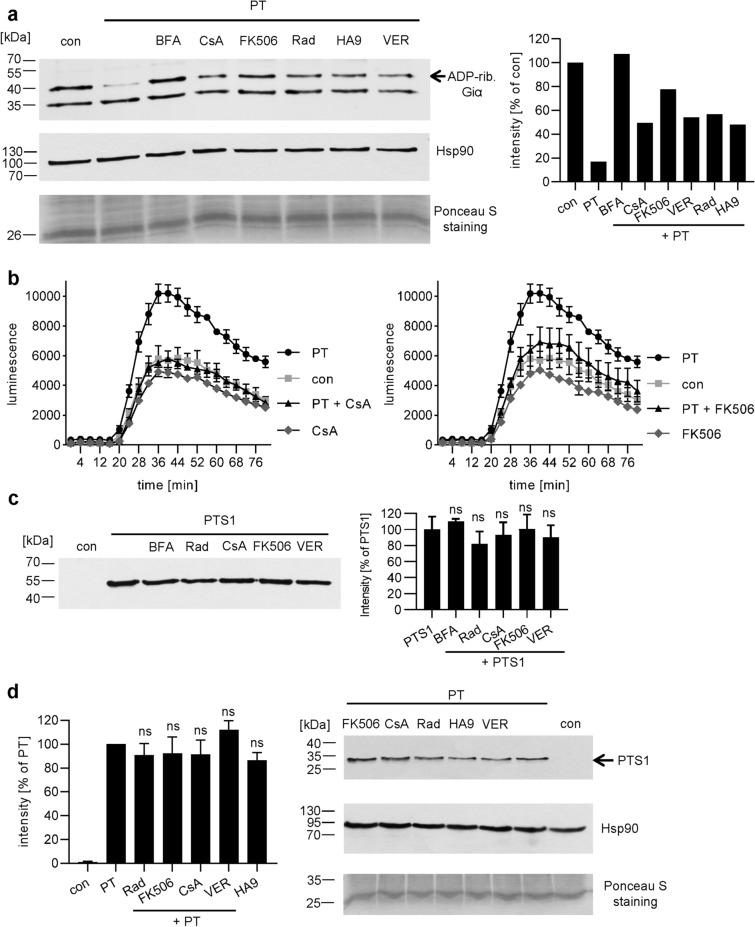
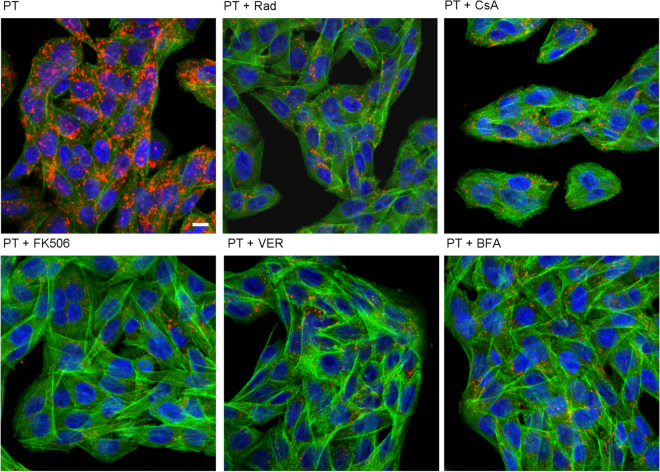
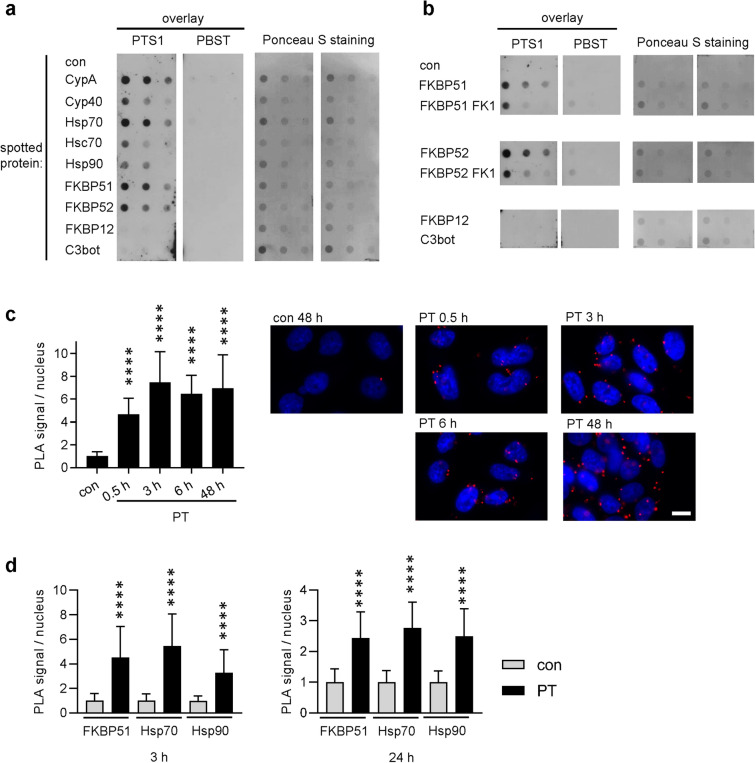
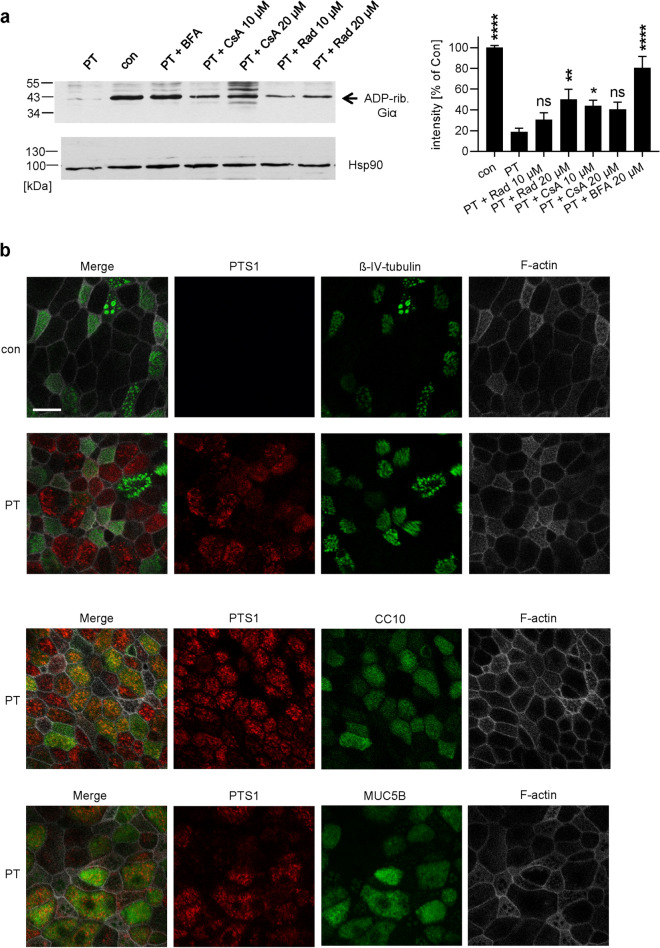
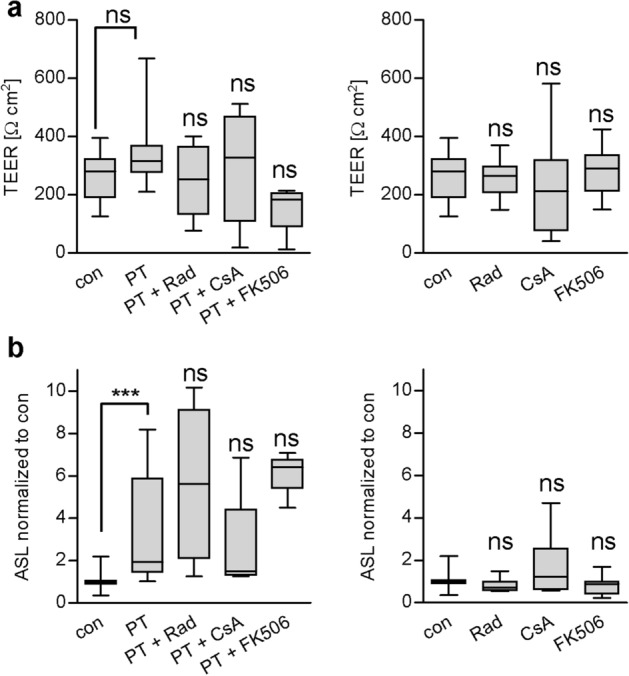
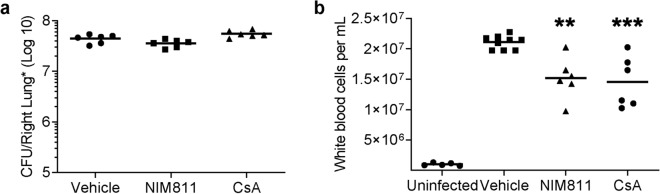
Whooping cough is caused by Bordetella pertussis that releases pertussis toxin (PT) which comprises enzyme A-subunit PTS1 and binding/transport B-subunit. After receptor-mediated endocytosis, PT reaches the endoplasmic reticulum from where unfolded PTS1 is transported to the cytosol. PTS1 ADP-ribosylates G-protein α-subunits resulting in increased cAMP signaling. Here, a role of target cell chaperones Hsp90, Hsp70, cyclophilins and FK506-binding proteins for cytosolic PTS1-uptake is demonstrated. PTS1 specifically and directly interacts with chaperones in vitro and in cells. Specific pharmacological chaperone inhibition protects CHO-K1, human primary airway basal cells and a fully differentiated airway epithelium from PT-intoxication by reducing intracellular PTS1-amounts without affecting cell binding or enzyme activity. PT is internalized by human airway epithelium secretory but not ciliated cells and leads to increase of apical surface liquid. Cyclophilin-inhibitors reduced leukocytosis in infant mouse model of pertussis, indicating their promising potential for developing novel therapeutic strategies against whooping cough.


Conflict of interest statement

The authors declare no competing interests.

Figures

Figure 1
Figure 1
(a) Effect of BFA, Rad, FK506 and CsA on the intoxication of CHO-K1 cells with PT. CHO-K1 cells were pre-incubated with 10 µM BFA, Rad, FK506 or CsA or left untreated for control. After 30 min 10 ng/ml PT were added. 1.5 h later the culture medium was removed, and cells were further incubated at 37 °C and 5% CO2 in fresh medium that did not contain PT or any inhibitor. Pictures were taken after 18 h. A quantitative analysis of total cell number of CHO-K1 cells is shown, values are normalized on control cells (n = 3, mean ± SD). (b) Pharmacological inhibition of Hsp70 activity protects cells from PT-intoxication. CHO-K1 cells were treated with VER (30 μM) or HA9 (20 µM) for 30 min and then intoxicated with PT (10 ng/ml) for 18 h. Pictures were taken, and cell numbers were determined as described in A. Significance was tested by one-way ANOVA with Dunnett’s multiple comparisons test and refers to samples treated with PT only (*p < 0.05, **p < 0.01, ***p < 0.001). Scale bar = 50 µm.
Figure 2
Figure 2
(a) Effect of Rad, CsA, FK506, VER and HA9 on the ADP-ribosylation status of Giα in PT-treated CHO-K1 cells. Cells were pre-incubated with 20 µM of Rad, CsA or FK506, 30 µM VER, 100 µM HA9 or 20 µM BFA for control for 30 min or left untreated. Then, cells were challenged with 20 ng/ml PT for 3 h. Cells were lysed and ADP-ribosylation status of Giα was analyzed. Biotin-labeled (i.e., ADP-ribosylated) Giα was detected. Comparable protein loading was confirmed by Hsp90 and Ponceau S staining. Western blot signals were quantified and normalized to protein loading (Ponceau S). One representative result is shown (n = 3). For uncropped blots see Supplemental Fig. S10. (b) Effect of chaperone inhibitors on intracellular cAMP levels in PT-treated cells. iGIST sensor cells (HEK293 cells expressing SSTR2 and luminescent cAMP probe) were incubated with CsA or FK506 (5 µM) or left untreated for control for 30 min. 500 ng/ml PT were added for 3 h and afterwards inducing medium was added to start the luminescence reaction. A baseline was recorded for 15 min. Then, cells were treated with forskolin to activate adenylate cyclase and with octreotide to activate SSTR2. Luminescence was recorded for 1 h. Values are given as mean ± SD. Results from one representative experiment are shown. (c) Effect of Rad, CsA, FK506 and VER on enzyme activity in vitro. Recombinant Giα (0.5 µM) was pre-incubated with 10 µM Rad, CsA, 20 µM FK506 or VER for 30 min or with buffer for control. After 30 min rPTxS1 (50 nM) and 1 µM biotin-labeled NAD+ were added and incubated for 40 min at room temperature. Samples were subjected to SDS-PAGE, blotted and ADP-ribosylated Giα was detected with Strep-POD. Western blot signals were quantified. Values are given as percent of samples treated with PTS1 only (n = 3 values from 3 independent experiments, mean ± SD). Significance was tested one-way ANOVA with Dunnett’s multiple comparisons test and refers to samples treated with PTS1 only (ns not significant). For uncropped blot see Supplemental Fig. S11. (d) Influence of Rad, CsA, FK506 and VER on receptor binding of PT to CHO-K1 cells. CHO-K1 cells were pre-incubated with 20 µM Rad, CsA, FK506 or 30 µM VER or left untreated. After 30 min cells were cooled to 4 °C for 15 min. Then 500 ng/ml PT were added for 30 min at 4 °C. After washing, cells were lysed with Laemmli buffer at 95 °C. Cell-bound PT was detected via an anti-PTS1 antibody in Western Blot. Comparable protein loading was confirmed with Hsp90 and Ponceau-S-staining. Quantification of Western blot signals and one representative Western blot is shown. Values were normalized on the amount of loaded protein (Ponceau S) and are given as percent of PT binding (second bar from left). (n = 4, mean ± SEM). Significance was tested by one-way ANOVA with Dunnett’s multiple comparisons test and refers to samples treated with PT only (ns not significant). For uncropped blots see Supplemental Fig. S12.
Figure 3
Figure 3
In the presence of inhibitors of Hsp90/Hsp70 and PPIases less free PTS1 is detected in CHO-K1 cells. CHO-K1 cells were pre-incubated with CsA, FK506, Rad (20 µM) or VER (30 µM) for 30 min. 20 µM BFA were used as control. Then, cells were challenged with 1 µg/ml PT and 1 h later medium was exchanged. After 24 h, cells were fixed, permeabilized and blocked. Subsequently, cells were probed with an anti-PTS1 antibody, Hoechst and phalloidin-FITC for F-actin staining. Pictures were taken with a Zeiss LSM-710 confocal microscope. Red = PTS1, green = F-actin, blue = nucleus, scale bar = 10 µm.
Figure 4
Figure 4
(a) PTS1 interacts with chaperones and PPIases in vitro. Purified chaperones/PPIases were spotted two times onto a nitrocellulose membrane in decreasing concentrations (1 µg, 0.5 µg, 0.25 µg). PBS and C3 toxin from C. botulinum were used as negative controls. Membrane was cut and overlay with His-PTS1 (200 ng/ml) or PBST was performed. After extensive washing, bound PTS1 was detected with a specific antibody. PTS1- and PBST-overlayed membranes were detected on the same X-ray film and images were cropped for display purposes only. Comparable amounts of spotted protein were confirmed by Ponceau S-staining. (b) PTS1 binds to the isolated PPIase domains of FKBP51/52. FKBP51/52 and their FK1 fragments i.e. isolated PPIase domains were spotted onto a nitrocellulose membrane. The experiment was further conducted as described in A. All signals were detected on the same X-ray film and images were cropped for display purposes only. (c) Cyp40 interacts with PTS1 in cells. CHO-K1 cells were incubated on ice with PT (5 µg/ml) for 30 min to enable binding or left untreated for control. After washing, the cells were further incubated for 0.5 h, 3 h, 6 h and 48 h at 37 °C. Cells were fixed and fluorescence-based PLA assay was performed according to the manufacturer’s manual. PLA signals represent one protein interaction event of PTS1 and Cyp40 and were counted from fluorescence pictures (n = 10 pictures per condition, mean ± SD) with ImageJ. Values were normalized to the mean of the control samples. Significance was tested by one-way ANOVA with Dunnett’s multiple comparisons test and refers to untreated control samples (****p < 0.0001). One representative image is shown for each condition (blue = nucleus, red = PLA signal). Scale bar = 10 µm. (d) FKBP51, Hsp70 and Hsp90 interact with PTS1 in cells. CHO-K1 cells were treated with PT (3 µg/ml) for 3 h (left) or 24 h (right) at 37 °C. Then, cells were fixed, and fluorescence-based PLA assay was performed according to the manufacturer’s manual. PLA signals were counted from fluorescence pictures (n = 20 images per condition from at least 2 independent experiments, mean ± SD) with ImageJ. Values were normalized to the mean of the control samples. Significance was tested by Mann–Whitney test and refers to the respective untreated controls (****p < 0.0001).
Figure 5
Figure 5
(a) Rad and CsA inhibit ADP-ribosylation of Giα in PT-treated basal cells. Basal cells were pre-incubated with Rad, CsA or BFA (20 µM) for 45 min or left untreated for control (con). Subsequently, 10 ng/ml PT was added for 4 h and the ADP-ribosylation status of Giα was determined as described before. A representative Western blot result is shown. Comparable protein loading was confirmed by Ponceau S (not shown) and Hsp90 staining. Western blot signals were quantified and normalized to protein loading (n = 8 independent experiments, mean ± SEM). Significance was tested by one-way ANOVA with Dunnett’s multiple comparisons test and refers to samples treated with PT only (****p < 0.0001, **p < 0.01, *p < 0.05, ns not significant). For uncropped blots see Supplemental Fig. S13. (b) PTS1 is detected in secretory (CC10+, MUC5B+) cells but not in ciliated (β-IV-tubulin+) cells. hBAECs were incubated with PT (20 µg/ml) from the apical side for at least 72 h or left untreated for control. Cells were fixed with 4% PFA. For permeabilization and quenching of autofluorescence, cells were treated with 0.2% saponin. F-actin was stained with phalloidin-FITC. PTS1, β-IV-tubulin, CC10 and Muc5B were stained with specific primary and fluorescence-labeled secondary antibodies, respectively. Pictures were taken with an inverted confocal microscope. Scale bar = 20 µm.
Figure 6
Figure 6
Effect of Rad, FK506 and CsA on uptake of PTS1 into hBAECs. hBAECs were pre-treated with respective inhibitors (20 µM) and then incubated with PT (20 µg/ml) from the apical side for 72 h. Cells were fixed with 4% PFA. For permeabilization and quenching of autofluorescence, cells were treated with 0.2% saponin. F-actin was stained with phalloidin-FITC. PTS1 and β-IV-tubulin were stained with specific primary and respective fluorescence-labeled secondary antibodies. Pictures were taken with a Cell Observer inverse microscope (Zeiss, Germany). Mean Gray Value Intensity was measured and plotted for PTS1 (after background subtraction) in PT and PT + inhibitor treated cultures. Values are given as mean ± SEM (n = 60 cells/condition). Significance was tested by Kruskal–Wallis test and refers to samples treated with only PT (***p < 0.001, ns not significant). Scale bar = 20 µm.
Figure 7
Figure 7
PT does not impair barrier function but increased apical surface liquid. (a) hBAECs were pre-incubated with Rad, CsA or FK506 (20 µM) for 30 min or left untreated. Then 20 µg/ml PT was added for 72 h or cells were left untreated. Transepithelial electrical resistance (TEER) was measured using CellZScope from NanoAnalytics. (b) hBAECs were treated as described in A. After 72 h the apical surface liquid was determined. Values were obtained from at least two independent experiments (n ≥ 4). Significance was tested by Kruskal–Wallis test and refers to samples treated with only PT or as indicated (***p < 0.001, ns not significant).
Figure 8
Figure 8
Cyclophilin inhibition reduces B. pertussis induced leukocytosis. Following aerosol infection 7-day old C57BL/6 pups were treated daily with vehicle, CsA (25 mg/kg) or NIM811 (25 mg/kg). No differences were determined in bacterial burden (a) however significant reduction in leukocytosis was noted in drug treated animals versus vehicle control (b). Each data point represents one animal. Significance was determined by one-way ANOVA with Dunnett’s multiple comparisons test (***p < 0.001, **p < 0.01 vs. vehicle). Bars represent mean values.

References

    1. Kilgore PE, Salim AM, Zervos MJ, Schmitt H-J. Pertussis: Microbiology, disease, treatment, and prevention. Clin. Microbiol. Rev. 2016;29:449–486. doi: 10.1128/CMR.00083-15. - DOI - PMC - PubMed
    1. Mattoo S, Cherry JD. Molecular pathogenesis, epidemiology, and clinical manifestations of respiratory infections due to Bordetella pertussis and other Bordetella subspecies. Clin. Microbiol. Rev. 2005;18:326–382. doi: 10.1128/CMR.18.2.326-382.2005. - DOI - PMC - PubMed
    1. Carbonetti NH. Pertussis leukocytosis: Mechanisms, clinical relevance and treatment. Pathog. Dis. 2016;74:ftw087. doi: 10.1093/femspd/ftw087. - DOI - PMC - PubMed
    1. Heininger U, Klich K, Stehr K, Cherry JD. Clinical findings in Bordetella pertussis infections: results of a prospective multicenter surveillance study. Pediatrics. 1997;100:E10. doi: 10.1542/peds.100.6.e10. - DOI - PubMed
    1. Publication WHO. Pertussis vaccines: WHO position paper—recommendations. Vaccine. 2011;29:2355–2356. doi: 10.1016/j.vaccine.2010.11.059. - DOI - PubMed

Publication types

MeSH terms

LinkOut - more resources