Comparative Study
. 2021 Mar 8;4(1):305.
doi: 10.1038/s42003-021-01799-7.

Genomic insights into the host specific adaptation of the Pneumocystis genus

Affiliations
Comparative Study

Genomic insights into the host specific adaptation of the Pneumocystis genus

Ousmane H Cissé et al. Commun Biol. .

Abstract

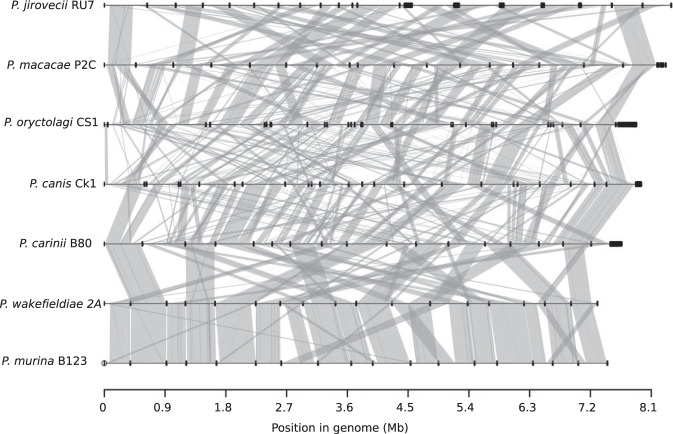
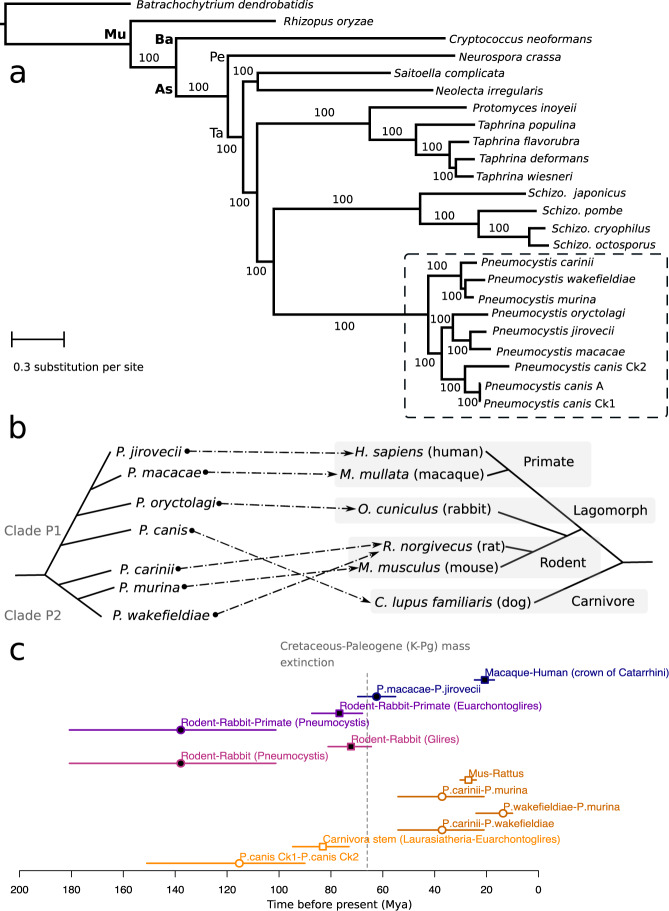
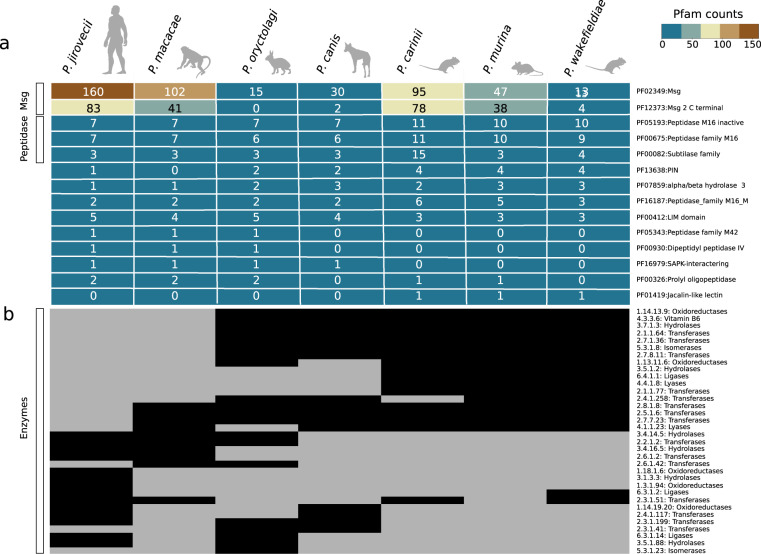
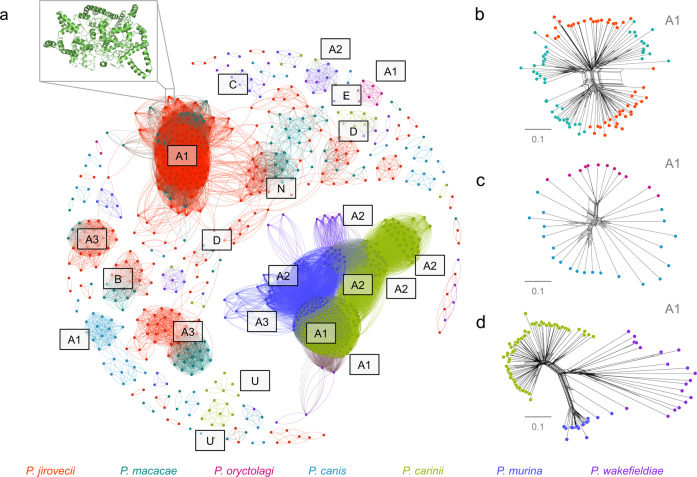
Pneumocystis jirovecii, the fungal agent of human Pneumocystis pneumonia, is closely related to macaque Pneumocystis. Little is known about other Pneumocystis species in distantly related mammals, none of which are capable of establishing infection in humans. The molecular basis of host specificity in Pneumocystis remains unknown as experiments are limited due to an inability to culture any species in vitro. To explore Pneumocystis evolutionary adaptations, we have sequenced the genomes of species infecting macaques, rabbits, dogs and rats and compared them to available genomes of species infecting humans, mice and rats. Complete whole genome sequence data enables analysis and robust phylogeny, identification of important genetic features of the host adaptation, and estimation of speciation timing relative to the rise of their mammalian hosts. Our data reveals insights into the evolution of P. jirovecii, the sole member of the genus able to infect humans.


Conflict of interest statement

The authors declare no competing interests.

Figures

Fig. 1
Fig. 1. Whole-genome structure and synteny among Pneumocystis species.
Species names and their genome assembly identifiers are shown on the left. Horizontal black lines on the right represent sequences of all scaffolds for each genome laid end-to-end, with their nucleotide positions indicated at the bottom. Dark thick squares represent short scaffolds. Syntenic regions between genomes are linked with vertical gray lines.
Fig. 2
Fig. 2. Phylogeny and divergence times of Pneumocystis species.
a Maximum likelihood phylogeny constructed using 106 single-copy genes based on 1000 replicates from 24 annotated fungal genome assemblies including nine from Pneumocystis (highlighted with a dashed box). Only one assembly is shown for each species except there are three for P. canis (assemblies Ck1, Ck2, and A). Bootstrap support (%) is presented on the branches. The fungal major phylogenetic phyla and subphyla are represented by their initials: As (Ascomycota), Ba (Basidiomycota), Pe (Pezizomycotina), Mu (Mucoromycota), and Ta (Taphrinomycotina). b Schematic representation of species phylogeny and association between Pneumocystis species and their respective mammalian hosts. The dashed arrows represent the specific parasite-host relationships. c Divergence times of Pneumocystis species and mammals (n = 12 taxonomic clades analyzed). Divergence time medians are represented as squares for hosts and as circles for Pneumocystis, and the horizontal lines represent the 95% confidence interval (CI) error bars, which are color-coded the same for each Pneumocystis and its host. Closed elements represent nodes that are different in term of divergence times (nonoverlapping confidence intervals) whereas open elements represent nodes with overlapping confidence intervals. Catarrhini, taxonomic category (parvorder) including humans, great apes, gibbons, and Old-World monkeys. Euarchontoglires, superorder of mammals including rodents, lagomorphs, treeshrews, colugos, and primates. Glires, taxonomic clade consisting of rodents and lagomorphs. Laurasiatheria, taxonomic clade of placental mammals that includes shrews, whales, bats, and carnivorans. Mya, million years ago. K-Pg, Cretaceous-Paleogene. The dotted vertical line representing the K-Pg mass extinction event at 66 mya is included for context only.
Fig. 3
Fig. 3. Distribution of protein families among Pneumocystis species.
a Heatmap of Pfam protein domains with significant differences (Wilcoxon signed-rank test, p < 0.05) are included if the domain appears at least once in the following comparisons: primate Pneumocystis (P. jirovecii and P. macacae) versus other Pneumocystis, clade P1 (P. jirovecii, P. macacae, P. oryctolagi, and P. canis Ck1) versus clade P2 (P. carinii, P. murina, and P. wakefieldiae), primate Pneumocystis versus clade P2. The number of proteins containing each domain is indicated within each cell for each species. The heatmap is colored according to a score, as indicated by the key at the upper right corner. b Heatmap of distribution of enzymes (represented by Enzyme Commission numbers and their KEGG functional categories), with their presence and absence indicated by black and grey colored cells, respectively. Animal icons were obtained from http://phylopic.org under creative commons licenses https://creativecommons.org/licenses/by/3.0/: mouse (Anthony Caravaggi; license CC BY-NC-SA 3.0); dog (Sam Fraser-Smith and vectorized by T. Michael Keesey; license CC BY 3.0), rabbit (by Anthony Caravaggi; license CC BY-NC-SA 3.0), and rat (by Rebecca Groom; license CC BY-NC-SA 3.0). Icons original black color background were modified to light gray.
Fig. 4
Fig. 4. Clustering of Pneumocystis major surface glycoproteins (Msg).
a Graphical representation of similarity between 482 Msg proteins from seven Pneumocystis species generated using the Fruchterman Reingold algorithm. A 3-D model of a representative member of Msg-A1 protein family (NCBI locus tag T551_00910) generated using DESTINI is presented in the upper left insert. Individual protein sequences are shown as dots and color-coded by species as shown at the bottom of the figure. The edge between two dots indicates a global pairwise identity equal or greater than 45%. The letters represent Msg families (A to E) and subfamilies (A1 to A3). N and U letters represent potentially novel Msg sequences (relative to our prior study) and unclassified sequences, respectively. For sake of clarity only the major clusters were annotated. b Phylogenetic network of a subset of Msg-A1 family (n = 97) in primate Pneumocystis including P. jirovecii (red) and P. macacae (dark cyan) suggesting recombination events at the root of the network. Nodes with more than two parents represent reticulate events. Bars represent the number of amino acid substitutions per site. c Phylogenetic network of Msg family A1 (n = 33) in P. oryctolagi (red violet) and P. canis (light blue). d Phylogenetic network of Msg-A1 family (n = 113) in rodent Pneumocystis including P. carinii (green), P. murina (dark blue), and P. wakefieldiae (blue violet). The network data are available at 10.5281/zenodo.4450766.
Fig. 5
Fig. 5. Evolution of Msg cysteine-rich protein domains in Pneumocystis.
a Heatmap showing the distribution of Msg domains in each Pneumocystis species. The color change from blue-orange-brown indicates an increase in the number of domains. b Graphical representation of protein similarity between domains, which highlights that the domains were present in the most recent common ancester and were maintained other than perhaps domains M1 and M3. Domains are clustered by a minimum BLASTp cutoff of 70% protein identity. c Maximum likelihood tree of the M1 domain. In both panels b and c, domains are color-coded by species as shown at the bottom.
Fig. 6
Fig. 6. Overview of the genomic evolution of the Pneumocystis genus.
Gene families are represented by letters: A to E for the five families of major surface glycoproteins (Msg) with the A family being further subdivided into three subfamilies A1, A2, and A3; K and R for kexins and arginine-glycine rich proteins, respectively. Larger fonts indicate expansions as inferred by maximum likelihood phylogenetic trees and networks. Dashed lines represent ancient hybridization between P. carinii and P. wakefieldiae. Detailed analysis also reveals distinct phylogenetic clusters within subfamilies. Introns and CFEM (common in fungal extracellular membrane) domains are enriched in Pneumocystis genes which indicate that these elements were likely present in the most recent common ancestor of Pneumocystis species. Animal icons were obtained from http://phylopic.org under creative commons licenses https://creativecommons.org/licenses/by/3.0/: mouse (Anthony Caravaggi; license CC BY-NC-SA 3.0); dog (Sam Fraser-Smith and vectorized by T. Michael Keesey; license CC BY 3.0), rabbit (by Anthony Caravaggi; license CC BY-NC-SA 3.0), and rat (by Rebecca Groom; license CC BY-NC-SA 3.0). Icons original black color background were modified to gray and orange colors.

Similar articles

Cited by

References

    1. Durand-Joly I, et al. Pneumocystis carinii f. sp. hominis is not infectious for SCID mice. J. Clin. Microbiol. 2002;40:1862–1865. doi: 10.1128/JCM.40.5.1862-1865.2002. - DOI - PMC - PubMed
    1. Gigliotti F, Harmsen AG, Haidaris CG, Haidaris PJ. Pneumocystis carinii is not universally transmissible between mammalian species. Infect. Immun. 1993;61:2886–2890. doi: 10.1128/IAI.61.7.2886-2890.1993. - DOI - PMC - PubMed
    1. Cushion MT, Keely SP, Stringer JR. Molecular and phenotypic description of Pneumocystis wakefieldiae sp. nov., a new species in rats. Mycologia. 2004;96:429–438. doi: 10.1080/15572536.2005.11832942. - DOI - PubMed
    1. Keely SP, Fischer JM, Stringer JR. Evolution and speciation of Pneumocystis. J. Eukaryot. Microbiol. 2003;50:624–626. doi: 10.1111/j.1550-7408.2003.tb00655.x. - DOI - PubMed
    1. Cisse OH, et al. Comparative population genomics analysis of the mammalian fungal pathogen Pneumocystis. mBio. 2018;9:e00381–00318. doi: 10.1128/mBio.00381-18. - DOI - PMC - PubMed

Publication types

Substances