. 2021 Mar 8;4(1):306.
doi: 10.1038/s42003-021-01809-8.

A flat embedding method for transmission electron microscopy reveals an unknown mechanism of tetracycline

Affiliations

A flat embedding method for transmission electron microscopy reveals an unknown mechanism of tetracycline

Michaela Wenzel et al. Commun Biol. .

Abstract

Transmission electron microscopy of cell sample sections is a popular technique in microbiology. Currently, ultrathin sectioning is done on resin-embedded cell pellets, which consumes milli- to deciliters of culture and results in sections of randomly orientated cells. This is problematic for rod-shaped bacteria and often precludes large-scale quantification of morphological phenotypes due to the lack of sufficient numbers of longitudinally cut cells. Here we report a flat embedding method that enables observation of thousands of longitudinally cut cells per single section and only requires microliter culture volumes. We successfully applied this technique to Bacillus subtilis, Escherichia coli, Mycobacterium bovis, and Acholeplasma laidlawii. To assess the potential of the technique to quantify morphological phenotypes, we monitored antibiotic-induced changes in B. subtilis cells. Surprisingly, we found that the ribosome inhibitor tetracycline causes membrane deformations. Further investigations showed that tetracycline disturbs membrane organization and localization of the peripheral membrane proteins MinD, MinC, and MreB. These observations are not the result of ribosome inhibition but constitute a secondary antibacterial activity of tetracycline that so far has defied discovery.


Conflict of interest statement

The authors declare that this work was conducted in the absence of any commercial or financial relationships that could be construed as a potential conflict of interest.

Figures

Fig. 1
Fig. 1. The flat embedding technique.
a Schematic representation of the flat embedding workflow including embedding on a single layer of agarose, embedding in an agarose sandwich (used here for mycobacteria), and embedding on carbon-coated glass coverslips. (i) Preparation of the surface. Uniform thickness of the agarose film is ensured by using a gene frame as spacer. (ii) The agarose or glass surface is transferred to an aluminum dish and a small drop of cell sample is spotted on top of the surface and allowed to evaporate under a slight air flow. For the agarose sandwich approach, a second flat layer of agarose is added on top of the cells without using a gene frame. (iii) Samples after EPON embedding. For glass embedding, the glass coverslip is broken off the EPON disc prior to sectioning. b Overview pictures of B. subtilis 168 cells embedded on a single agarose layer (top) and as pellet (bottom) at 5000x magnification.
Fig. 2
Fig. 2. Transmission electron micrographs of flat-embedded Bacillus subtilis, Escherichia coli, Mycobacterium bovis BCG, and Acholeplasma laidlawii.
a Bacteria embedded on a single layer of agarose. b Agarose sandwich approach to flat embedding of mycobacteria. M. bovis BCG was grown in the presence or absence of 0.05% Tween 80. c Bacteria embedded on carbon-coated coverslips. See also Supplementary Fig. 3.
Fig. 3
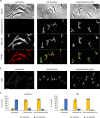
Fig. 3. Quantification of antibiotic-induced lesions based on electron micrographs.
a TEM image showing cell wall damage (arrow) caused by vancomycin. Scale bar 500 nm. b Quantification of the total number of lesions caused by vancomycin. c Position of cell wall lesions in vancomycin-treated cells. d TEM images showing deterioration of nucleoids caused by nitrofurantoin. Scale bar 1 µm. e Quantification of cells devoid of visible nucleoids in electron micrographs. Note that all nitrofurantoin-treated cells with visible DNA structures displayed a deteriorated nucleoid as shown in Supplementary Fig. 6. f Fluorescence light microscopy images of B. subtilis stained with the DNA dye DAPI and the membrane dye Nile red. Blue arrows indicate diffuse DNA stain. Numbers in the DAPI panels show average cell fluorescence quantified from three different data sets using the ImageJ analyze particles function. Red arrows indicate membrane patches. Cells were treated with 4x MIC of nitrofurantoin for 30 min. Scale bar 3 µm. g TEM image showing a lesion (arrow) caused by tetracycline. Scale bar 500 nm. h Quantification of total lesions in cells treated with tetracycline. i Quantification of different types of membrane lesions caused by tetracycline. (b, c, e, h, i) Cells were quantified manually from electron micrographs at 8000 to 15,000x magnification according to their phenotype (n ≥ 100 per condition per replicate). Error bars represent the standard deviation of three biological replicates. Circles indicate individual datapoints.
Fig. 4
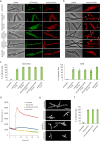
Fig. 4. Tetracycline targets the cytoplasmic membrane.
a Fluorescence microscopy images of cells treated with either tetracycline or anhydrotetracycline for 30 min. Both antibiotics display green autofluorescence allowing direct localization of the compound. Cell membranes were stained with Nile red. Arrows indicate fluorescent membrane patches coinciding with accumulation of the respective antibiotic. b SIM microscopy images of cells treated with either tetracycline or anhydrotetracycline for 30 min. Membranes were stained with Nile red. Arrows indicate membrane staples or invaginations. Scale bars 2 µm. c Quantification of cells showing membrane patches from widefield (a) and SIM (b) images. Images were quantified manually. Sample size was ≥100 individual cells per condition for widefield and ≥50 individual cells per condition for SIM. Error bars show standard deviation of the mean of three replicate experiments. Circles indicate individual datapoints.
Fig. 5
Fig. 5. Tetracyclines delocalize membrane proteins.
Effects of tetracycline, anhydrotetracycline, and gramicidin (positive control) on protein localization. B. subtilis LB318 (168 amyE::spc mgfp-minD aprE::cat mcherry-minC) a and TNVS205 (168 aprE::cat mcherry-mreB) b were treated with 2 µg/ml tetracycline, 2 µg/ml anhydrotetracycline, or 1 µg/ml gramicidin, respectively. Arrows indicate abnormalities in protein localization patterns. Scale bars 2 µm. c Quantification of microscopy images pertaining to (a) and (b). MinC localization depends on MinD resulting in MinC always being affected when MinD is delocalized. Hence, the numbers of affected cells are the same for both proteins and only one graph is shown. A MinCD-expressing cell was counted as affected, when it lost its typical septal/polar localization pattern by displacement of the fluorescence signal into the cytosol and/or membrane patches. MreB-expressing cells were counted as affected, when the regular MreB localization was disturbed by gaps (typical for tetracycline), patches (typical for anhydrotetracycline), or displacement of the fluorescence signal into the cytosol (typical for gramicidin and partially anhydrotetracycline). Images were quantified manually. Sample size was ≥100 individual cells per condition. Error bars show standard deviation of the mean of three replicate experiments. Circles indicate individual datapoints. d Effects of tetracycline, anhydrotetracycline, and gramicidin on the membrane potential of B. subtilis 168 measured with DiSC(3)5. An exemplary graph out of three biological replicates is shown. e Effects of tetracycline, anhydrotetracycline, and gramicidin on fluid membrane microdomains of B. subtilis 168 cells stained with the fluid lipid domain dye DiIC12. Arrows indicate abnormal membrane domain stains. Scale bar 2 µm (f) Quantification of microscopy images pertaining to (e). Images were quantified manually. Cells were counted as affected, when the regular DiIC12 staining pattern deviated from the control (regular distribution, regular size, typically 6–15 spots per cell) by accumulation of the dye in irregular, large, and/or less than 6 foci). Sample size was ≥100 individual cells per condition. Error bars show standard deviation of the mean from three replicate experiments. Circles indicate individual datapoints.
Fig. 6
Fig. 6. Tetracycline affects the membrane independently of ribosome inhibition.
Strain PG112 carries the tet-4 mutation, a point mutation in the ribosomal protein S10 that renders ribosomes insensitive to tetracycline. Strain SG82 carries the tetL tetracycline efflux pump. Cells were treated with 1x MIC of tetracycline (16 µg/ml for PG112, 100 µg/ml for SG82) for 30 min prior to membrane staining with Nile red and microscopy. See Supplementary Fig. 18 for titration of tetracycline concentrations. a Microscopy images of Nile red-stained cells. Scale bar 2 µm. b Quantification of microscopy images showing the percentage of spotty (= membrane-stressed) cells. Quantification was done manually. Sample size was ≥100 individual cells per condition. Error bars show standard deviation of the mean from three replicate experiments. Circles indicate individual datapoints.

Similar articles

Cited by

References

    1. Santhana Raj L. et al. Rapid method for transmission electron microscopy study of Staphylococcus aureus ATCC 25923. Ann. Microsc. 2007;7:102–108.
    1. Spindler EC, Hale JDF, Giddings THJ, Hancock REW, Gill RT. Deciphering the mode of action of the synthetic antimicrobial peptide Bac8c. Antimicrob. Agents Chemother. 2011;55:1706–1716. doi: 10.1128/AAC.01053-10. - DOI - PMC - PubMed
    1. Matias VRF, Beveridge TJ. Cryo-electron microscopy reveals native polymeric cell wall structure in Bacillus subtilis 168 and the existence of a periplasmic space. Mol. Microbiol. 2005;56:240–251. doi: 10.1111/j.1365-2958.2005.04535.x. - DOI - PubMed
    1. Delgado L, Martínez G, López-Iglesias C, Mercadé E. Cryo-electron tomography of plunge-frozen whole bacteria and vitreous sections to analyze the recently described bacterial cytoplasmic structure, the Stack. J. Struct. Biol. 2015;189:220–229. doi: 10.1016/j.jsb.2015.01.008. - DOI - PubMed
    1. Pilhofer M, Ladinsky MS, McDowall AW, Jensen GJ. Bacterial TEM: new insights from cryo-microscopy. Methods Cell Biol. 2010;96:21–45. doi: 10.1016/S0091-679X(10)96002-0. - DOI - PubMed

Publication types

MeSH terms