. 2021 Mar 8;4(1):301.
doi: 10.1038/s42003-021-01832-9.

Brain pathology recapitulates physiology: A network meta-analysis

Affiliations

Brain pathology recapitulates physiology: A network meta-analysis

Thomas J Vanasse et al. Commun Biol. .

Abstract

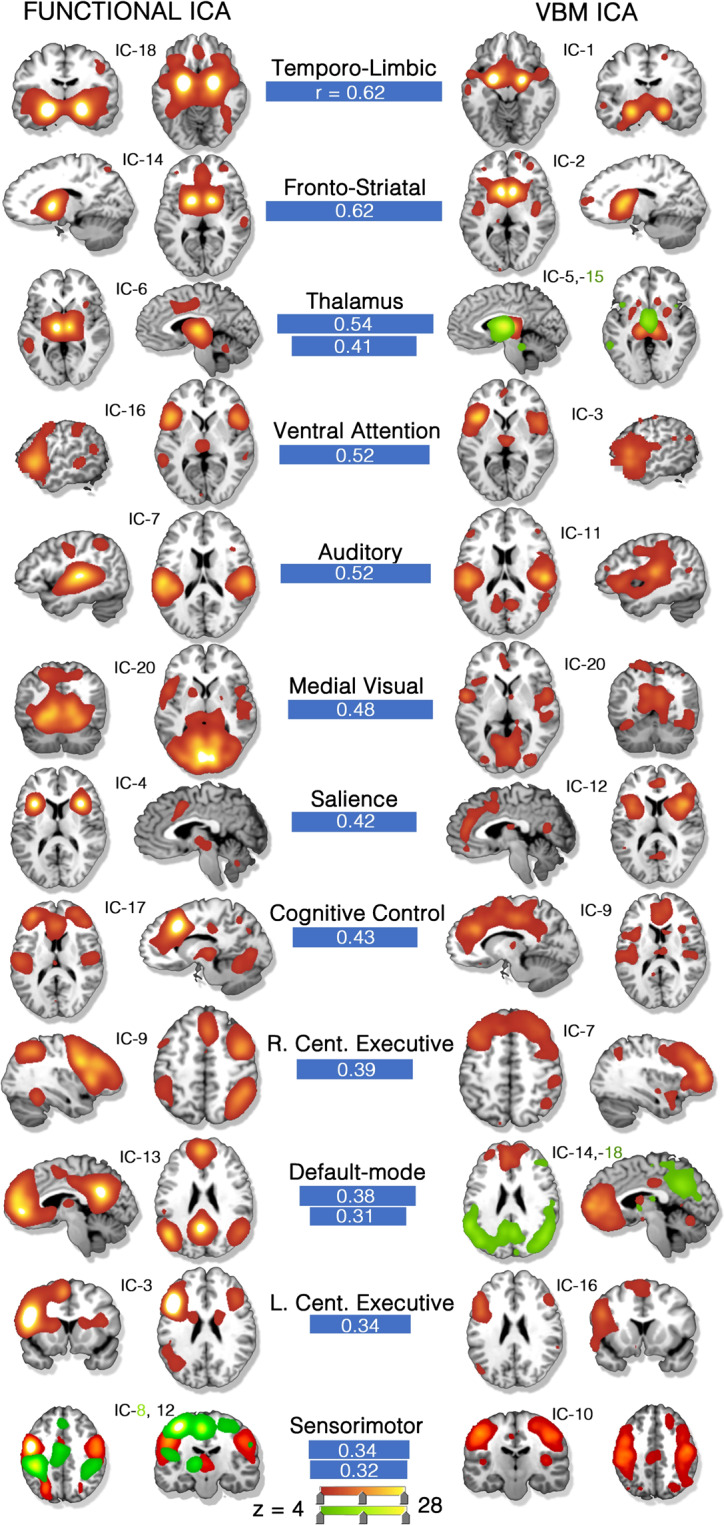
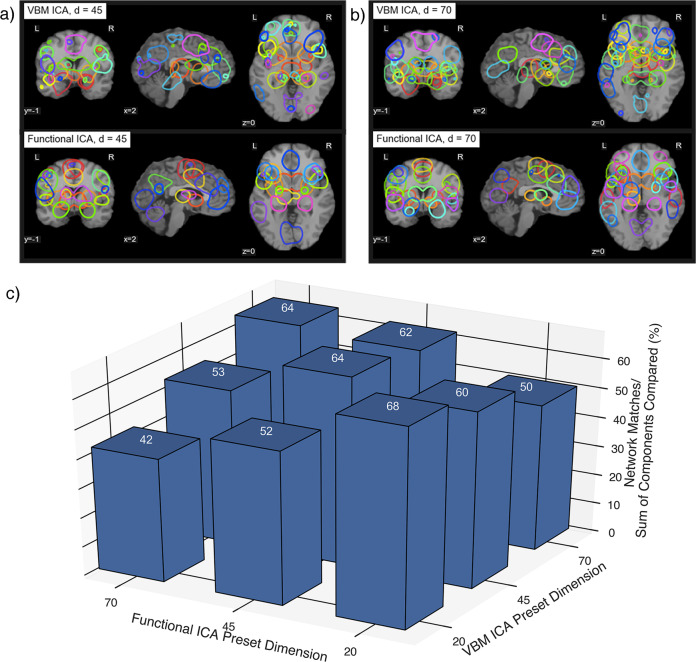
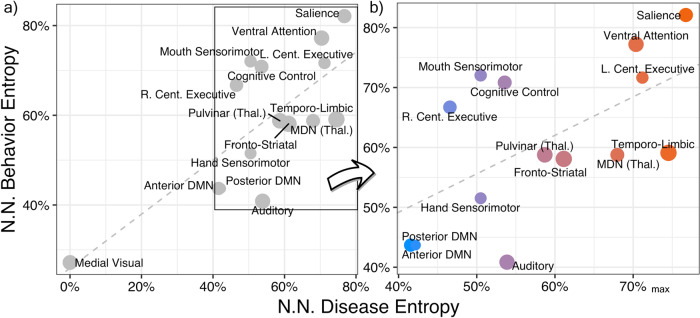
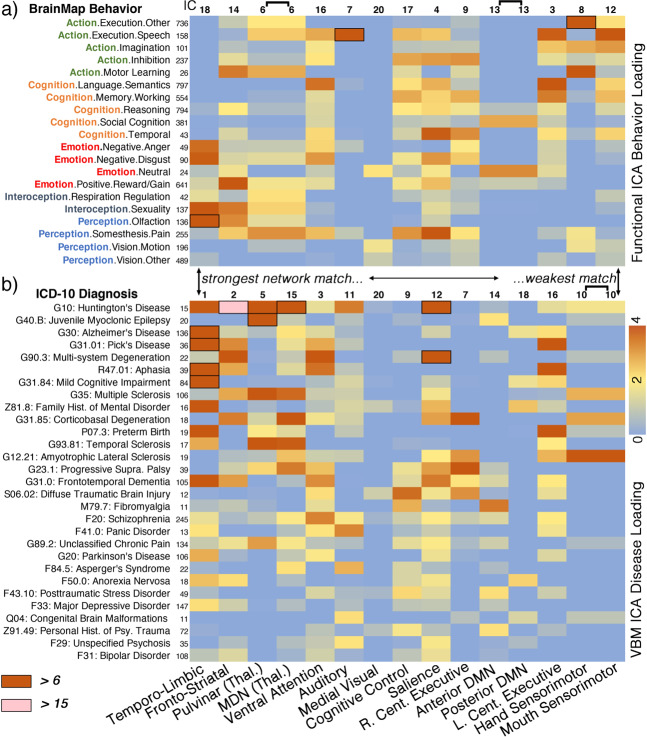
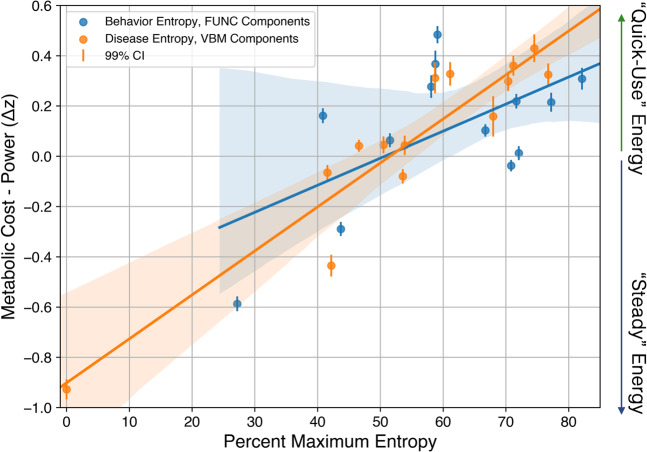
Network architecture is a brain-organizational motif present across spatial scales from cell assemblies to distributed systems. Structural pathology in some neurodegenerative disorders selectively afflicts a subset of functional networks, motivating the network degeneration hypothesis (NDH). Recent evidence suggests that structural pathology recapitulating physiology may be a general property of neuropsychiatric disorders. To test this possibility, we compared functional and structural network meta-analyses drawing upon the BrainMap database. The functional meta-analysis included results from >7,000 experiments of subjects performing >100 task paradigms; the structural meta-analysis included >2,000 experiments of patients with >40 brain disorders. Structure-function network concordance was high: 68% of networks matched (pFWE < 0.01), confirming the broader scope of NDH. This correspondence persisted across higher model orders. A positive linear association between disease and behavioral entropy (p = 0.0006;R2 = 0.53) suggests nodal stress as a common mechanism. Corroborating this interpretation with independent data, we show that metabolic 'cost' significantly differs along this transdiagnostic/multimodal gradient.


Conflict of interest statement

The authors declare no competing interests.

Figures

Fig. 1
Fig. 1. Co-alteration and task-activation network correspondence (d = 20).
(Left) Thirteen task-activation (TA) networks derived from the BrainMap-TA sector (n = 7865 task-activation experiments among healthy subjects). (Right) Fourteen structural co-alteration networks derived from the BrainMap voxel-based morphometry sector (n = 2002 experiments across n > 40 diseases). Clear network matches across datasets are shown by blue connecting bars, the width of which are proportional to the whole-brain, spatial correlation coefficient. Some networks matched to two, separate opposite-modality networks (red and green). Color scale is shown at the bottom of the image. Independent component (IC) numbers are ordered by explained variance within the respective dataset. All component matches are at or below a significance threshold of p = 0.01, family-wise error (FWE) rate corrected. Source data are provided in Supplementary Data 1.
Fig. 2
Fig. 2. Higher model order comparisons.
Components that matched at higher dimensionalities of a 45 and b 70. c Percentage of network matches applying the same correlation threshold across n = 9 separate combinations of dimensionalities (20/45/70). Source data are provided in Supplementary Data 1.
Fig. 3
Fig. 3. Matched network disease and behavior entropy comparison.
The informational content of each network in terms of percent maximum of network normalized behavior and disease entropy. High disease entropy corresponds to a network that is associated with a higher variety of diseases [from n = 43 International Classification of Disease (10th version) diagnostic categories] and is non-specific to one or few diseases. High behavior entropy corresponds to a functional network associated with a high variety of Behaviors (from n = 56 BrainMap behavior domains) and is also not specialized. Only those n = 15 networks that are significantly matched between co-alteration and task-activation ICA are displayed; the size of data points is proportional to their spatial correlation (0.31 ≤ r ≤ 0.62). The linear model a had the following parameters: β = 0.60; p = 0.0006; df = 13; Adjusted R2 = 0.53. Panel b excludes the medial visual network from view, where color corresponds to the fitted values of the model. NN network normalized, MDN medial dorsal nucleus, DMN default-mode network, Thal. thalamus, L./R. left/right, Cent. central. Source data are provided in Supplementary Data 1.
Fig. 4
Fig. 4. Matched network metadata loadings.
a Twenty (of n = 59) selected behavior domain loadings of task-activation functional networks. b Twenty-nine (of n = 43) selected disease loadings of co-alteration networks. One column, spanning panels a and b, corresponds to a network match. Stronger to weaker spatial correspondence is ordered from left to right. Metadata loadings are scaled by median absolute deviation about zero (see the “Methods” section). Metadata experiment volume within the database at the time of analysis are displayed to the right of the metadata label. Cell borders/shading specify more extreme loadings above 6 and 15. Source data are provided in Supplementary Data 1.
Fig. 5
Fig. 5. Metabolic brain attributes vs. disease/behavior entropy.
Using a published dataset capturing the dynamics of metabolic supply mismatching energetic demand (higher relative cost vs. power) among n = 28 healthy subjects, we performed linear regression with n = 14 percent maximum disease and n = 13 behavior network entropy metrics as separate independent variables (matched VBM and functional components, colored orange and blue, respectively). Both regressions were found to be significant after correcting for multiple tests, p = 7e−7 and p = 0.03, for disease–structural and behavior–functional network data, respectively. Source data are provided in Supplementary Data 1.

References

    1. Sporns, O. in Micro-, Meso- and Macro-Connectomics of the Brain (eds Kennedy, H., Van Essen, D. C. & Christen, Y.) 107–127 (Springer International Publishing, 2016). - PubMed
    1. Mckeown MJ, et al. Analysis of fMRI data by blind separation into independent spatial components. Hum. Brain Mapp. 1998;6:160–188. doi: 10.1002/(SICI)1097-0193(1998)6:3<160::AID-HBM5>3.0.CO;2-1. - DOI - PMC - PubMed
    1. Beckmann CF, DeLuca M, Devlin JT, Smith SM. Investigations into resting-state connectivity using independent component analysis. Philos. Trans. R. Soc. B. 2005;360:1001–1013. doi: 10.1098/rstb.2005.1634. - DOI - PMC - PubMed
    1. Llera A, Wolfers T, Mulders P, Beckmann CF. Inter-individual differences in human brain structure and morphology link to variation in demographics and behavior. Elife. 2019;8:3031. doi: 10.7554/eLife.44443. - DOI - PMC - PubMed
    1. Biswal B, Zerrin Yetkin F, Haughton VM, Hyde JS. Functional connectivity in the motor cortex of resting human brain using echo-planar MRI. Magn. Reson. Med. 1995;34:537–541. doi: 10.1002/mrm.1910340409. - DOI - PubMed

Publication types

MeSH terms