. 2021 Mar;23(3):232-242.
doi: 10.1038/s41556-021-00644-7. Epub 2021 Mar 8.

Lysosomal retargeting of Myoferlin mitigates membrane stress to enable pancreatic cancer growth

Affiliations

Lysosomal retargeting of Myoferlin mitigates membrane stress to enable pancreatic cancer growth

Suprit Gupta et al. Nat Cell Biol. 2021 Mar.

Abstract

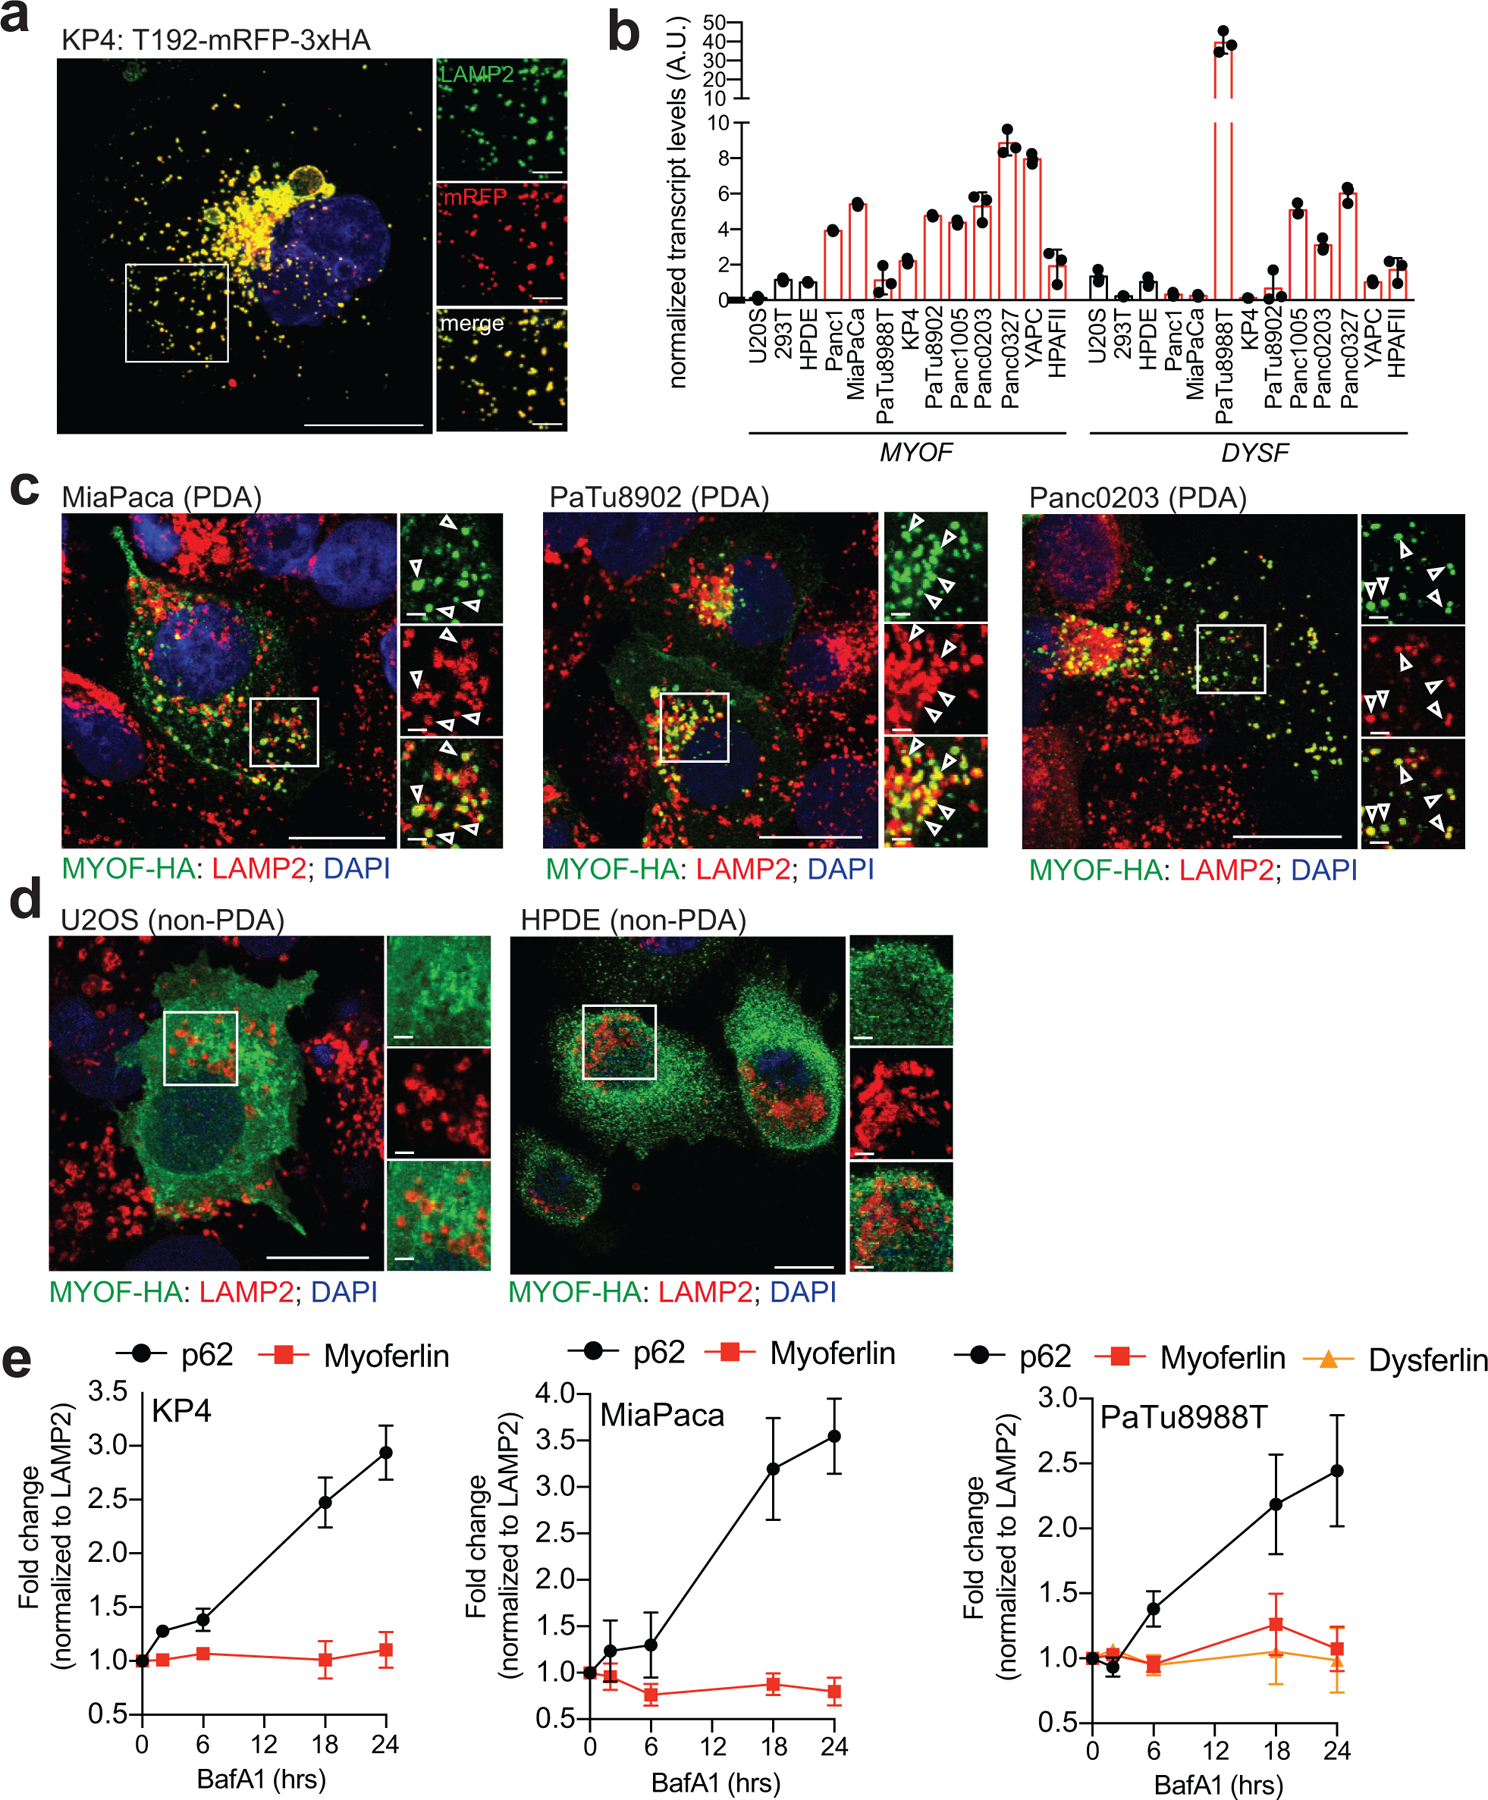
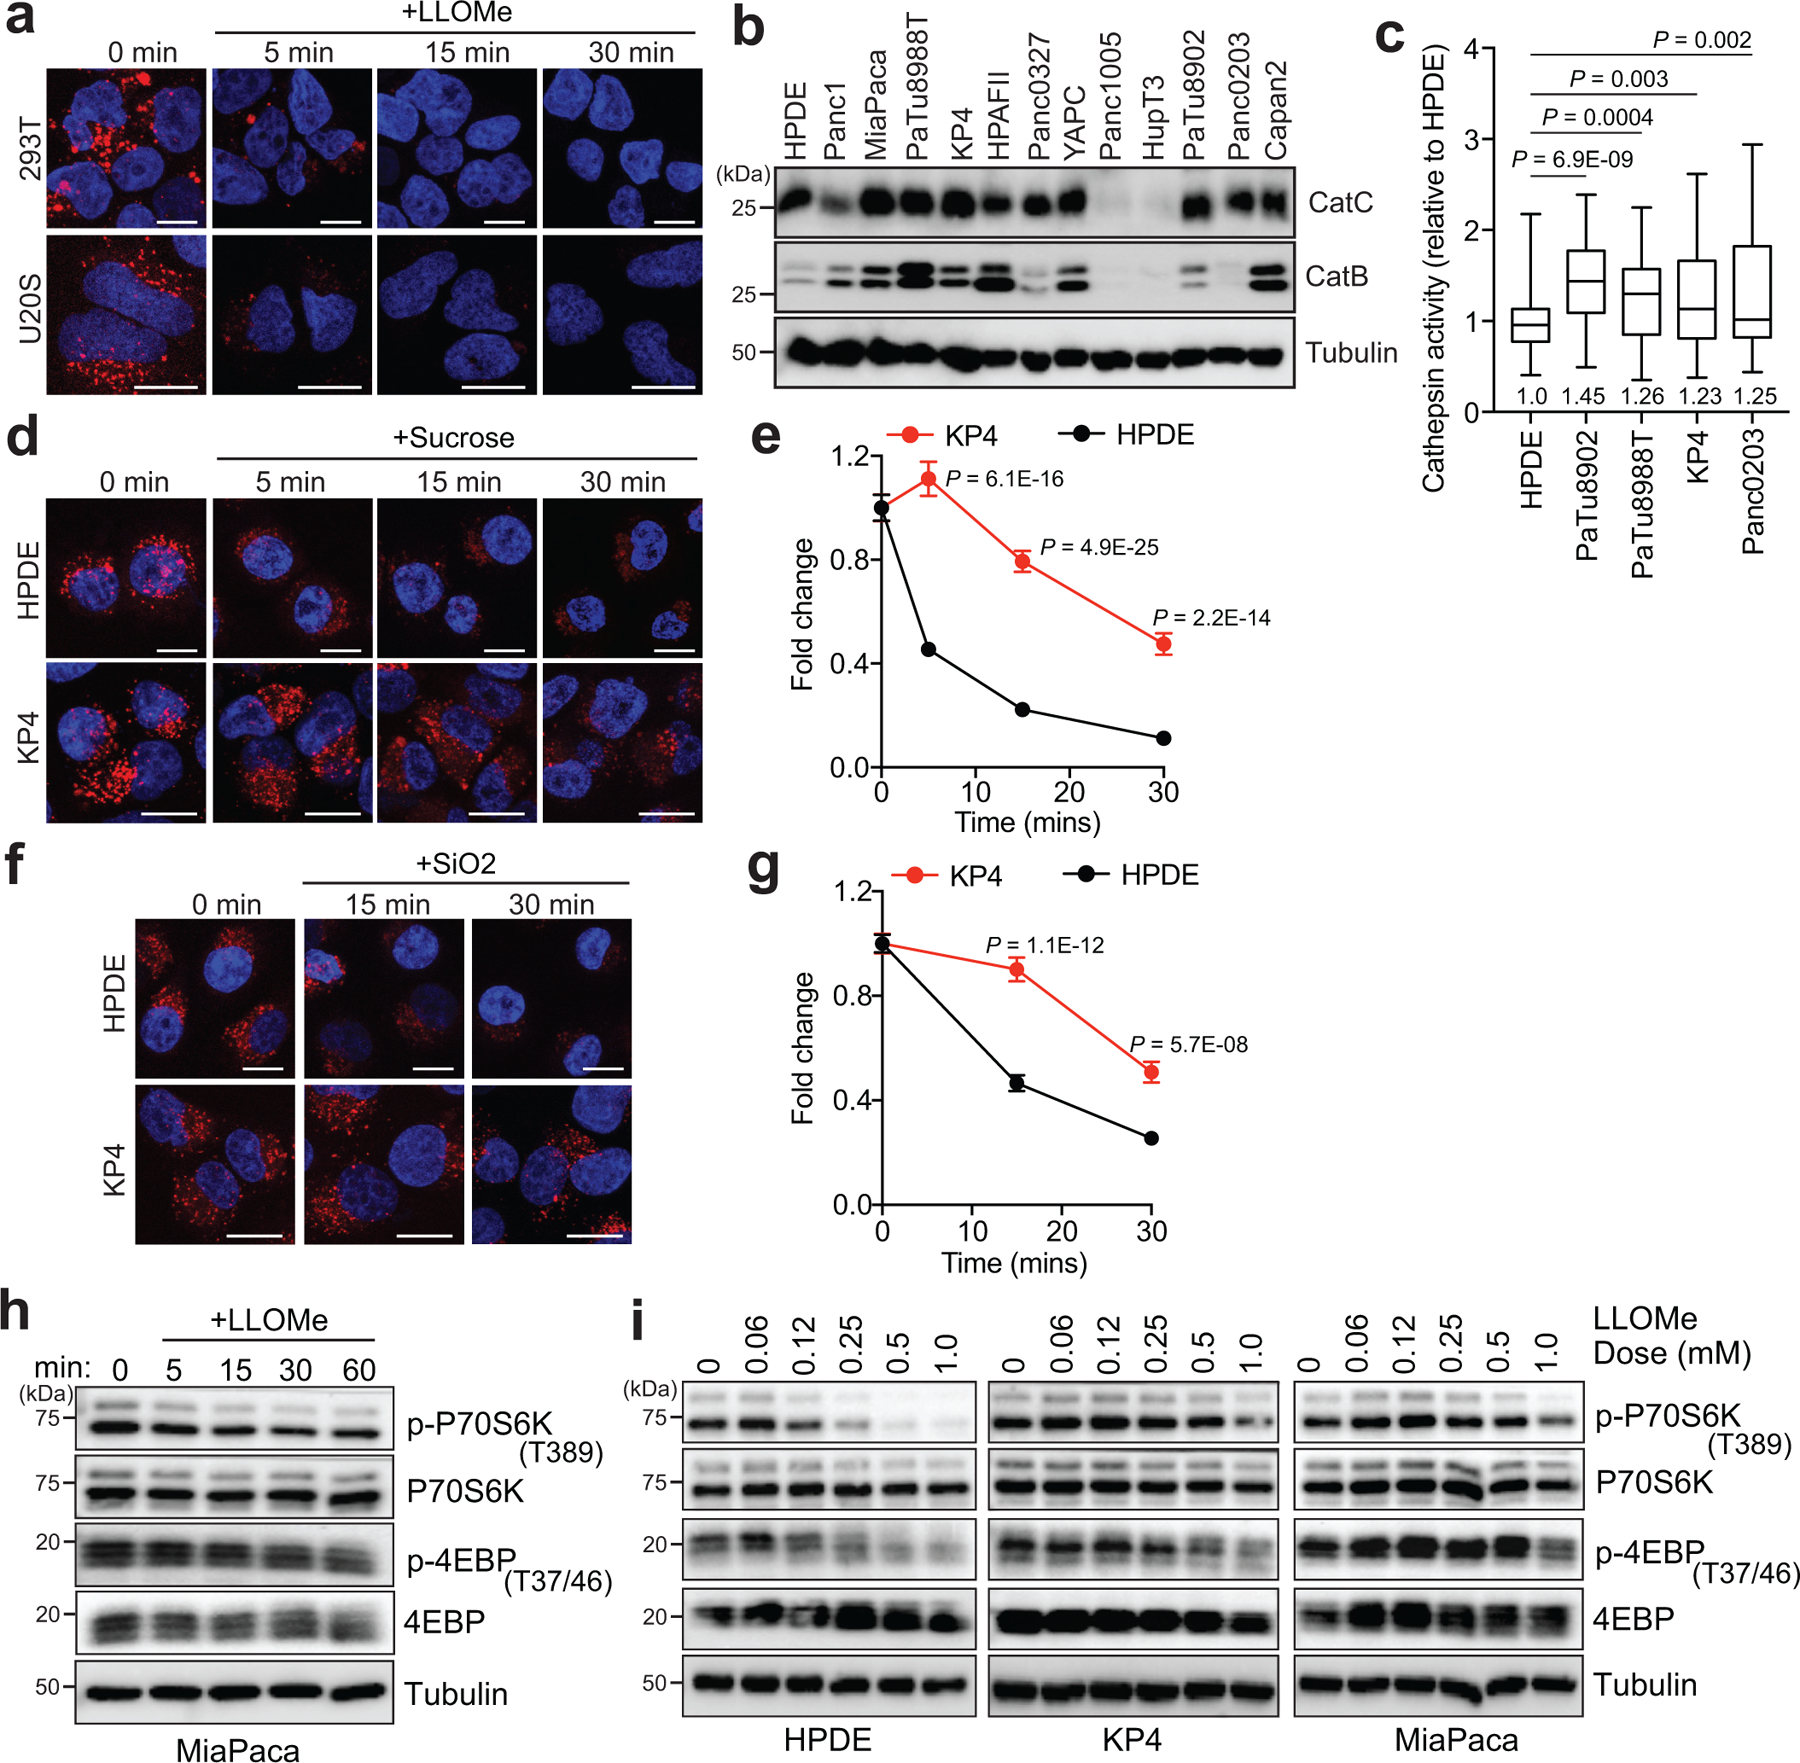
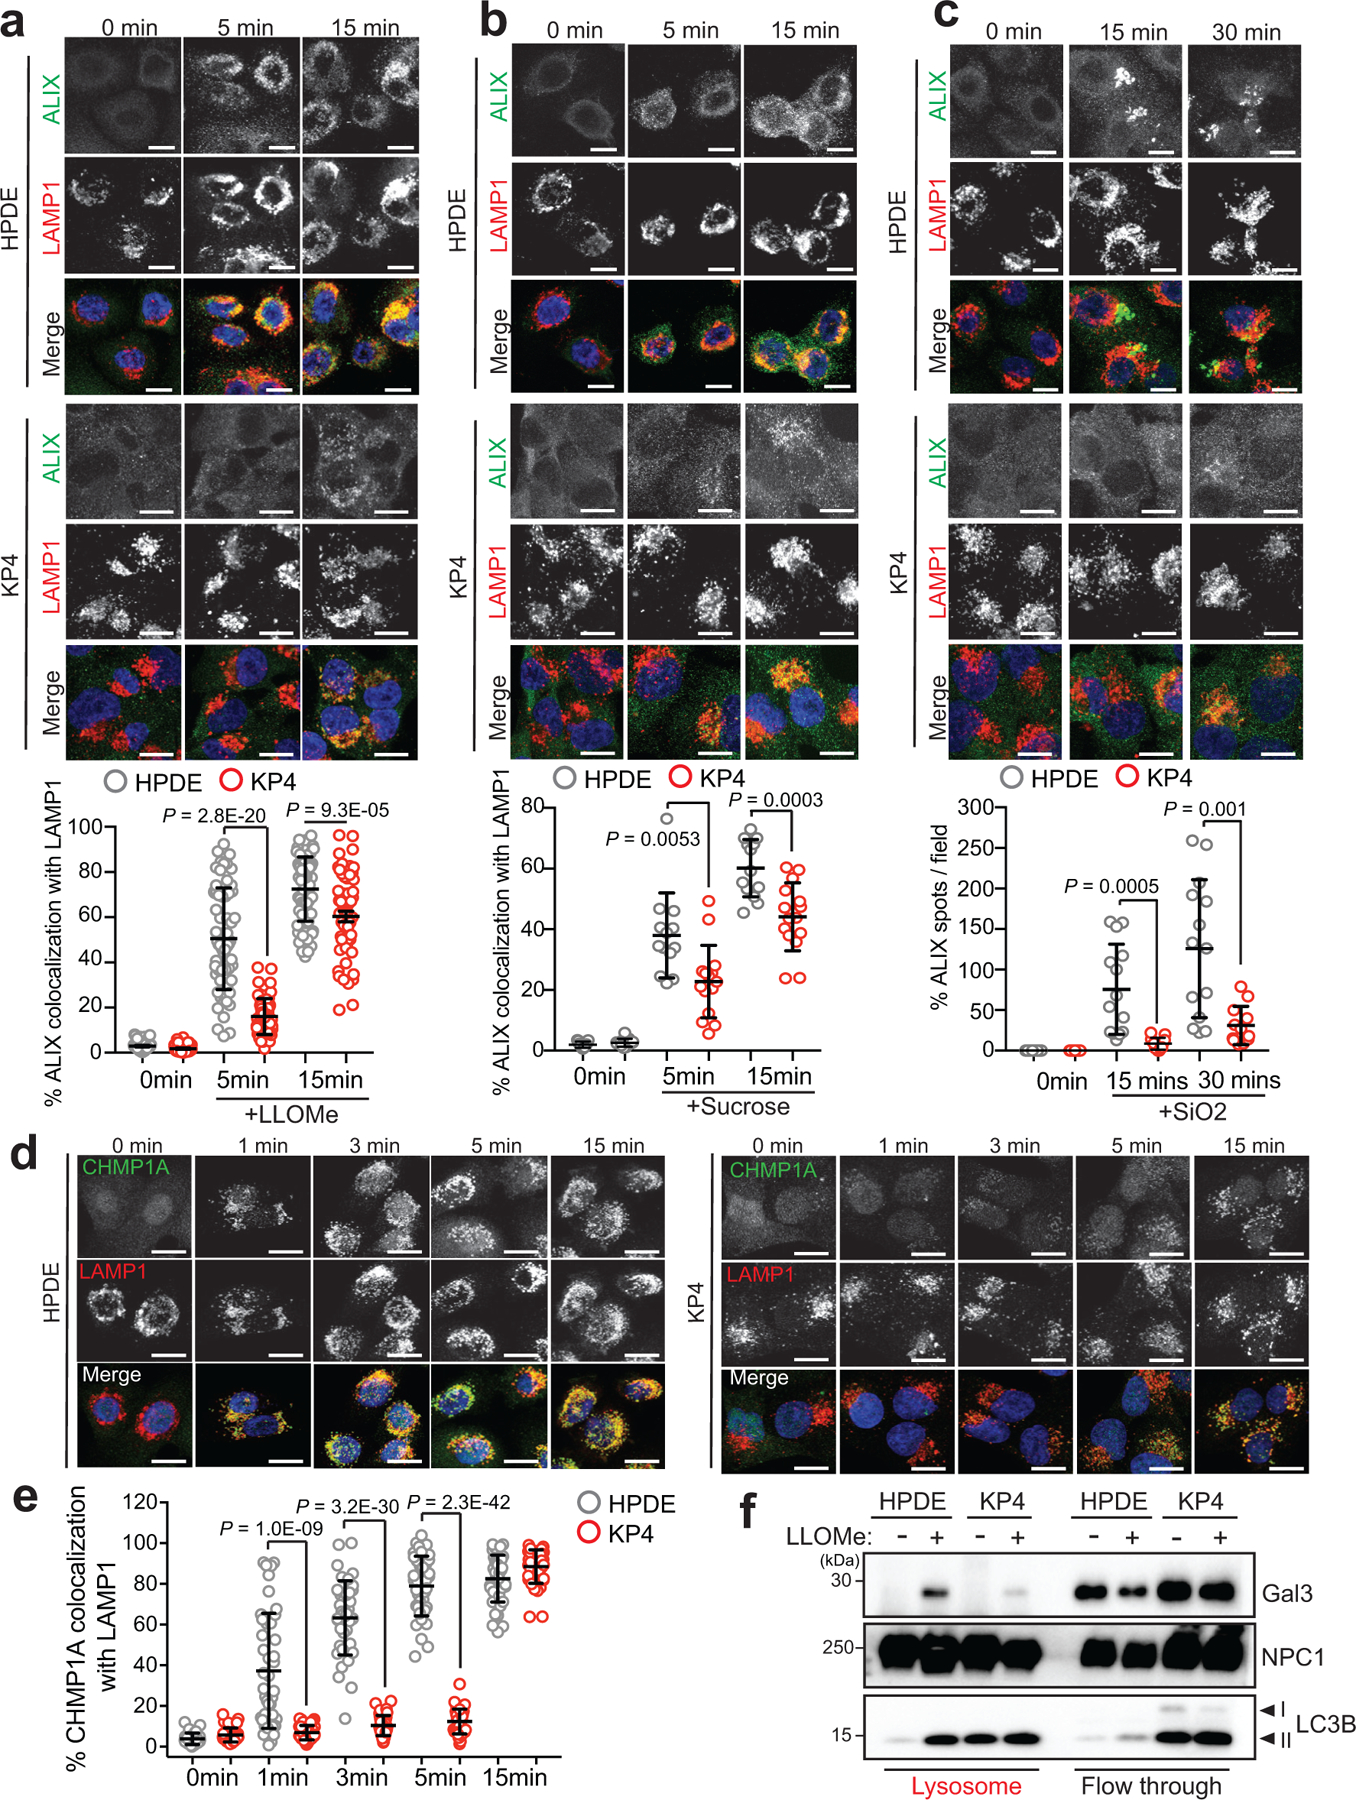
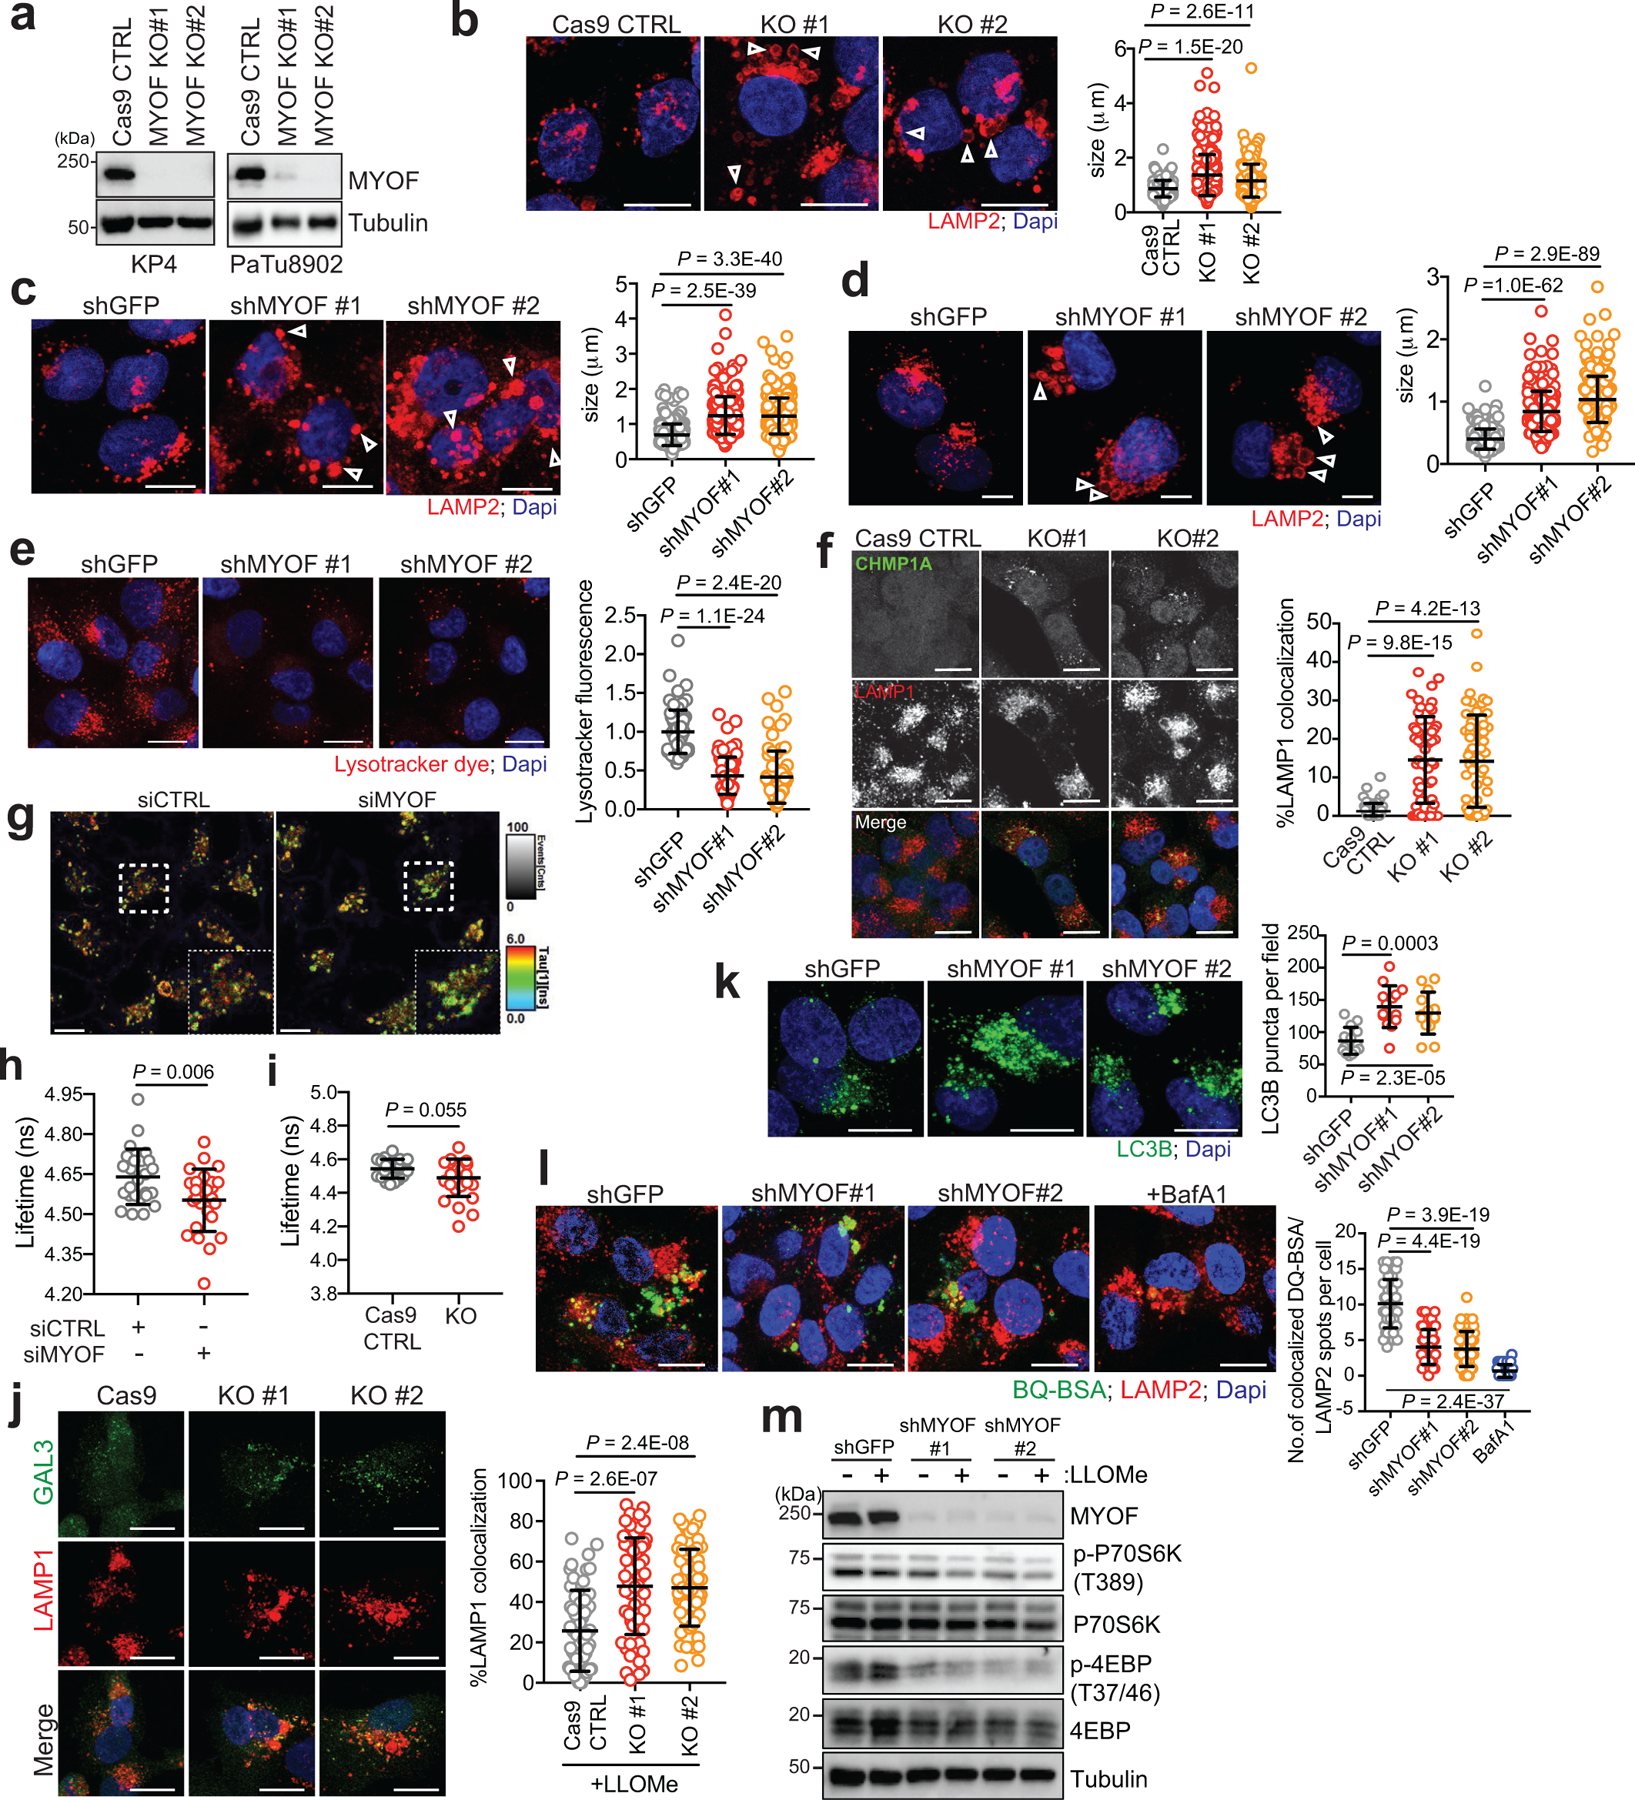
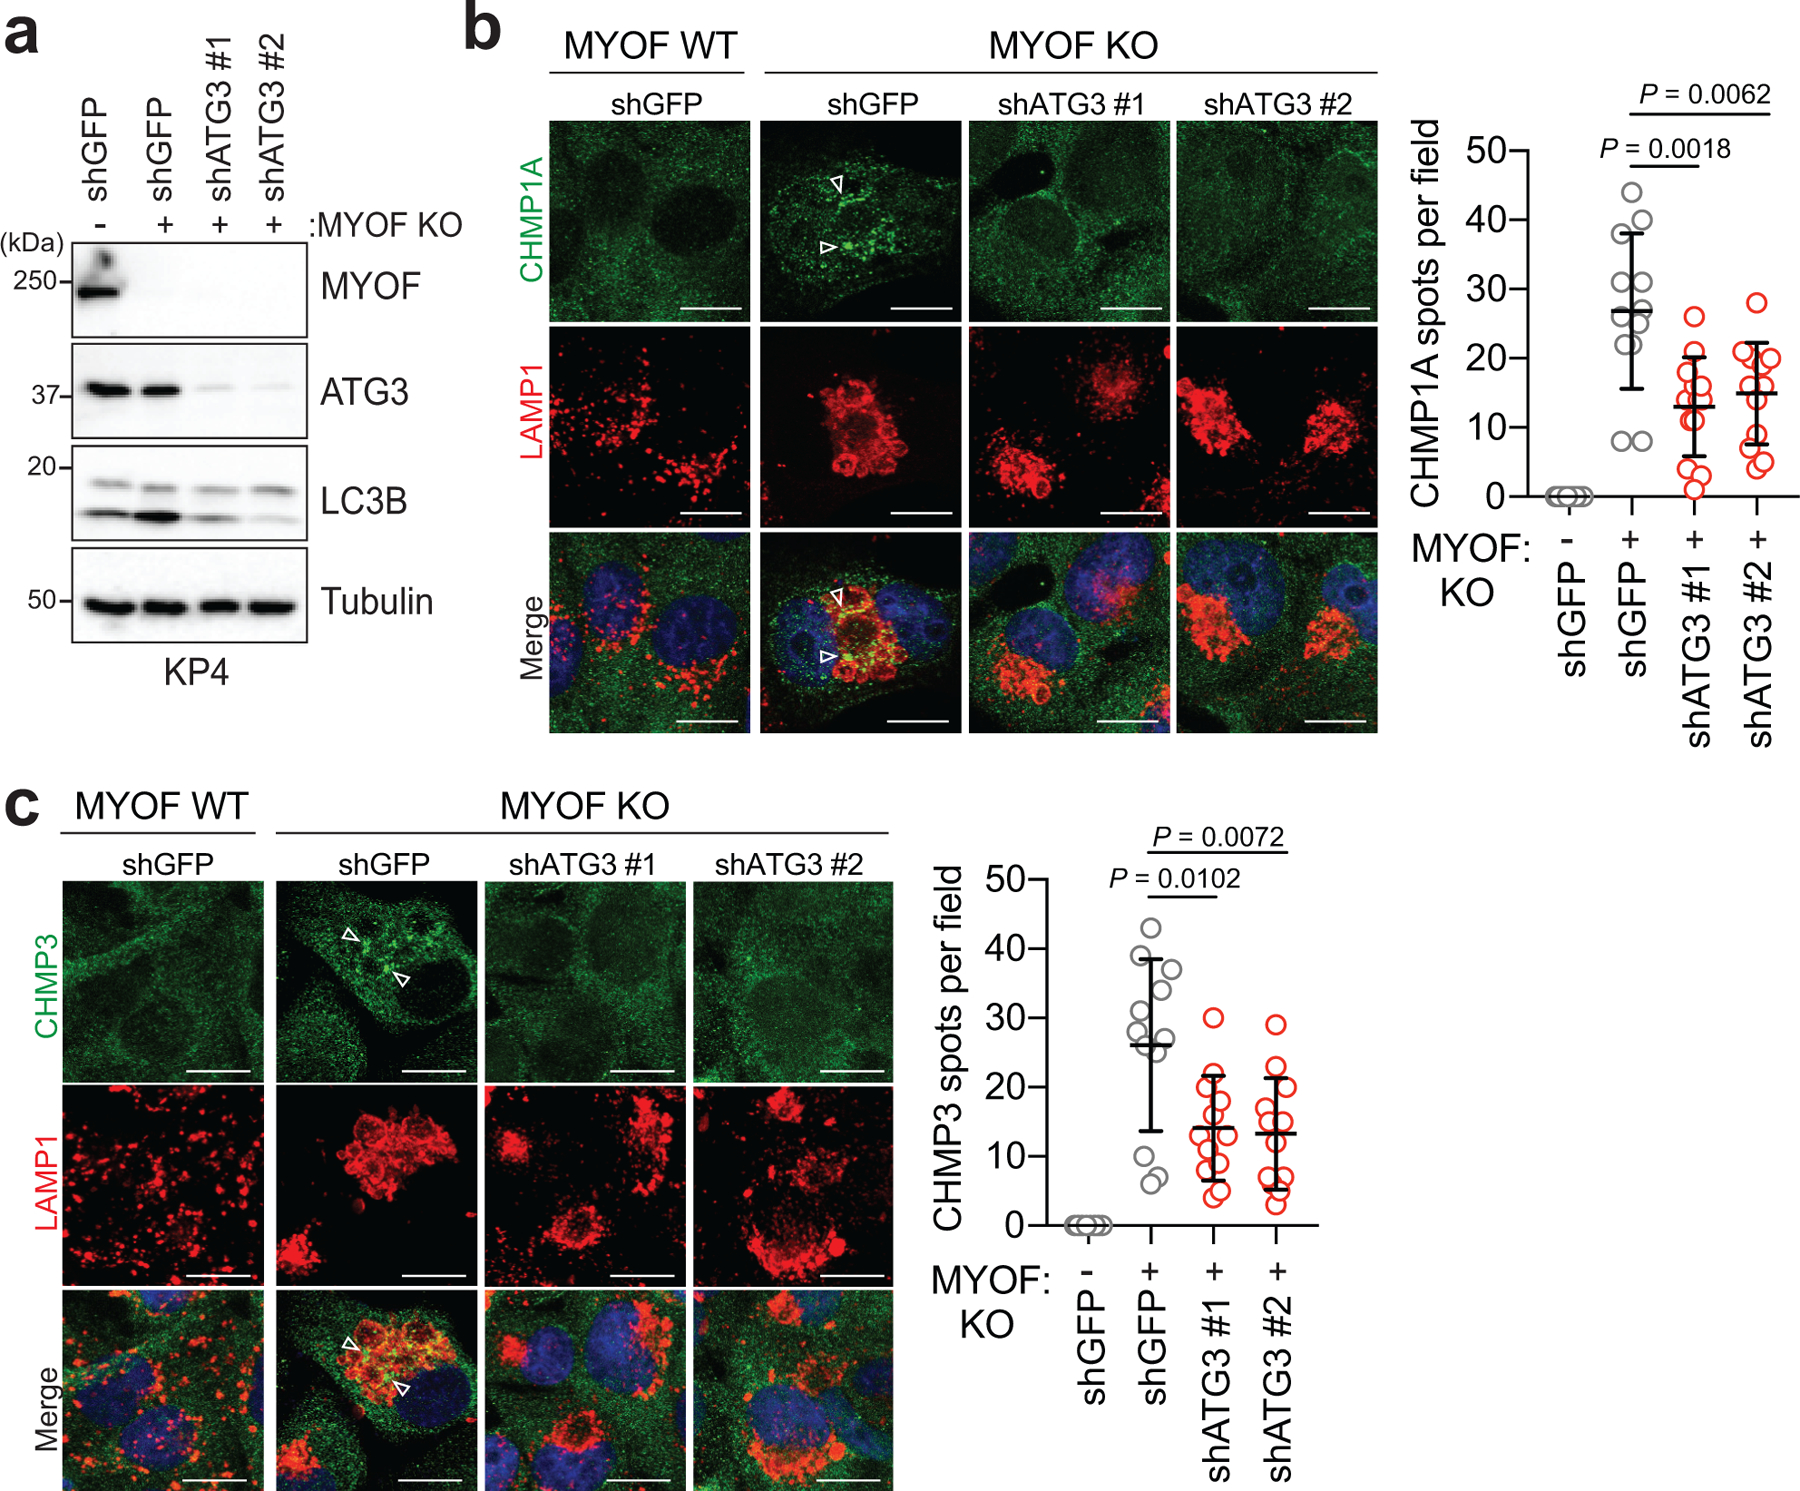
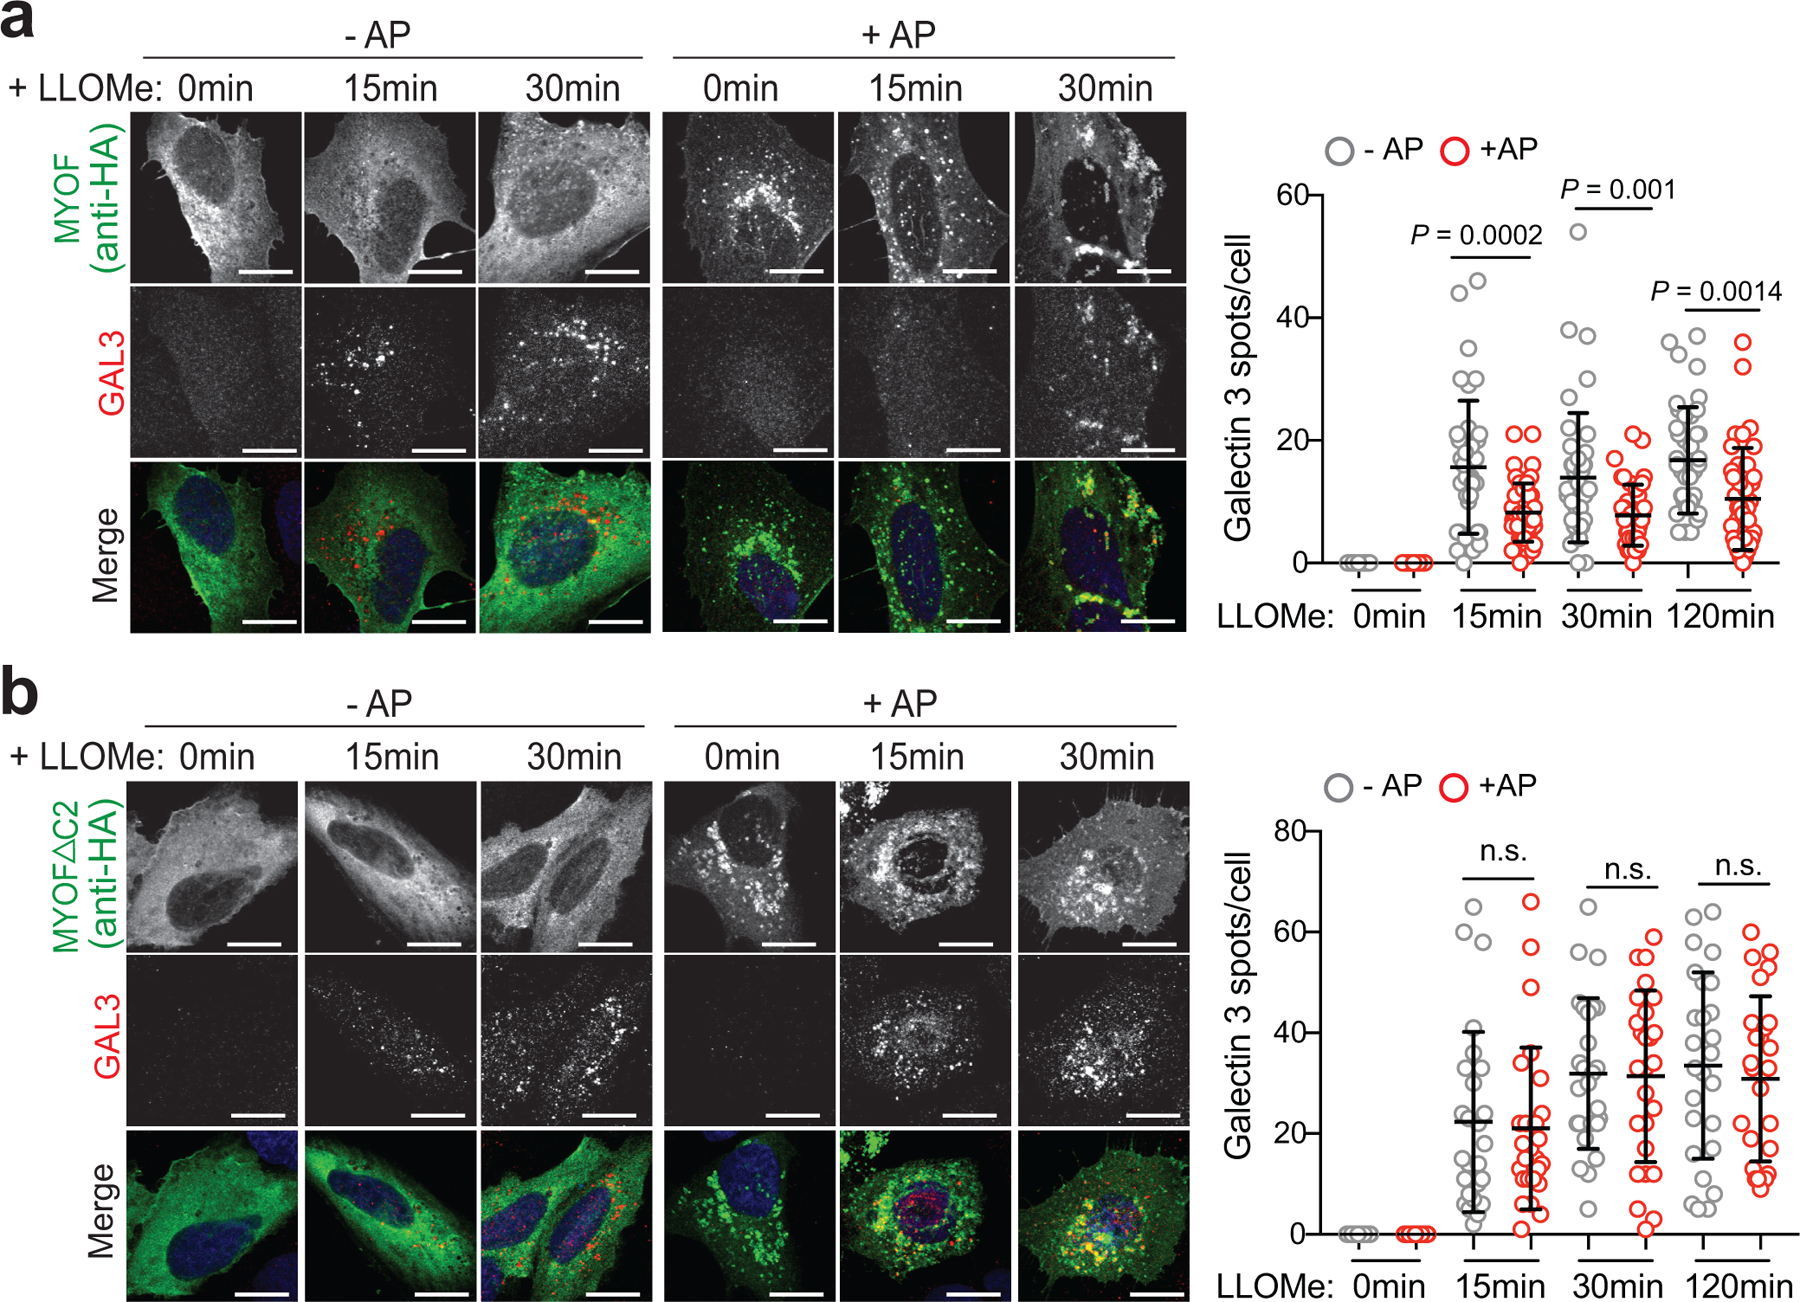
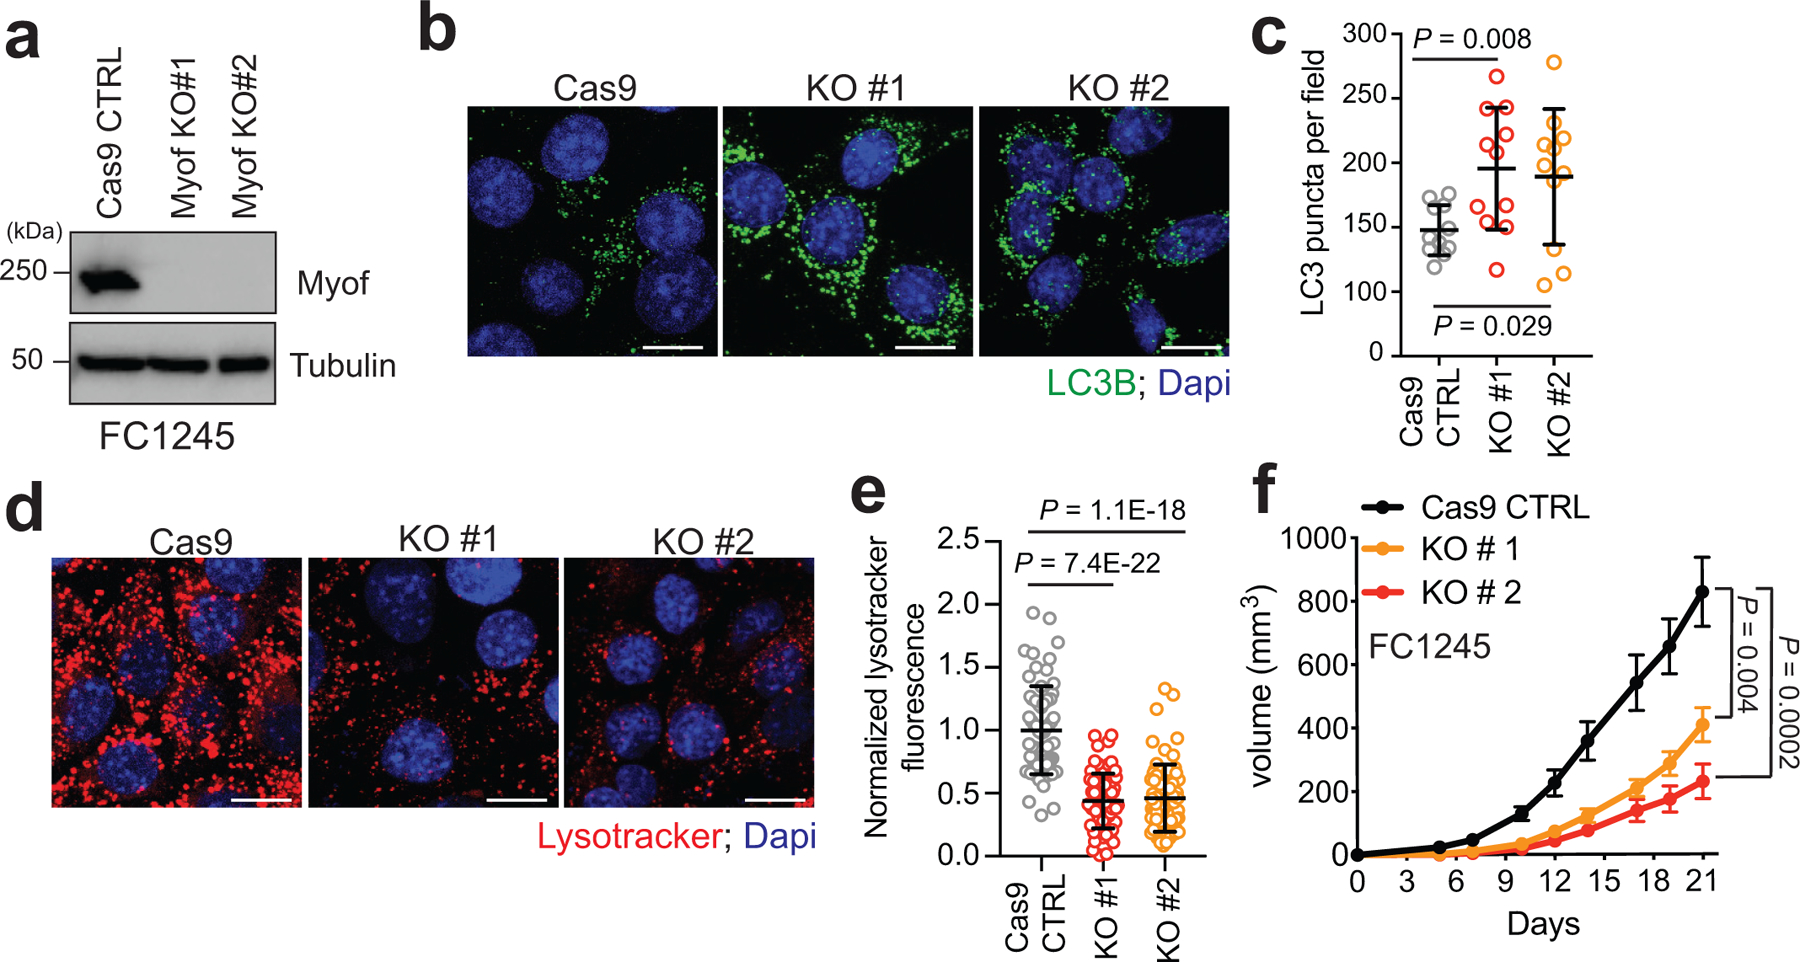
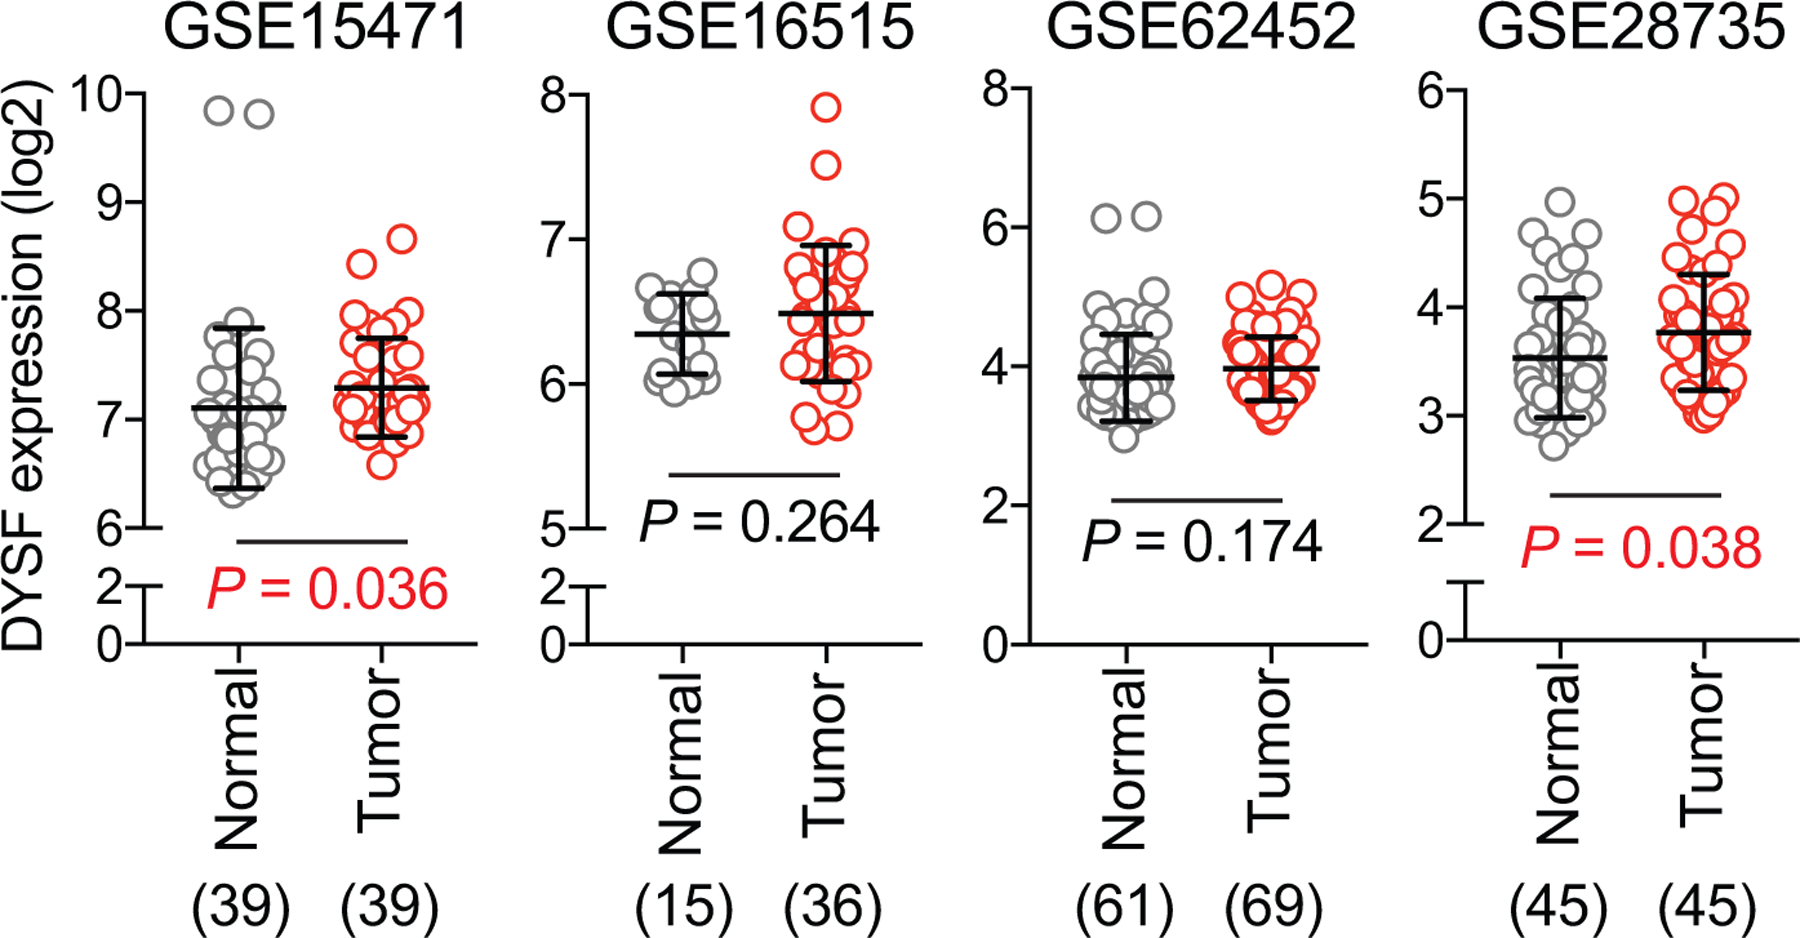
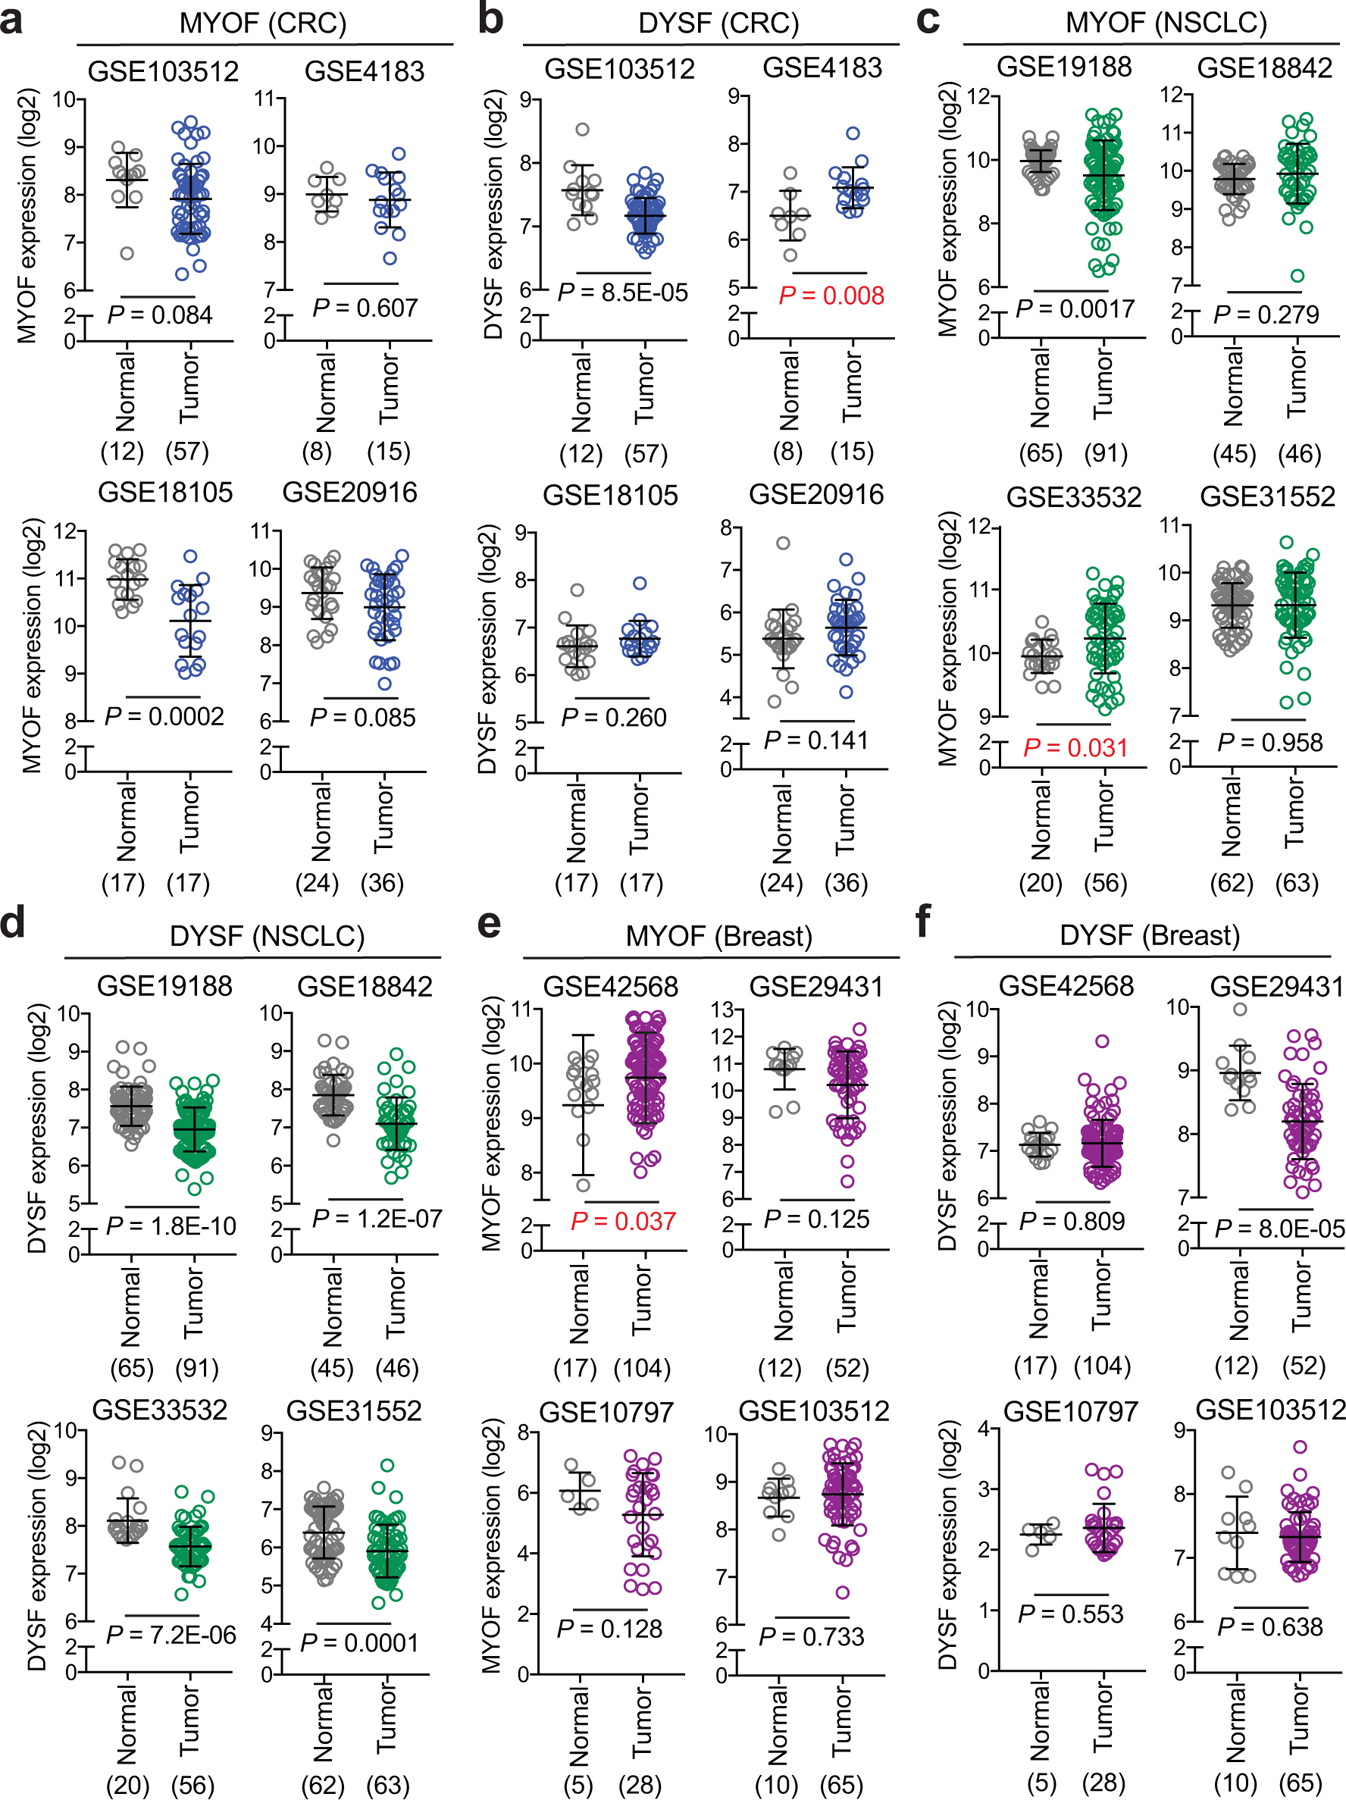
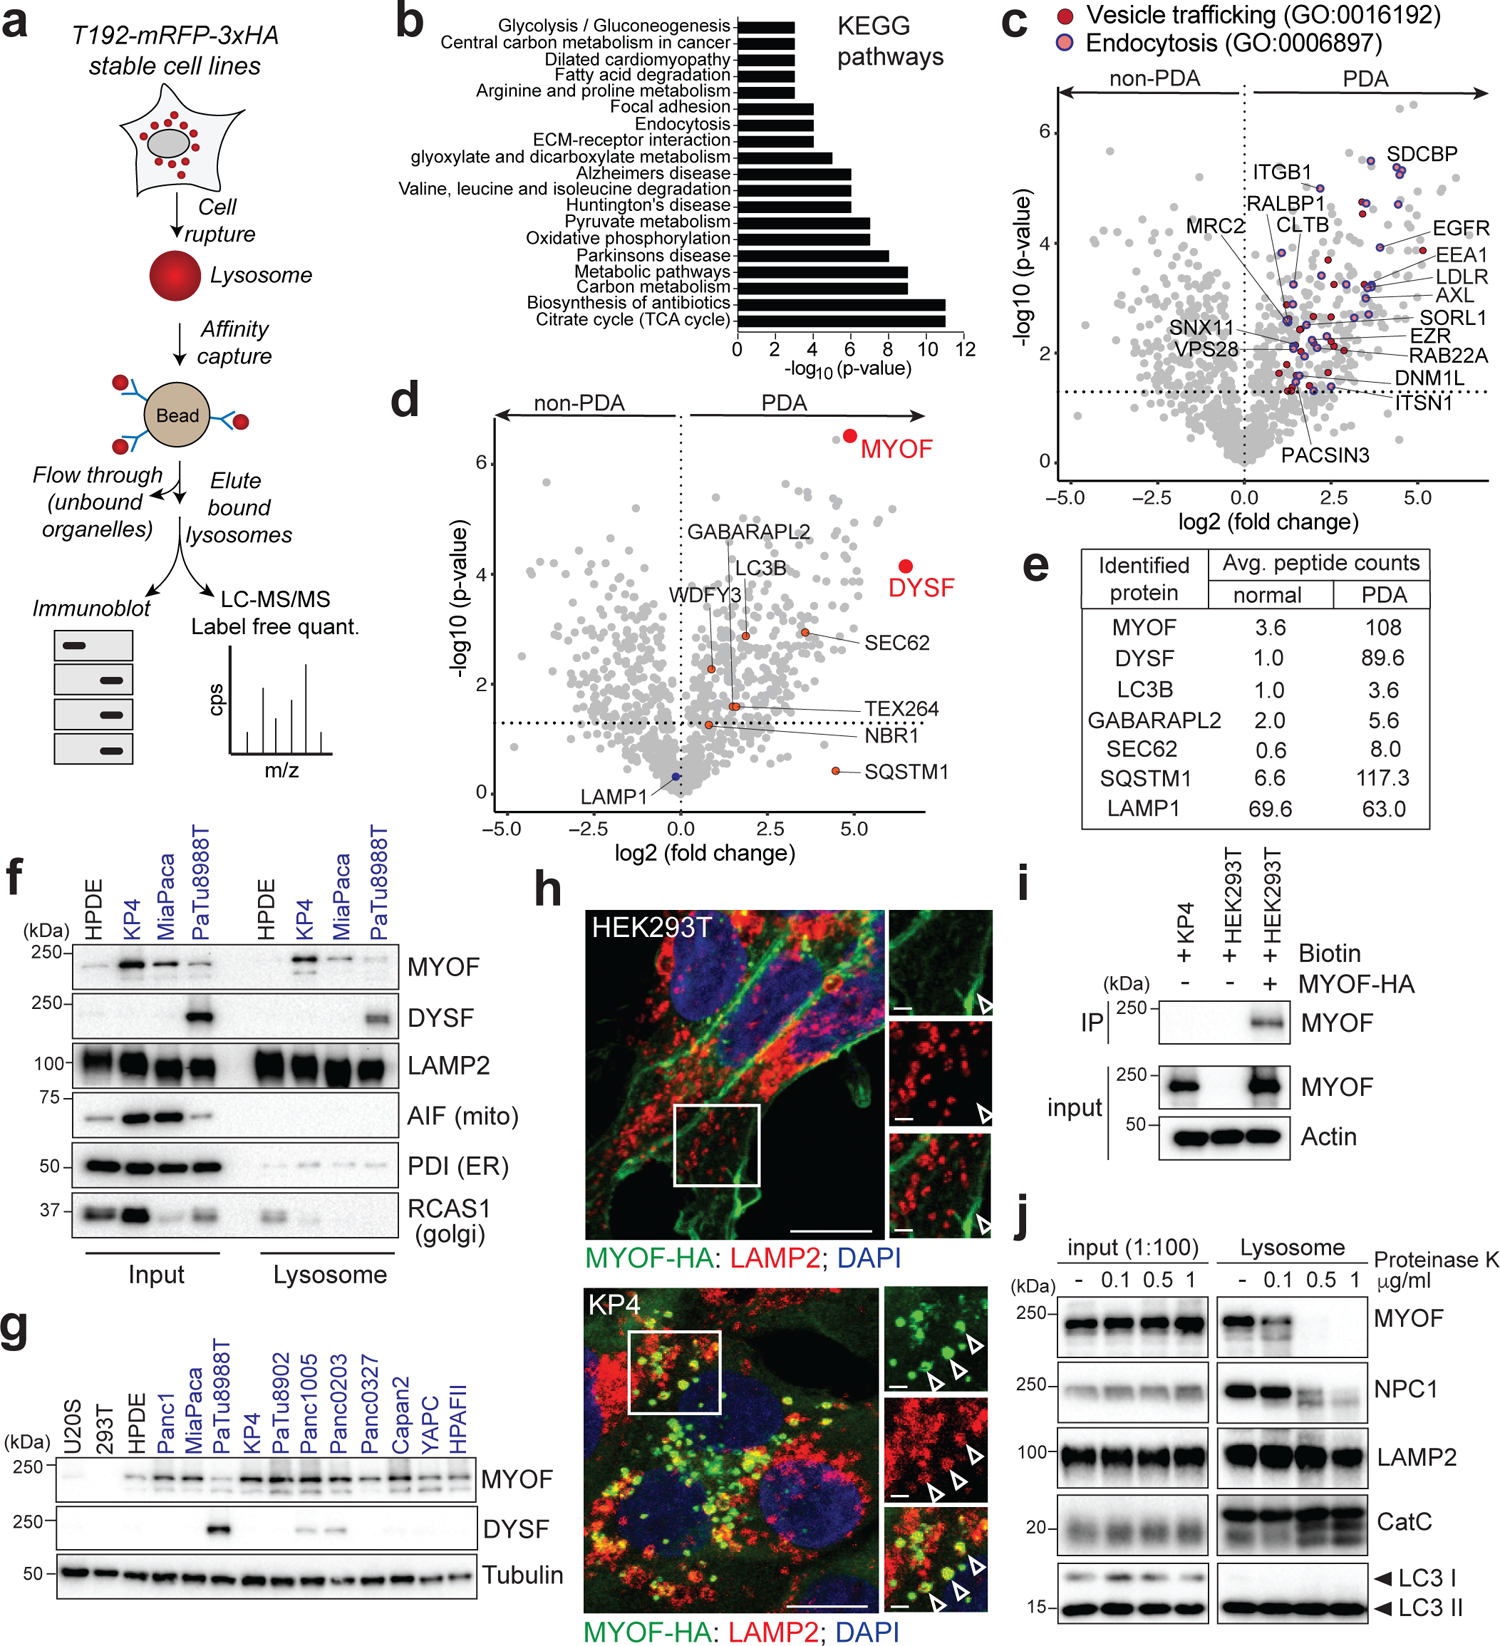
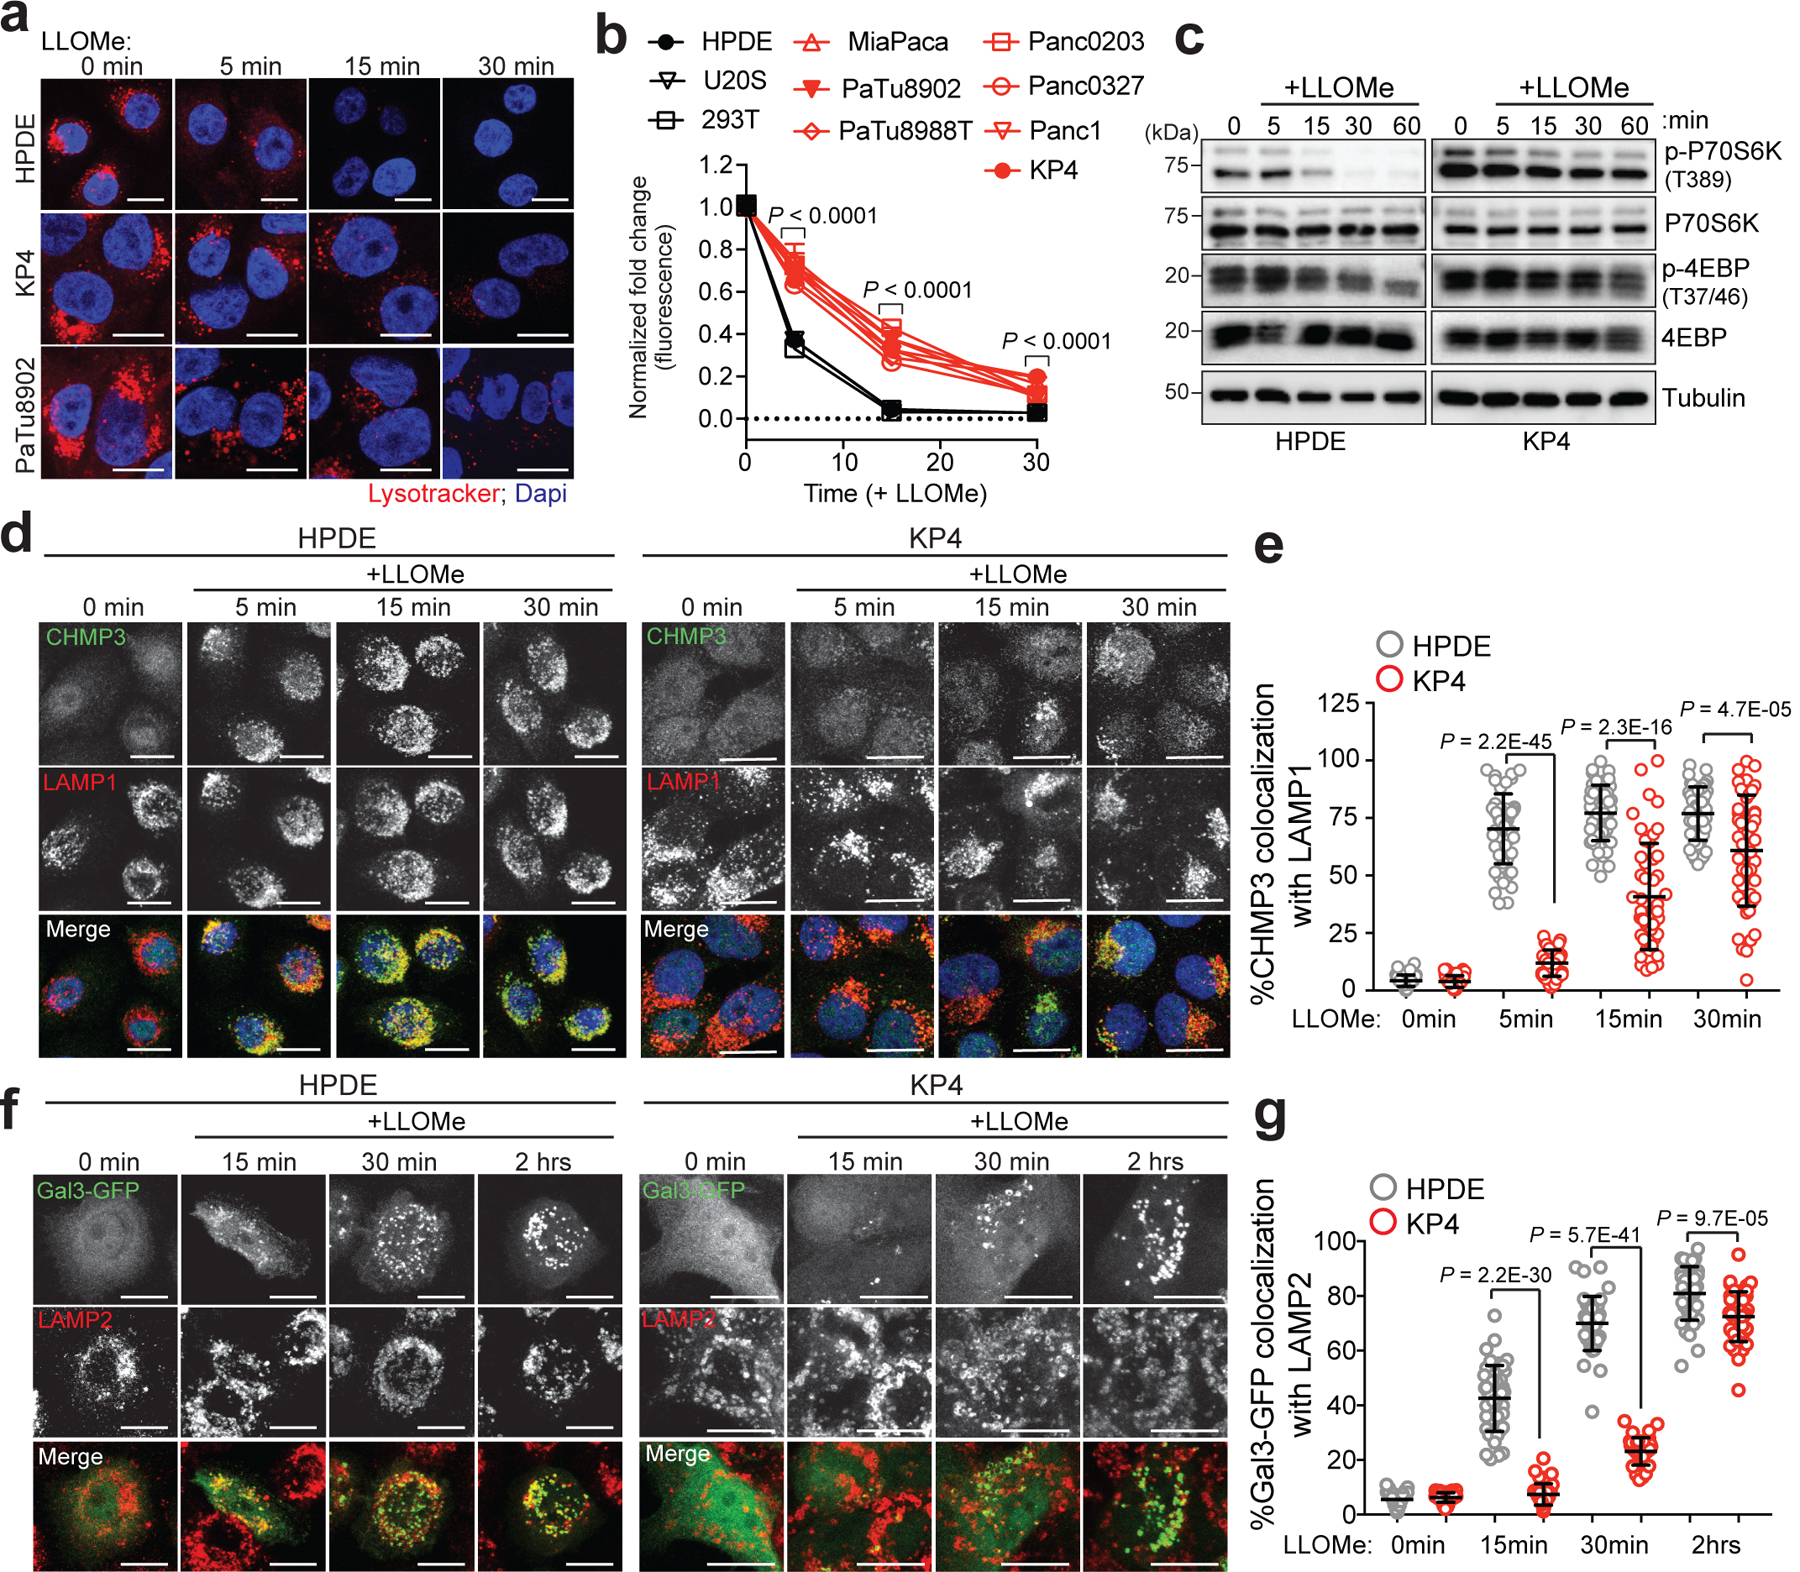
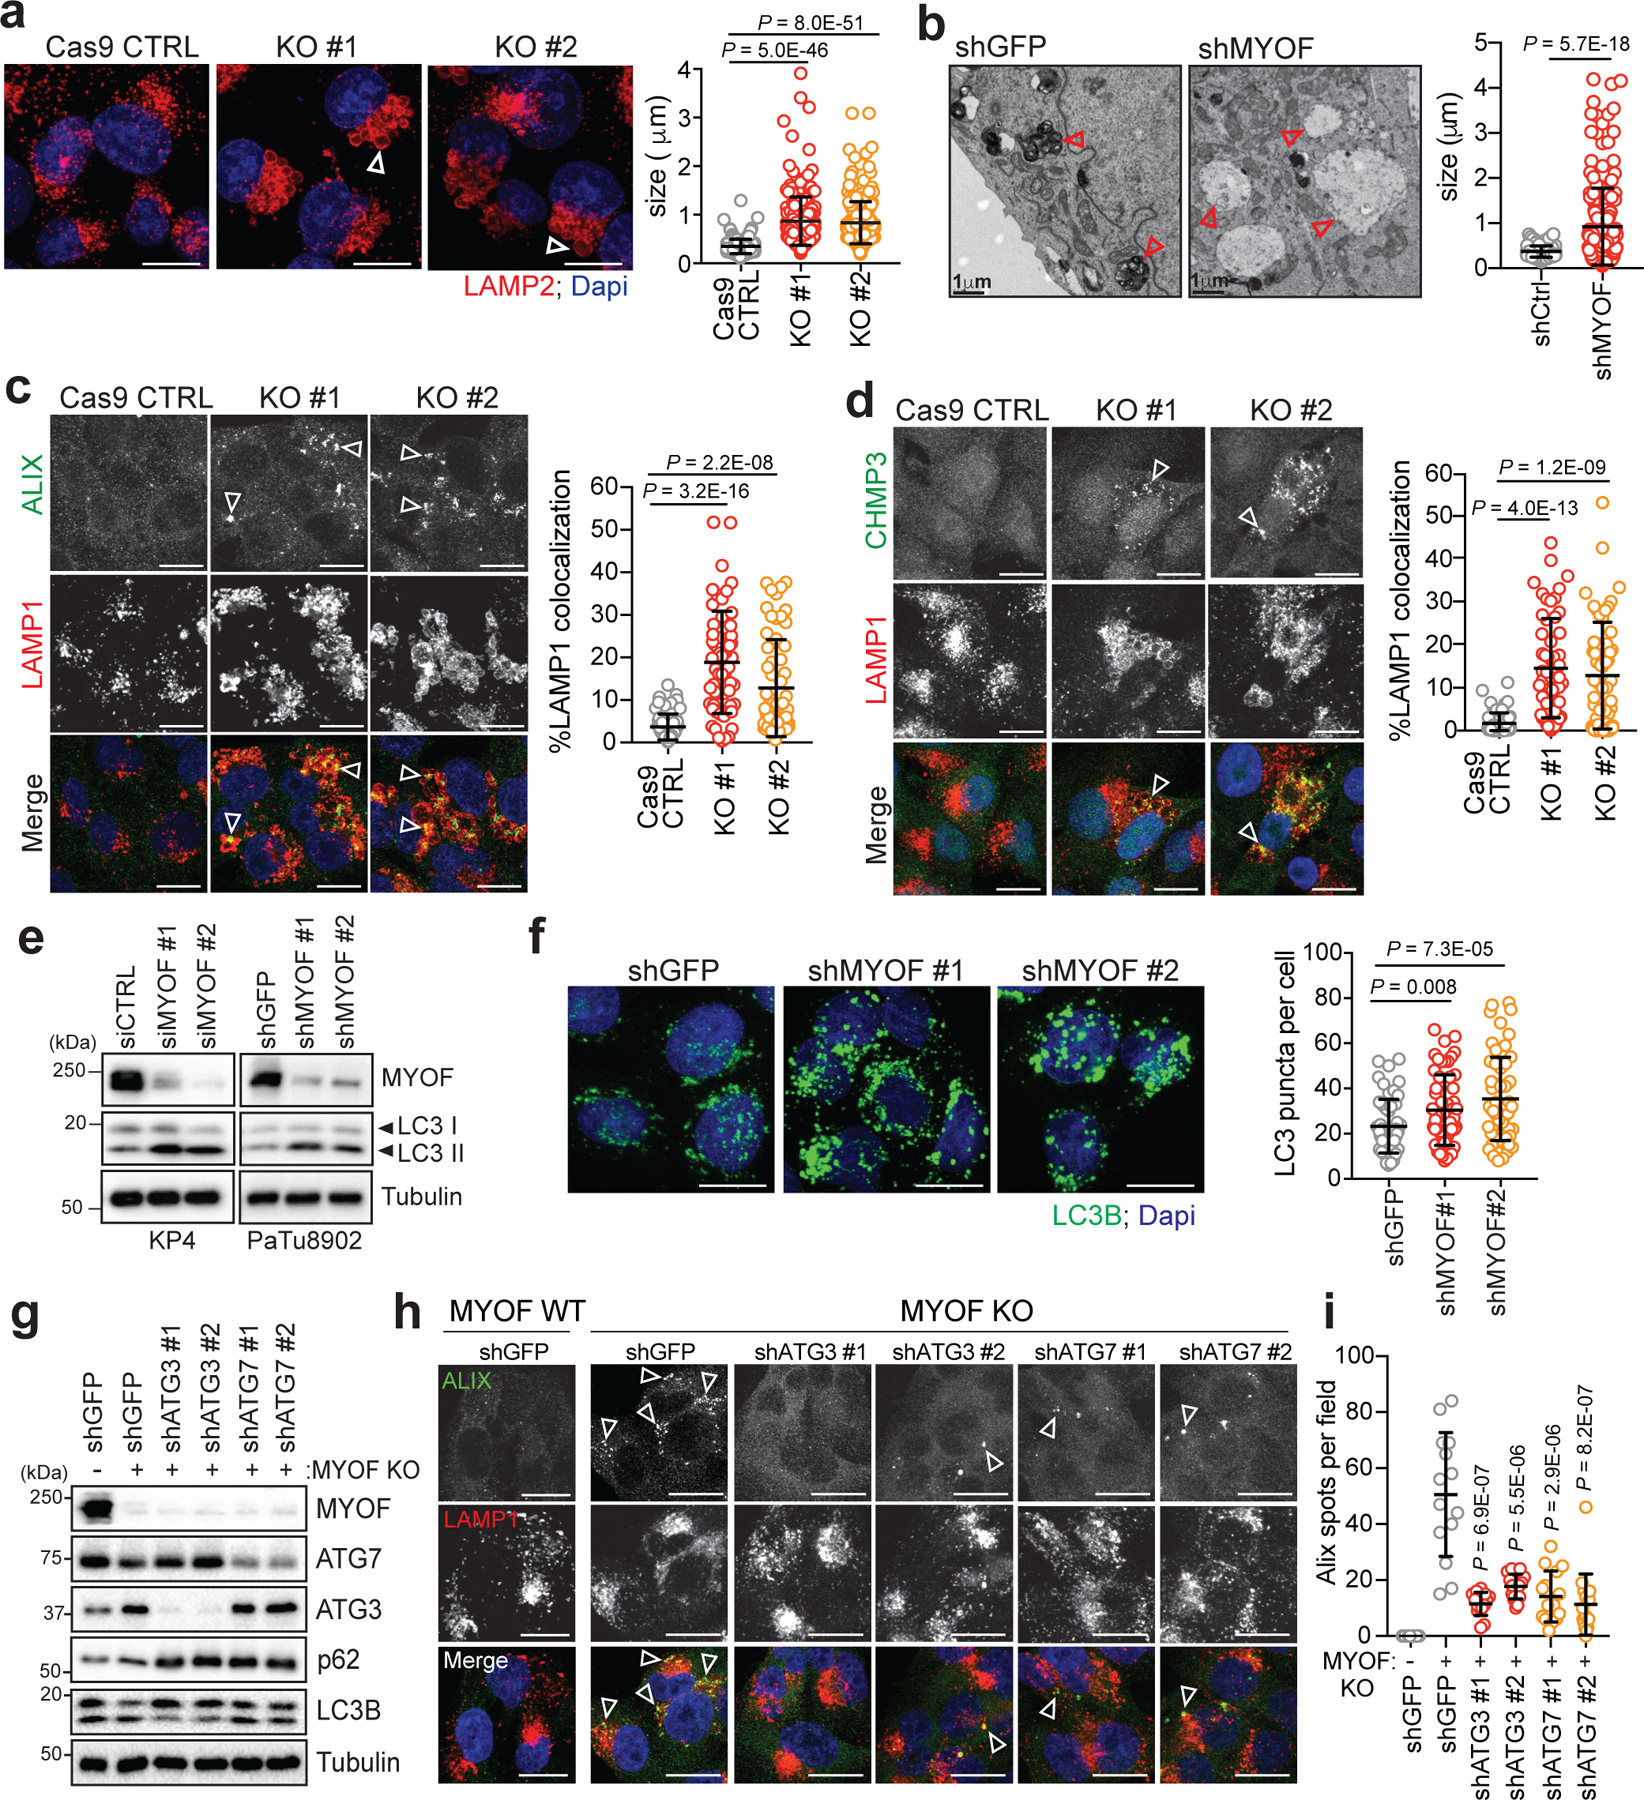
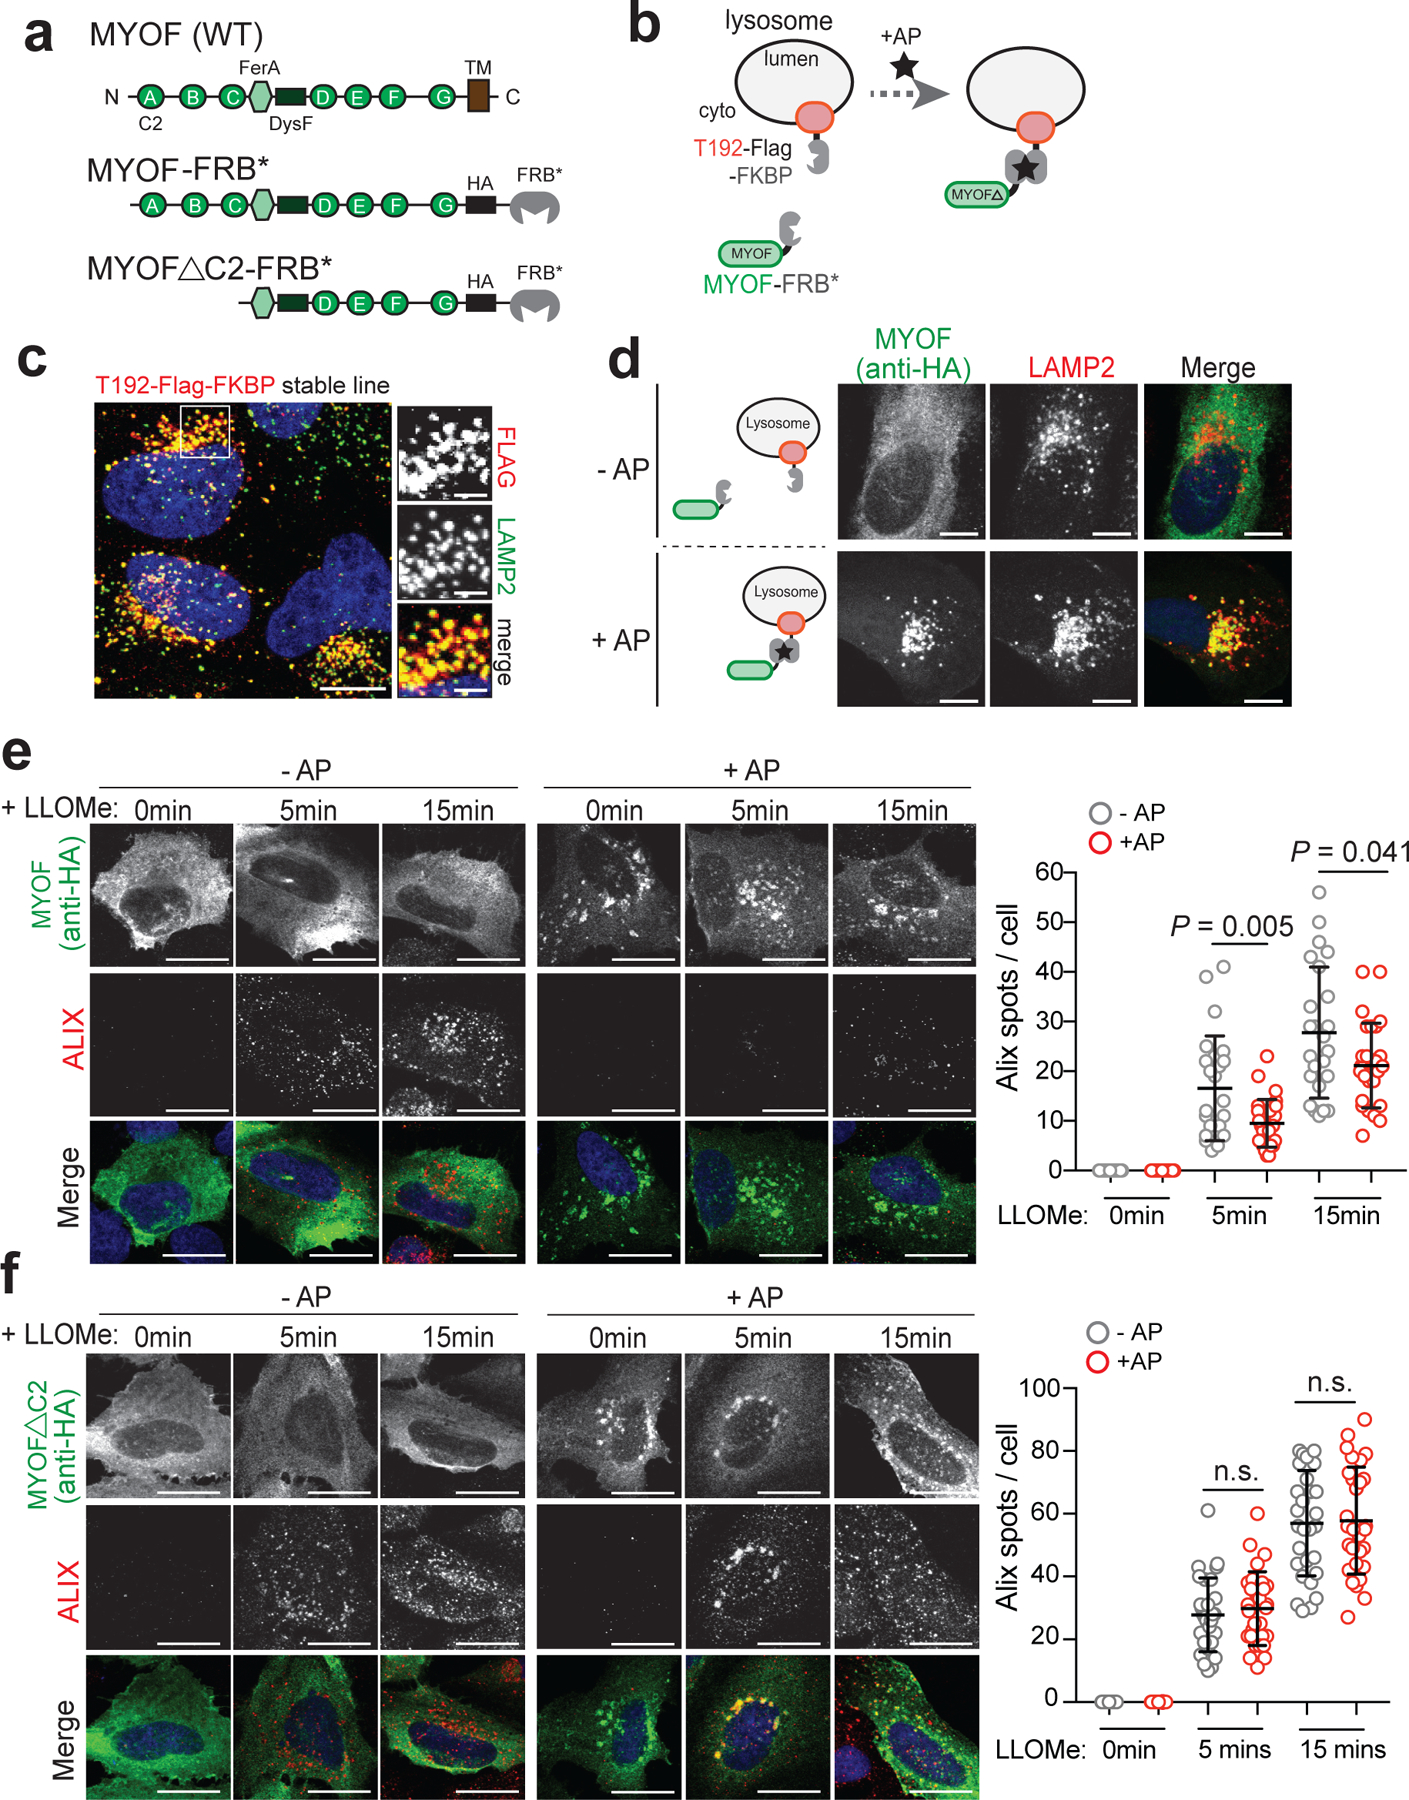
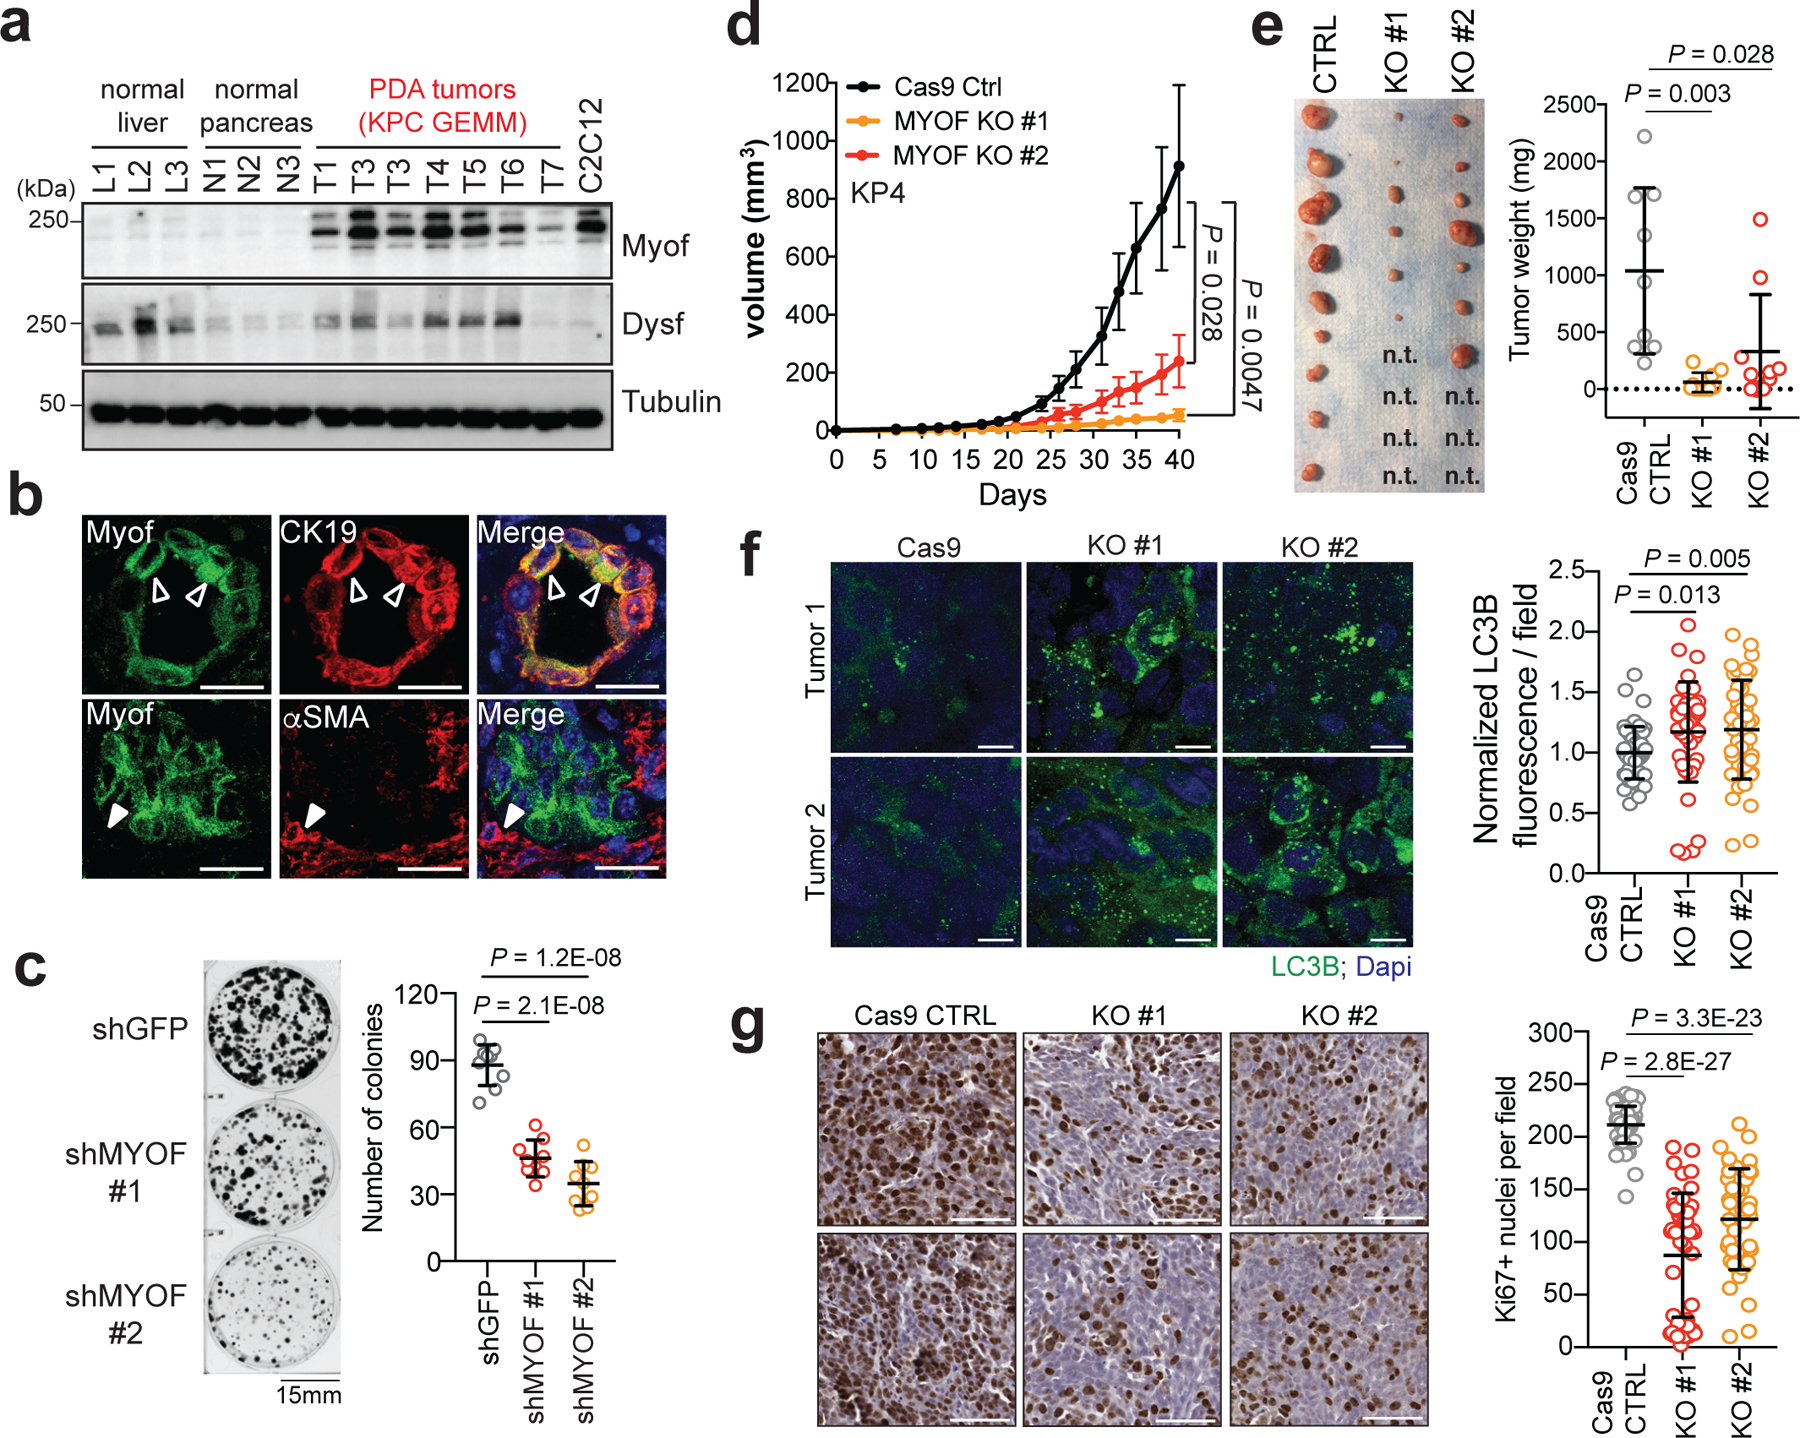
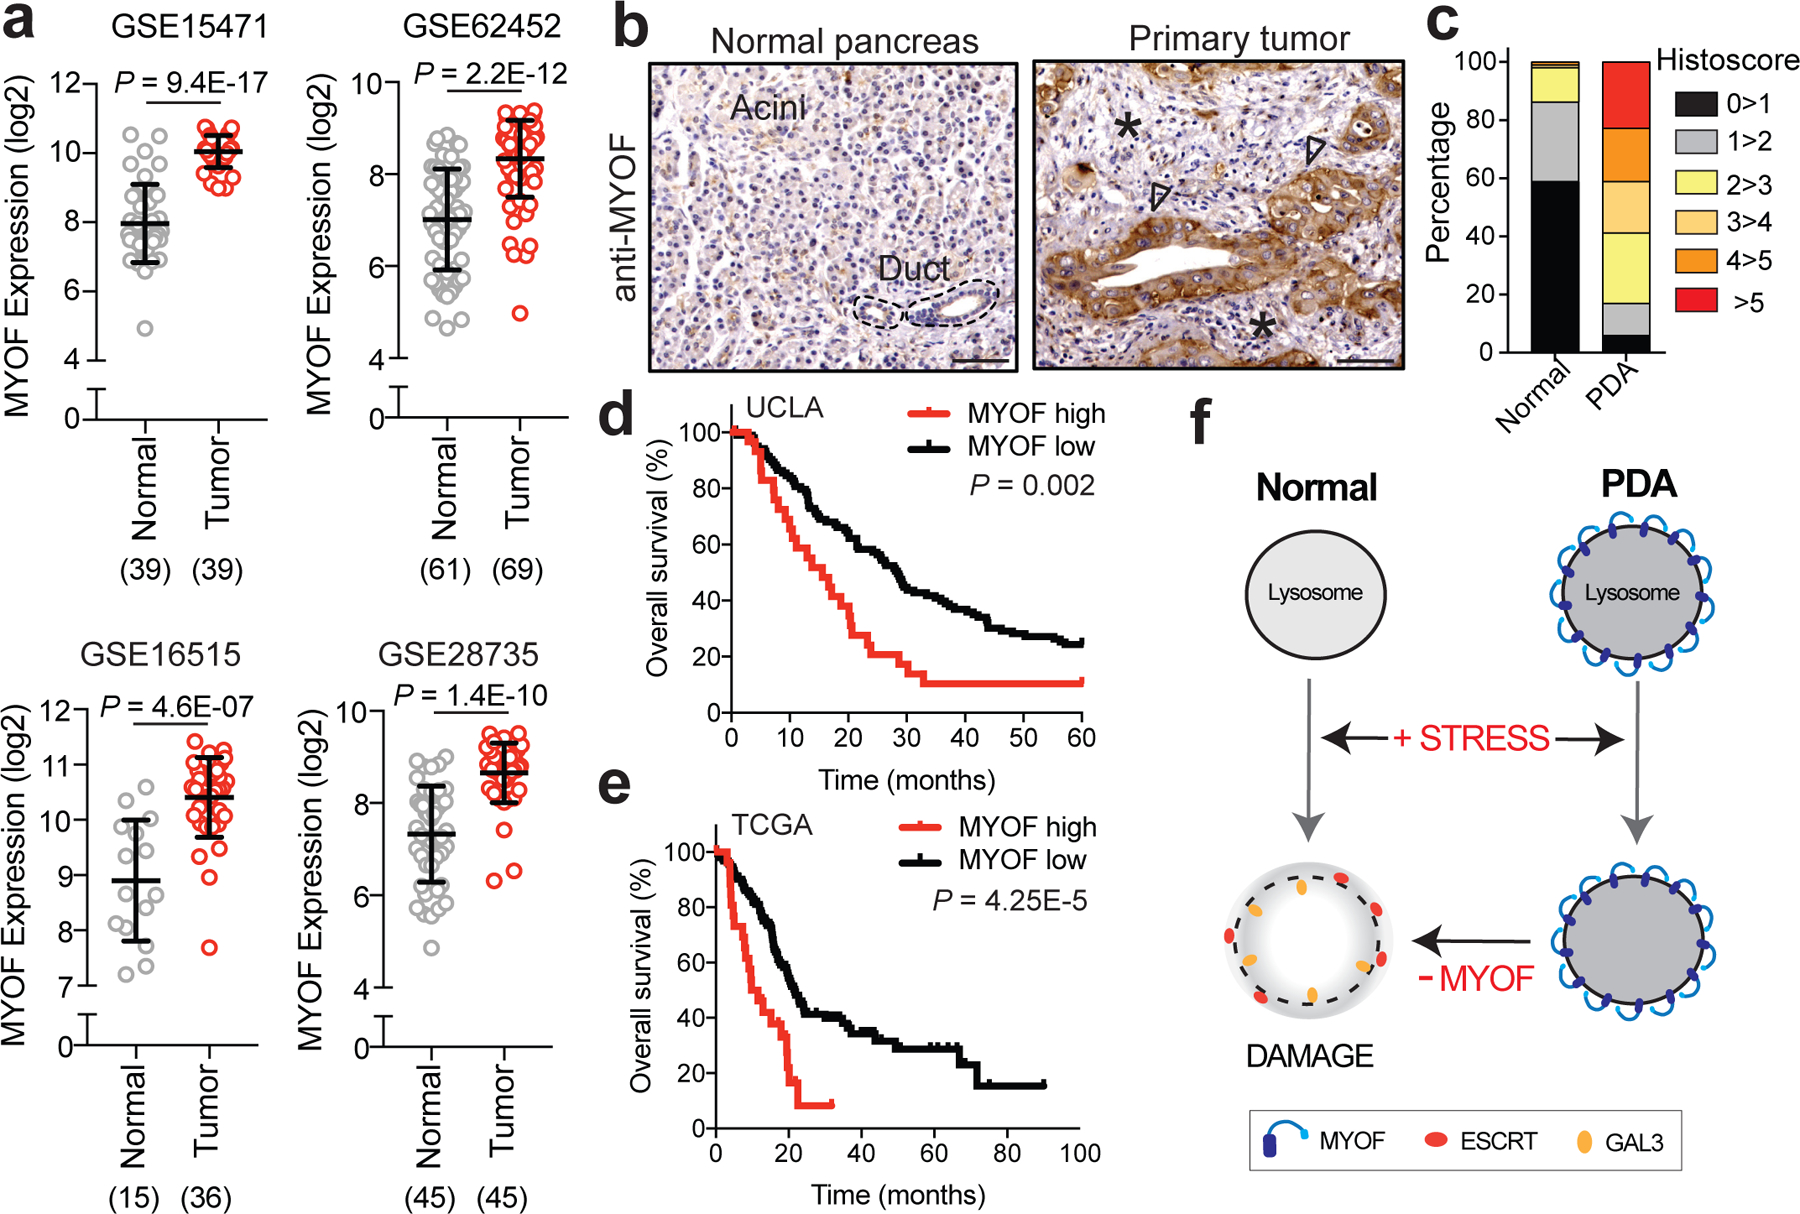
Lysosomes must maintain the integrity of their limiting membrane to ensure efficient fusion with incoming organelles and degradation of substrates within their lumen. Pancreatic cancer cells upregulate lysosomal biogenesis to enhance nutrient recycling and stress resistance, but it is unknown whether dedicated programmes for maintaining the integrity of the lysosome membrane facilitate pancreatic cancer growth. Using proteomic-based organelle profiling, we identify the Ferlin family plasma membrane repair factor Myoferlin as selectively and highly enriched on the membrane of pancreatic cancer lysosomes. Mechanistically, lysosomal localization of Myoferlin is necessary and sufficient for the maintenance of lysosome health and provides an early acting protective system against membrane damage that is independent of the endosomal sorting complex required for transport (ESCRT)-mediated repair network. Myoferlin is upregulated in human pancreatic cancer, predicts poor survival and its ablation severely impairs lysosome function and tumour growth in vivo. Thus, retargeting of plasma membrane repair factors enhances the pro-oncogenic activities of the lysosome.


Conflict of interest statement

Competing interests

The other authors declare no competing interests.

Figures

Extended Data Figure 1 |
Extended Data Figure 1 |. MYOF is a novel lysosomal membrane protein in PDA cells.
a. Co-localization of T192-mRFP-3xHA and endogenous LAMP2 in KP4 cells. b. qRT-PCR analysis of MYOF and DYSF mRNA levels across 10 human PDA cell lines and 3 non-PDA cell lines. Data is representative of n=3 biological replicates. c,d. Immuno-fluorescence staining of MYOF-HA (green) and LAMP2 (red) in PDA cell lines (MiaPaca, Patu8902 and Panc0203) (c) and non-PDA (U2OS and HPDE) cell lines (d). Arrowheads show examples of co-localization. e. Treatment of KP4, MiaPaCa and PaTu8988T cells with 75nM BafA1 for the indicated times causes an increase in p62 levels but not MYOF or DYSF. Graph shows the quantification of normalized fold change relative to LAMP1, averaged from 3 independent experiments. Data are mean ± s.d. Scale, 20μm for all panels.
Extended Data Figure 2 |
Extended Data Figure 2 |. PDA lysosomes are resistant to multiple membrane perturbing agents.
a. Time-course of lysotracker red staining in 293T and U20S cells following treatment with LLOMe. (293T, n= 86, 88, 88, 87 cells per time point ; U2OS n= 69, 63, 69, 65 cells per time point). b. Immunoblot showing the expression of Cathepsin C and Cathepsin B in the indicated cell lines. Asterisk denotes cell lines used throughout the study. c. Immunofluorescence quantification of Magic Red assay-based cathepsin protease activity in n = 65 cells per cell line. d. Time-course of lysotracker red staining in HPDE and KP4 cells following treatment with 0.5M sucrose. e. Normalized fold change of lysotracker staining. (HPDE, n = 64, 64, 65, 65 cells per time point; KP4, n = 64, 63, 63, 64 cells per time point). f. Time-course of lysotracker red staining in HPDE and KP4 cells following treatment with 100 μg/ml silica. g. Normalized fold change of lysotracker staining. (HPDE, n = 65 cells per time point; KP4, n = 65 cells per time point). h. Immunoblots for the indicated proteins in MiaPaca cells following a time course of 1mM LLOMe treatment. i. Immunoblots for the indicated proteins in HPDE, KP4 and MiaPaca cells following treatment for 1hr with increasing doses of LLOMe. Scale, 20μm for all panels. For box-and-whisker plots centre lines indicate median values and whiskers represent minimum and maximum values. Data are mean ± s.d. P values determined by unpaired two-tailed t-tests.
Extended Data Figure 3 |
Extended Data Figure 3 |. Recruitment of ESCRT proteins to PDA lysosomes is delayed following acute damage.
a-c. Time course of LLOMe (a), 0.5M sucrose (b), 100 μg/ml silica (c) treatment of HPDE and KP4 cells followed by immuno-fluorescence staining for ALIX (green) and LAMP1 (red). Graphs show the quantification of percentage co-localization of ALIX (LLOMe, n = 60 cells/condition for HPDE and KP4; sucrose, HPDE n = 13 fields/conditions, KP4 n= 13, 15, 15 fields/condition; silica, HPDE n = 14 fields/condition, KP4 n= 13, 13, 12 fields/condition) with LAMP1 positive lysosomes. d. Time course of LLOMe treatment of HPDE and KP4 cells followed by immuno-fluorescence staining for CHMP1A (green) and LAMP1 (red). e. Graph shows quantification of percentage co-localization of CHMP1A (n = 40 per cell line) with LAMP1 positive lysosomes. f. Immunoblot for the indicated proteins in lysosome fractions and flow through fractions isolated from HPDE- and KP4-T192-mRFP-3xHA stable cell lines treated with LLOMe for 10min. Scale, 20μm. Data are mean ± s.d. P values determined by unpaired two-tailed t-tests.
Extended Data Figure 4 |
Extended Data Figure 4 |. MYOF loss leads to lysosome dysfunction in PDA cells.
a. Immunoblot of MYOF in KP4 and PaTu8902 cells. b. LAMP2 staining (arrowheads) in MYOF KO PaTu8902 cells. Graph shows lysosome diameter control (Cas9; n = 252), MYOF KO #1 (n = 255) and MYOF KO #2 (n = 258) cells. c, d. LAMP2 staining (arrowheads) following knockdown of MYOF in PaTu8902 (c) and KP4 (d) cells. Graphs show lysosome diameter [PaTu8902 shGFP (n = 258), shMYOF#1 (n = 256), shMYOF#2 (n = 263); KP4 shGFP (n = 254), shMYOF#1 (n = 239), shMYOF#2 (n = 243) cells]. e. Lysotracker staining in KP4 cells following knockdown of MYOF. Graph shows normalized fold change in lysotracker fluorescence in control (shGFP, n = 70 cells) and KD (shMYOF#1, n = 65; shMYOF#2, n = 77) conditions. f. Recruitment of CHMP1A (green) to LAMP1 positive lysosomes (red) in MYOF KO (#1, n = 60; #2, n = 61) relative to Cas9 control (n = 58) KP4 cells. Graph shows the percentage CHMP1A co-localization with LAMP1. g,h. Representative FLIM images (g) of lysosomes labelled with Lyso-flipper in KP4 cells 72hrs post-transfection with siCTRL (left) or siMYOF (right). and lifetime (Tau 1) measurements (h) from siCTRL and siMYOF transfected cells (n = 4 experiments). Scale, 10 μm. i. Lyso Flipper lifetime measurements from KP4 Cas9 and MYOF KO cells (n = 3 experiments). j. Galectin 3 (GAL3; green) and LAMP1 (red) staining following LLOMe treatment of KP4 Cas9 or MYOF KO cells (n = 60 cells/condition). k. LC3B staining in PaTu8902 cells in shGFP (n = 55 cells) or shRNA MYOF (#1, n = 57; #2, n = 58) knockdown cells. Graph shows LC3B puncta per field. l. Degradation of macropinocytosed DQ-BSA in lysosomes [n = 54 (shGFP), 57 (shMYOF#1), 52 (shMYOF#2), n = 54 (BafA1) fluorescent spots/cell co-localizing with LAMP2 positive lysosomes]. m. Immunoblots from KP4 control (shGFP) or MYOF knockdown cells treated with or without 1mM LLOMe. Data are mean ± s.d. Scale, 20μm unless otherwise indicated. P values determined by unpaired two-tailed t-tests.
Extended Data Figure 5 |
Extended Data Figure 5 |. Autophagy suppression reverses lysosome damage response in MYOF KO cells.
a. Immunoblot confirming shRNA mediated knockdown of ATG3 and autophagy blockade in KP4 MYOF KO cells. b,c. Recruitment of CHMP1A (green) (b) or CHMP3 (green) (c) to lysosomes (LAMP1; red) in KP4 cells in the presence (WT) and absence (KO) of MYOF. shRNA mediated knockdown of ATG3 to suppress autophagy causes a decrease in lysosome localization of CHMP1A and CHMP3 in MYOF KO cells (n = 12 fields per condition). Scale, 20μm. Data are mean ± s.d. P values determined by unpaired two-tailed t-test.
Extended Data Figure 6 |
Extended Data Figure 6 |. Lysosomal targeting of MYOF delays onset of membrane damage.
a. U20S cells stably expressing T192-Flag-FKBP and transiently transfected with MYOF-FRB* were treated with 1mM LLOMe for the indicated time points in the presence or absence of AP, followed by immuno-staining for HA (green) and Galectin 3 (GAL3; red). Recruitment of MYOF-FRB* (green) protects against LLOMe induced Gal3 recruitment [n= 40 (control), 39 (15mins), 43 (30 mins), 41 (120mins) cells in the absence of AP and n = 39 (control), 45 (15mins), 41 (30mins) and 39 (120mins) cells in the presence of AP]. b. U20S cells stably expressing T192-Flag-FKBP and transfected with MYOFDC2-FRB* variant were treated as in ‘a’, followed by immuno-staining for HA (green) and ALIX (red). Recruitment of MYOFDC2 (green) does not protect against LLOMe induced ALIX recruitment [n = 26 cells per condition (−AP and +AP)]. Graphs at right show quantification of GAL3 (top) and ALIX (bottom) spots per cell in response to LLOMe. Scale, 20μm for all panels. Data are mean ± s.d. P values determined by unpaired two-tailed t-tests. n.s. not significant.
Extended Data Figure 7 |
Extended Data Figure 7 |. MYOF is required for growth of mouse PDA tumors.
a. Immunoblot of the indicated proteins in mouse KPC cells (FC1245) following CRISPR mediated knockout of Myof. b,c. Immunofluorescence staining of LC3B positive autophagosomes in FC1245 Myof KO cells relative to Cas9 control cells. Graph shows quantification of LC3B puncta from n = 11 fields per condition. Data are mean ± s.d. d,e. Immunofluorescence images of Lysotracker red staining in FC1245 Myof KO cells compared to Cas9 control cells. Graph shows quantification from n = 70 (Cas9 control), 71 (KO#1), 70 (KO#2) cells per condition. Data are mean ± s.d. f. Growth rate of Cas9 control and Myof KO FC1245 allografts following s.c. transplantation in syngeneic C57BL/6 host mice. N=6 (Cas9 ctrl), 5 (KO#1), 5 (KO#2) animals per group. Scale, 20μm for all panels. Data represent mean ± s.e.m. P values determined by unpaired two-tailed t-tests.
Extended Data Figure 8 |
Extended Data Figure 8 |. DYSF expression in PDA patient samples.
DYSF transcript levels in human PDA patient specimens from 4 independent datasets as indicated. The number of samples are indicated under each graph in parentheses. Data are mean ± s.d. P values determined by unpaired two-tailed t-tests.
Extended Data Figure 9 |
Extended Data Figure 9 |. MYOF and DYSF expression in colorectal, NSCLC and breast cancer.
a,c,e. MYOF transcript levels in human colorectal cancer (CRC) (a), Non-small cell lung cancer (NSCLC) (c), and invasive breast cancer (e) patient specimens relative to normal colon, lung and breast from the indicated datasets (4 per tissue type). b,d,f. DYSF transcript levels in human colorectal cancer (CRC) (b), Non-small cell lung cancer (NSCLC) (d), and invasive breast cancer (f) patient specimens relative to normal colon, lung and breast from the indicated datasets (as in a,c,e). Note MYOF levels are elevated in only 2 datasets while DYSF levels are elevated in 1 dataset. The number of samples are indicated under each graph in parentheses. Data are mean ± s.d. P values determined by unpaired two-tailed t-tests.
Fig. 1 |
Fig. 1 |. Organelle proteomics identifies the Ferlin repair factors as PDA specific lysosome associated membrane proteins.
a. Schematic showing lysosome purification using affinity-based capture from cells stably expressing T192-mRFP-3xHA. b. KEGG pathway analysis of ≥2-fold enriched PDA lysosome associated proteins. c. Volcano plot of lysosome proteomics data from non-PDA (HEK293T) and PDA (PaTu8988T) cells. Data are plotted as log2 fold change (PDA/non-PDA) versus the -log10 of the p-value. ≥2-fold enriched proteins associated with “vesicle mediated trafficking” are indicated in dark red and overlapping proteins associated with ”endocytosis” are indicated in pink/blue (see supplementary table 1). d. Identical volcano plot as in (c) indicating autophagy related proteins (orange) and MYOF and DYSF (red). e. Average peptide counts for the indicated proteins from n = 3 biological replicates. f. Immunoprecipitation of purified lysosomes from the indicated cell lines showing enrichment of MYOF and DYSF in PDA lysosome fractions. LAMP2 serves as a loading control while absence of AIF, PDI and RCAS1 confirm organelle purity. g. Immunoblot showing levels of MYOF and restricted expression of DYSF in the indicated human cell lines (PDA highlighted in blue). h. Immuno-fluorescence staining of MYOF-HA (green) and LAMP2 (red) in HEK293T (left) and KP4 (right) cells. Arrowheads indicate plasma membrane localization of MYOF in HEK293T cells and lysosome localization in KP4 cells. Scale, 20μm, inset scale, 2μm. i. Biotinylation of cell surface proteins in KP4 and HEK293T cells expressing MYOF-HA. Biotinylated proteins were immuno-precipitated and western-blotted for MYOF. Note, MYOF is not on the cell surface of KP4 cells while MYOF-HA is present on the cell surface when expressed in HEK293T cells. j. Affinity purified lysosomes were treated with increasing concentrations of Proteinase K as indicated. Intraluminal proteins are protected from degradation (LAMP2, Cathepsin C, LC3B) while extra-luminal proteins are sensitive to digestion (NPC1 and MYOF). Statistics source data are provided in Source data. Unmodified blots are provided in Source Data Figure 1. Experiments depicted in i, g, j are representative of two independent experiments.
Fig. 2 |
Fig. 2 |. PDA lysosomes are more resistant to lysosome membrane damage.
a. Time-course of lysotracker red staining in HPDE, KP4 and PaTu8902 following treatment with LLOMe. b. Quantification of normalized fold change in lysotracker red stain in the indicated cell lines treated with LLOMe. Data are mean ± s.e.m (HPDE n = 76, 80, 81, 80; KP4 n = 80, 77, 80, 82; PaTu8902 n = 96, 96, 81, 82 cells; HEK293T n= 81, 83, 83, 82; U2OS n= 64, 58, 64, 60 cells per time point; MiaPaCa; Panc0203; PaTu8988T; Panc0327, Panc1 n= 60 cells per time point). P values determined by two-way ANOVA. c. Immunoblots for the indicated proteins in HPDE and KP4 cells following time course treatment with LLOMe. d. HPDE and KP4 cells with and without LLOMe treatment were co-stained for CHMP3 (green) and LAMP1 (red). e. Quantification of percentage co-localization in control and LLOMe treated cells. (HPDE n = 50, 51, 50, 51; KP4 n = 51, 50, 50, 50 cells per time point). f. HPDE and KP4 cells expressing GFP-Galectin 3 (green) were treated with LLOMe for the indicated times and co-stained for LAMP2 (red). g. Quantification of percentage co-localization in control and LLOMe treated cells. (HPDE n = 39, 43, 40, 42; KP4 n = 43, 42, 40, 42 cells per time point). Scale, 20μm for all panels. Data are mean ± s.d. P values determined by unpaired two-tailed t-tests. Statistics source data are provided in Source data. Unmodified blots are provided in Source Data Figure 2. Experiments depicted in d, f are representative of two independent experiments.
Fig. 3 |
Fig. 3 |. MYOF is essential for lysosome function in PDA cells.
a. Immunofluorescence staining of LAMP2 (red) following CRISPR mediated knockout of MYOF and Cas9 control KP4 cells. Graph at right shows measurement of lysosome diameter from n = 252 (Cas9 control), 251 (KO#1, KO#2). b. Representative electron microscopy images showing aberrant lysosome morphology in KP4 cells following shRNA mediated knockdown of MYOF. Arrowheads highlight differential lysosome morphology in shGFP versus shMYOF conditions. Graph on the right shows quantification of lysosome diameter (n = 200 lysosomes from control; n = 202 lysosomes from MYOF KD cells). Scale bar 1μm. c, d. Increased recruitment of ALIX (green; arrowheads) (c) and CHMP3 (green; arrowheads) (d) to LAMP1 positive lysosomes (red) following KO of MYOF in KP4 cells relative to Cas9 control cells. Graphs show the quantification of percentage ALIX (n = 60 fields per condition) and CHMP3 (n = 57 fields per condition) co-localization with LAMP1. e. Immunoblot showing increased LC3B lipidation (arrowheads) in KP4 and 8902 cells upon siRNA or shRNA mediated knockdown of MYOF. f. Immunofluorescence staining for LC3B (green) showing increase accumulation of LC3B positive autophagosomes in KP4 cells following shRNA mediated knockdown of MYOF compared to control cells. Graph on the right shows quantification of LC3B puncta (n = 14 fields/condition). g. Immunoblot confirming shRNA mediated knockdown of ATG3 and ATG7 and autophagy blockade in KP4 MYOF KO cells. h. Recruitment of ALIX (green; arrowheads) to lysosomes (LAMP1; red) in KP4 cells in the presence (WT; n = 14) and absence (KO; n = 14) of MYOF. shRNA mediated knockdown of ATG3 (n = 14 (#1), 15 (#2) fields per condition) or ATG7 (n = 15 (#1), 16 (#2) fields per condition) to suppress autophagy causes a decrease in lysosome localization of ALIX in MYOF KO cells. i. Graph on the right shows quantification of ALIX puncta per condition. Scale, 20μm. Data are mean ± s.d. P values determined by unpaired two-tailed t-tests. Statistics source data are provided in Source data. Unmodified blots are provided in Source Data Figure 3. Experiment depicted in g are representative of two independent experiments.
Fig. 4 |
Fig. 4 |. The N terminal C2 domains of MYOF are required for membrane protection.
a. Domain structure of MYOF and MYOF-FRB* variants. b. Schematic showing heterodimerization of MYOF-FRB* to lysosome membrane anchored T192-Flag-FKBP following addition of the rapalogue (AP21967; AP). TM, transmembrane domain. c. Lysosomal localization of T192-Flag-FKBP (Flag) in stably expressing U20S cells. d. Transient expression of MYOF-FRB* (MYOF; detected with anti-HA antibody) in U20S cells stably expressing T192-Flag-FKBP. In the absence of AP, MYOF-FRB* is cytoplasmic while upon AP addition MYOFΔTM is recruited to LAMP2 positive lysosomes (red). e. Recruitment of MYOF-FRB* protects against LLOMe induced damage and ALIX recruitment. U20S-T192-Flag-FKBP expressing cells transfected with MYOF-FRB* were treated with LLOMe for the indicated time points in the absence of AP (- AP; n = 30, 24, 24 cells per time point) or presence of AP (+ AP; n = 30, 27, 27 cells per time point), followed by immuno-staining for HA (green) and ALIX (red). f. U20S-T192-Flag-FKBP cells transfected with MYOFΔC2-FRB were treated as in ‘e’ (- AP n = 29 cells per time point; + AP n = 29 cells per time point) followed by immuno-staining for HA (green) and ALIX (red). Lysosomal recruitment of MYOFΔC2 does not protect against LLOMe induced ALIX recruitment. Graphs at right show quantification of ALIX spots per cell in response to LLOMe. Scale for all panels, 20μm. Data are mean ± s.d. P values determined by unpaired two-tailed t-tests. Statistics source data are provided in Source data.
Fig. 5 |
Fig. 5 |. MYOF is required for PDA tumour growth.
a. Expression levels of Myof and Dysf in mouse KPC derived PDA tumours (n = 7 mice) relative to normal liver (n = 3 mice), normal pancreas (n = 3 mice) and the mouse myoblast cell line, C2C12. b. Immuno-fluorescence staining of Myof (green), the epithelial marker CK19 (red; top) and the stromal marker α-SMA (red, bottom) in mouse KPC tumours (representative images of n = 2 independent tumors) showing co-localization of Myof with CK19 (open arrowheads) but not α-SMA (close arrow heads). Scale, 50μm. c. Colony formation of shGFP or shMYOF infected KP4 cells. Graph shows quantification of colony area per condition from n = 9 independent experiments. d. In vivo growth in nude mice of s.c. KP4 xenografts following CRISPR mediated KO of MYOF. N = 9 (CTRL), 10 (KO#1), 10 (KO#2) tumours per group. Error bars represent s.e.m. e. Images (left) and tumour weight (right) of control and MYOF KO KP4 xenografts resected at day 42. n.t. no macroscopic tumour identified upon resection. f. Immunostaining for LC3B in resected tumors (n = 4 tumors per group) showing increased staining in the KO tumors. Graph shows quantification of LC3B staining in Cas9 control tumors (n = 48 fields), MYOF KO#1 (n = 44 fields) and MYOF KO#2 (n = 45 fields). Scale, 20μm. g. Ki67 staining of control and MYOF KO xenografts. Graph shows quantification of Ki67 positive nuclei from Cas9 control tumors (n = 56 fields) from 4 tumors, MYOF KO#1 (n=46 fields), MYOF KO#2 (n = 46 fields) from 3 tumours per group. Scale, 100 μm. Data are mean ± s.d. P values determined by unpaired two-tailed t-test. Statistics source data are provided in Source data. Unmodified blots are provided in Source Data Figure 5.
Fig. 6 |
Fig. 6 |. High MYOF expression levels correlate with aggressive disease.
a. MYOF transcript levels in human PDA specimens and normal pancreas (adjacent non-neoplastic tissue) from the indicated datasets. The number of samples are indicated under each graph in parentheses. b. Immuno-histochemistry showing increased expression of MYOF in primary patient PDA tumour epithelia (arrowheads) compared to normal pancreas or adjacent stroma (asterisk). Scale, 100μm. c. Percentage distribution of semi-quantitative histoscore of MYOF staining across normal adjacent (n = 102 patient samples) and primary PDA (n = 136 patient samples). d, e. High expression of MYOF predicts shorter overall survival in two patient cohorts. N = 136 patients in the UCLA cohort (MYOF high n=31, MYOF low n=105) and n = 185 in The Cancer Genome Atlas (TCGA) cohort (MYOF high; Z score > 1, n = 27 pateint samples; MYOF low Z score < 1, n = 158 patient samples). p-Value calculated by Log-rank test. f. Model comparing lysosomal response to stress in normal (left) and PDA (right) cells. Lysosomal retargeting of MYOF in PDA cells provides protection against membrane stress caused by increased rates of vesicular traffic. Loss of MYOF renders PDA lysosomes more vulnerable to damage. Data are mean ± s.d. P values determined by unpaired two-tailed t-tests. Statistics source data are provided in Source data.

References

    1. Lawrence RE & Zoncu R The lysosome as a cellular centre for signalling, metabolism and quality control. Nat Cell Biol 21, 133–142, doi:10.1038/s41556-018-0244-7 (2019). - DOI - PubMed
    1. Perera RM & Zoncu R The Lysosome as a Regulatory Hub. Annu Rev Cell Dev Biol 32, 223–253, doi:10.1146/annurev-cellbio-111315-125125 (2016). - DOI - PMC - PubMed
    1. Ballabio A & Bonifacino JS Lysosomes as dynamic regulators of cell and organismal homeostasis. Nat Rev Mol Cell Biol 21, 101–118, doi:10.1038/s41580-019-0185-4 (2020). - DOI - PubMed
    1. Commisso C et al. Macropinocytosis of protein is an amino acid supply route in Ras-transformed cells. Nature 497, 633–637, doi:10.1038/nature12138 (2013). - DOI - PMC - PubMed
    1. Kamphorst JJ et al. Human pancreatic cancer tumors are nutrient poor and tumor cells actively scavenge extracellular protein. Cancer Res 75, 544–553, doi:10.1158/0008-5472.CAN-14-2211 (2015). - DOI - PMC - PubMed

Publication types

MeSH terms