. 2021 Apr;22(4):449-459.
doi: 10.1038/s41590-021-00883-8. Epub 2021 Mar 8.

Stepwise chromatin and transcriptional acquisition of an intraepithelial lymphocyte program

Affiliations

Stepwise chromatin and transcriptional acquisition of an intraepithelial lymphocyte program

Mariya London et al. Nat Immunol. 2021 Apr.

Abstract

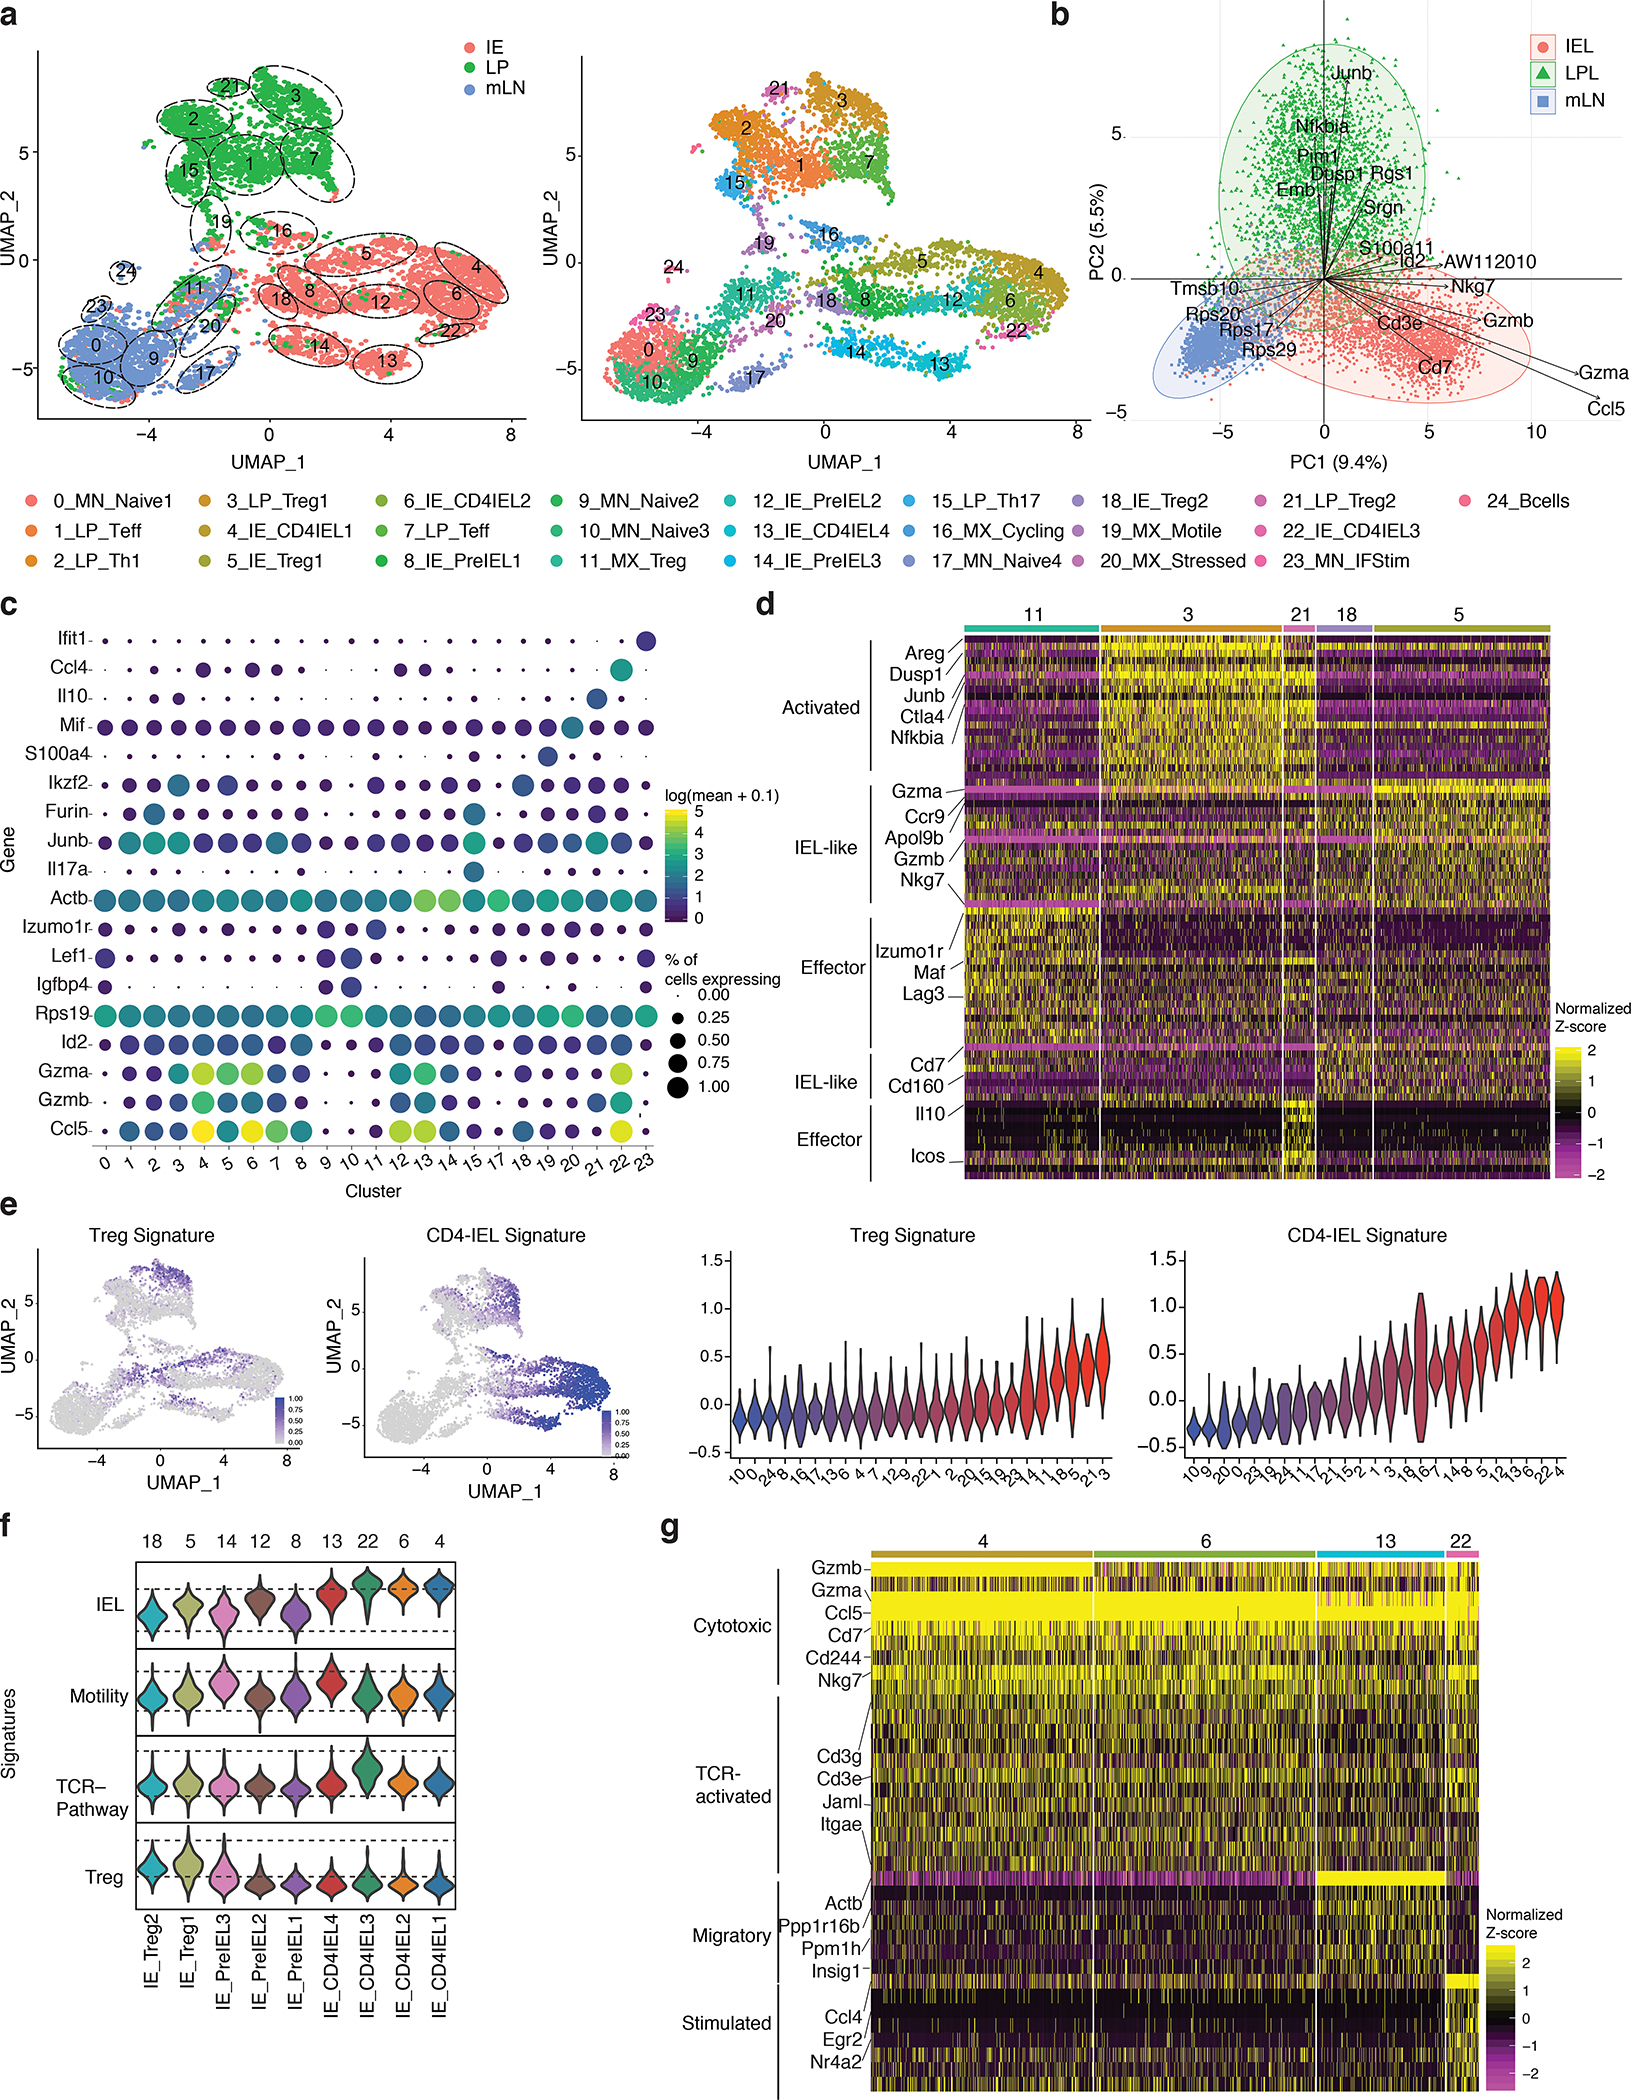
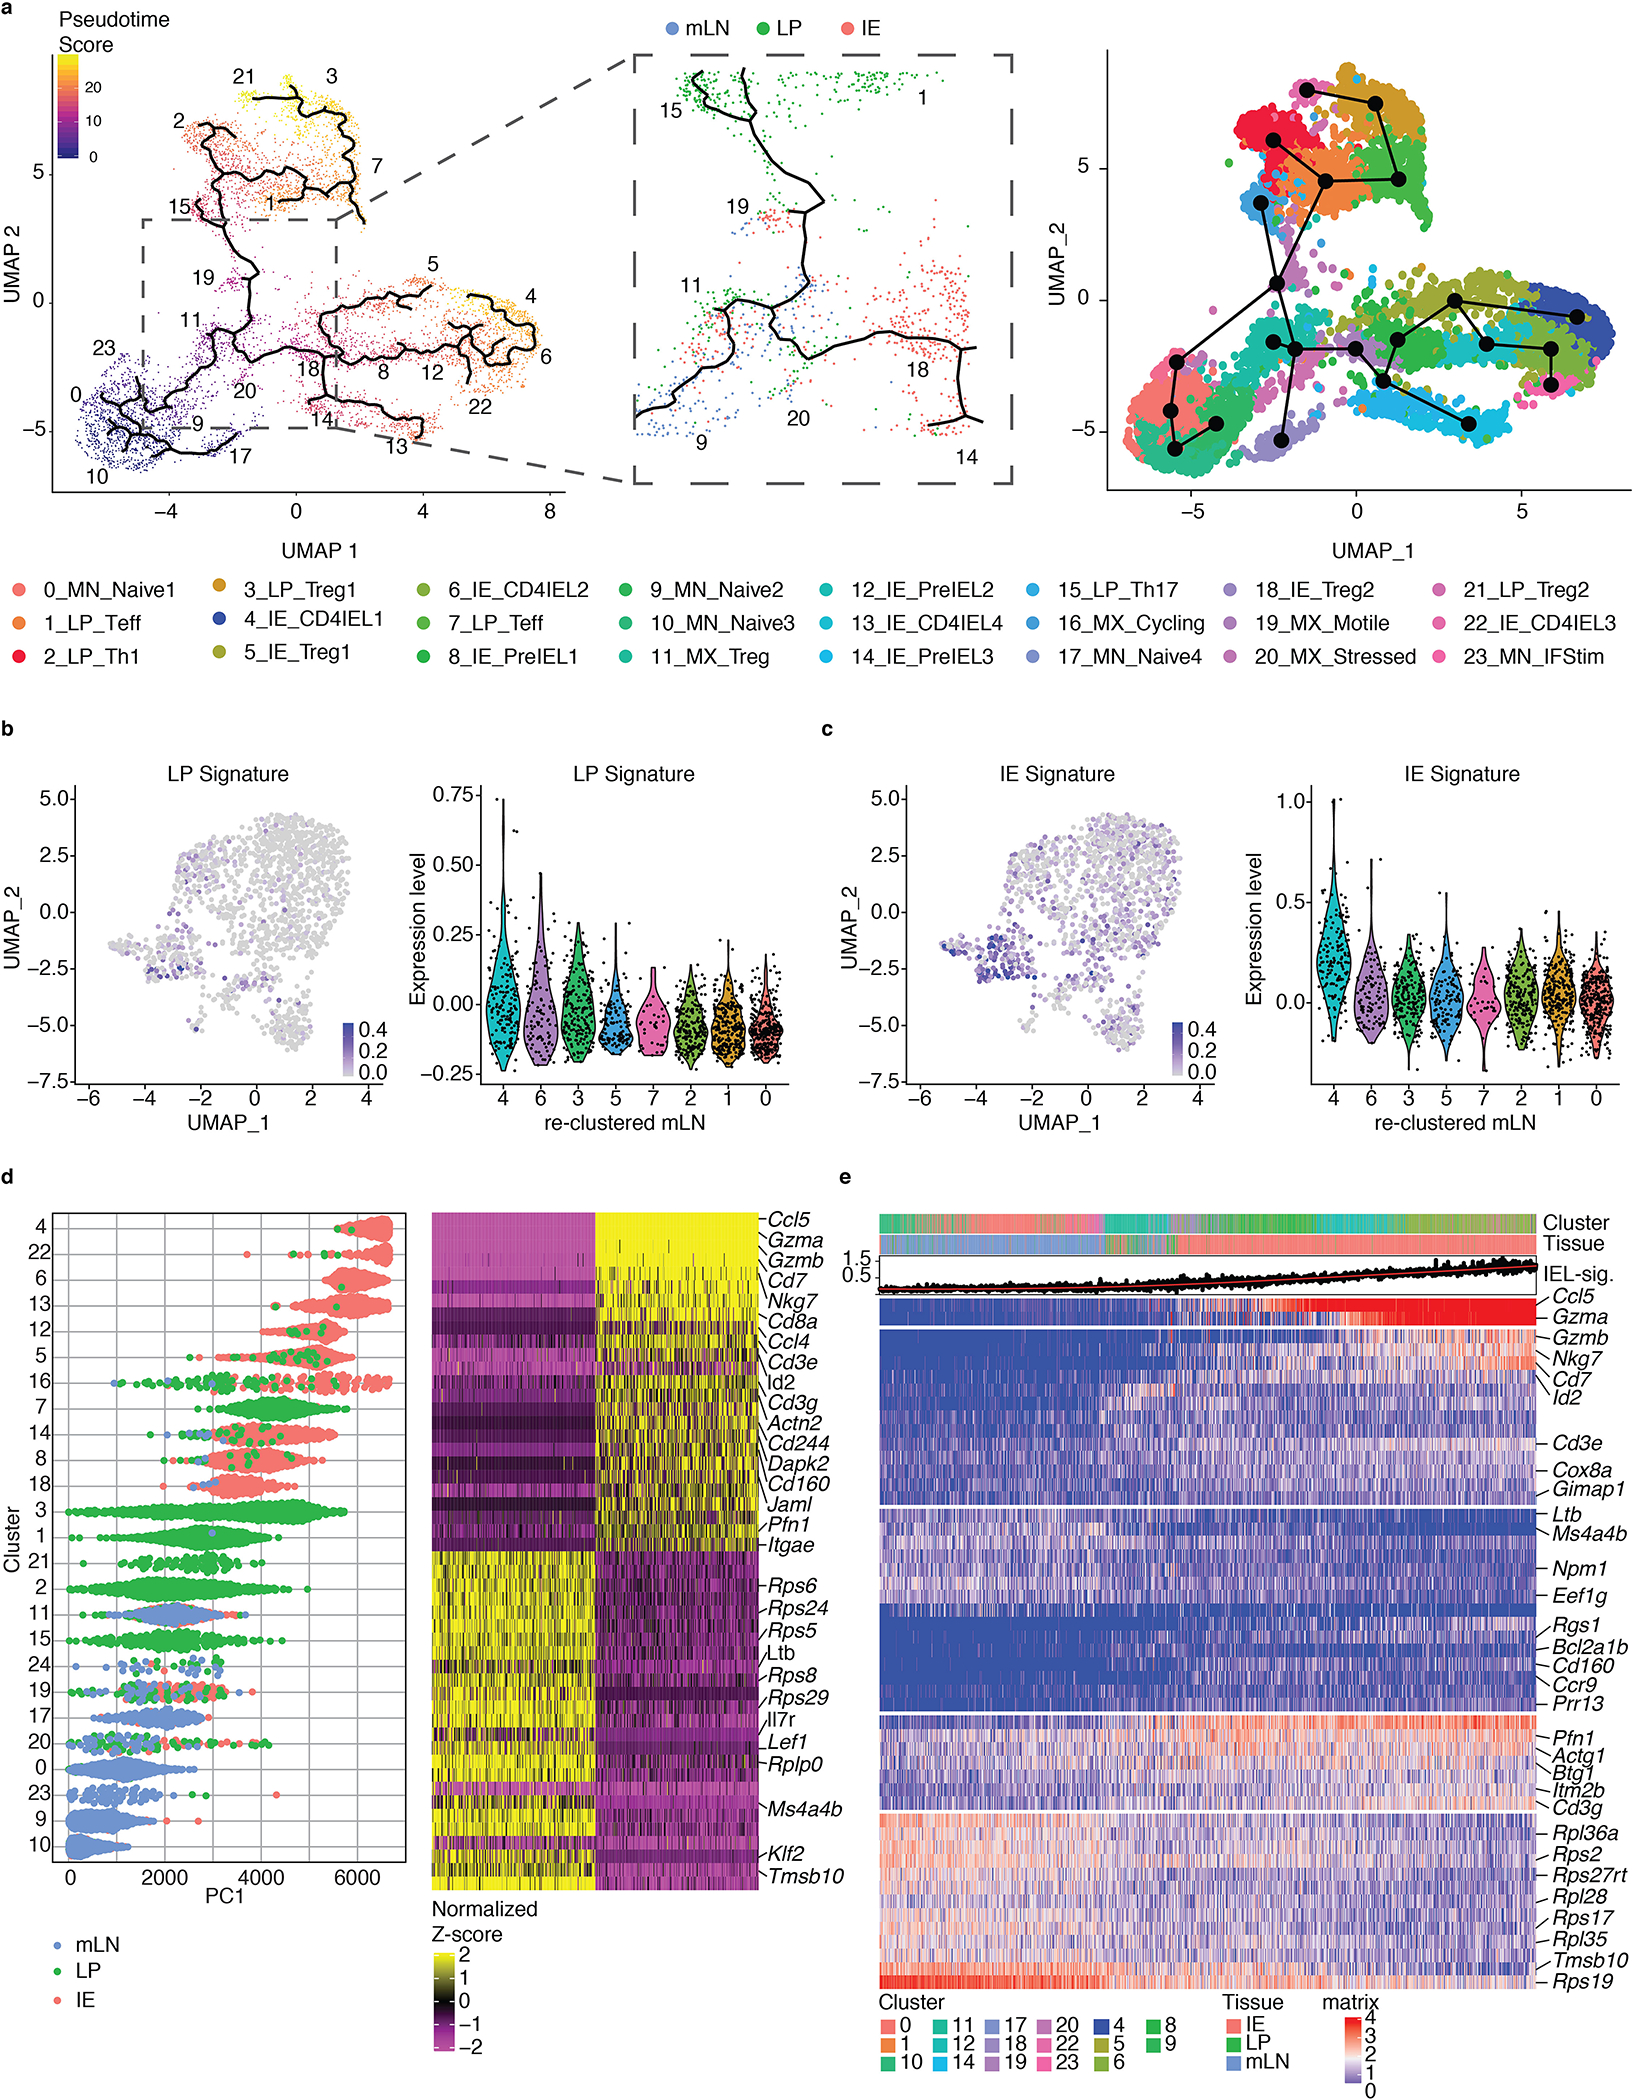
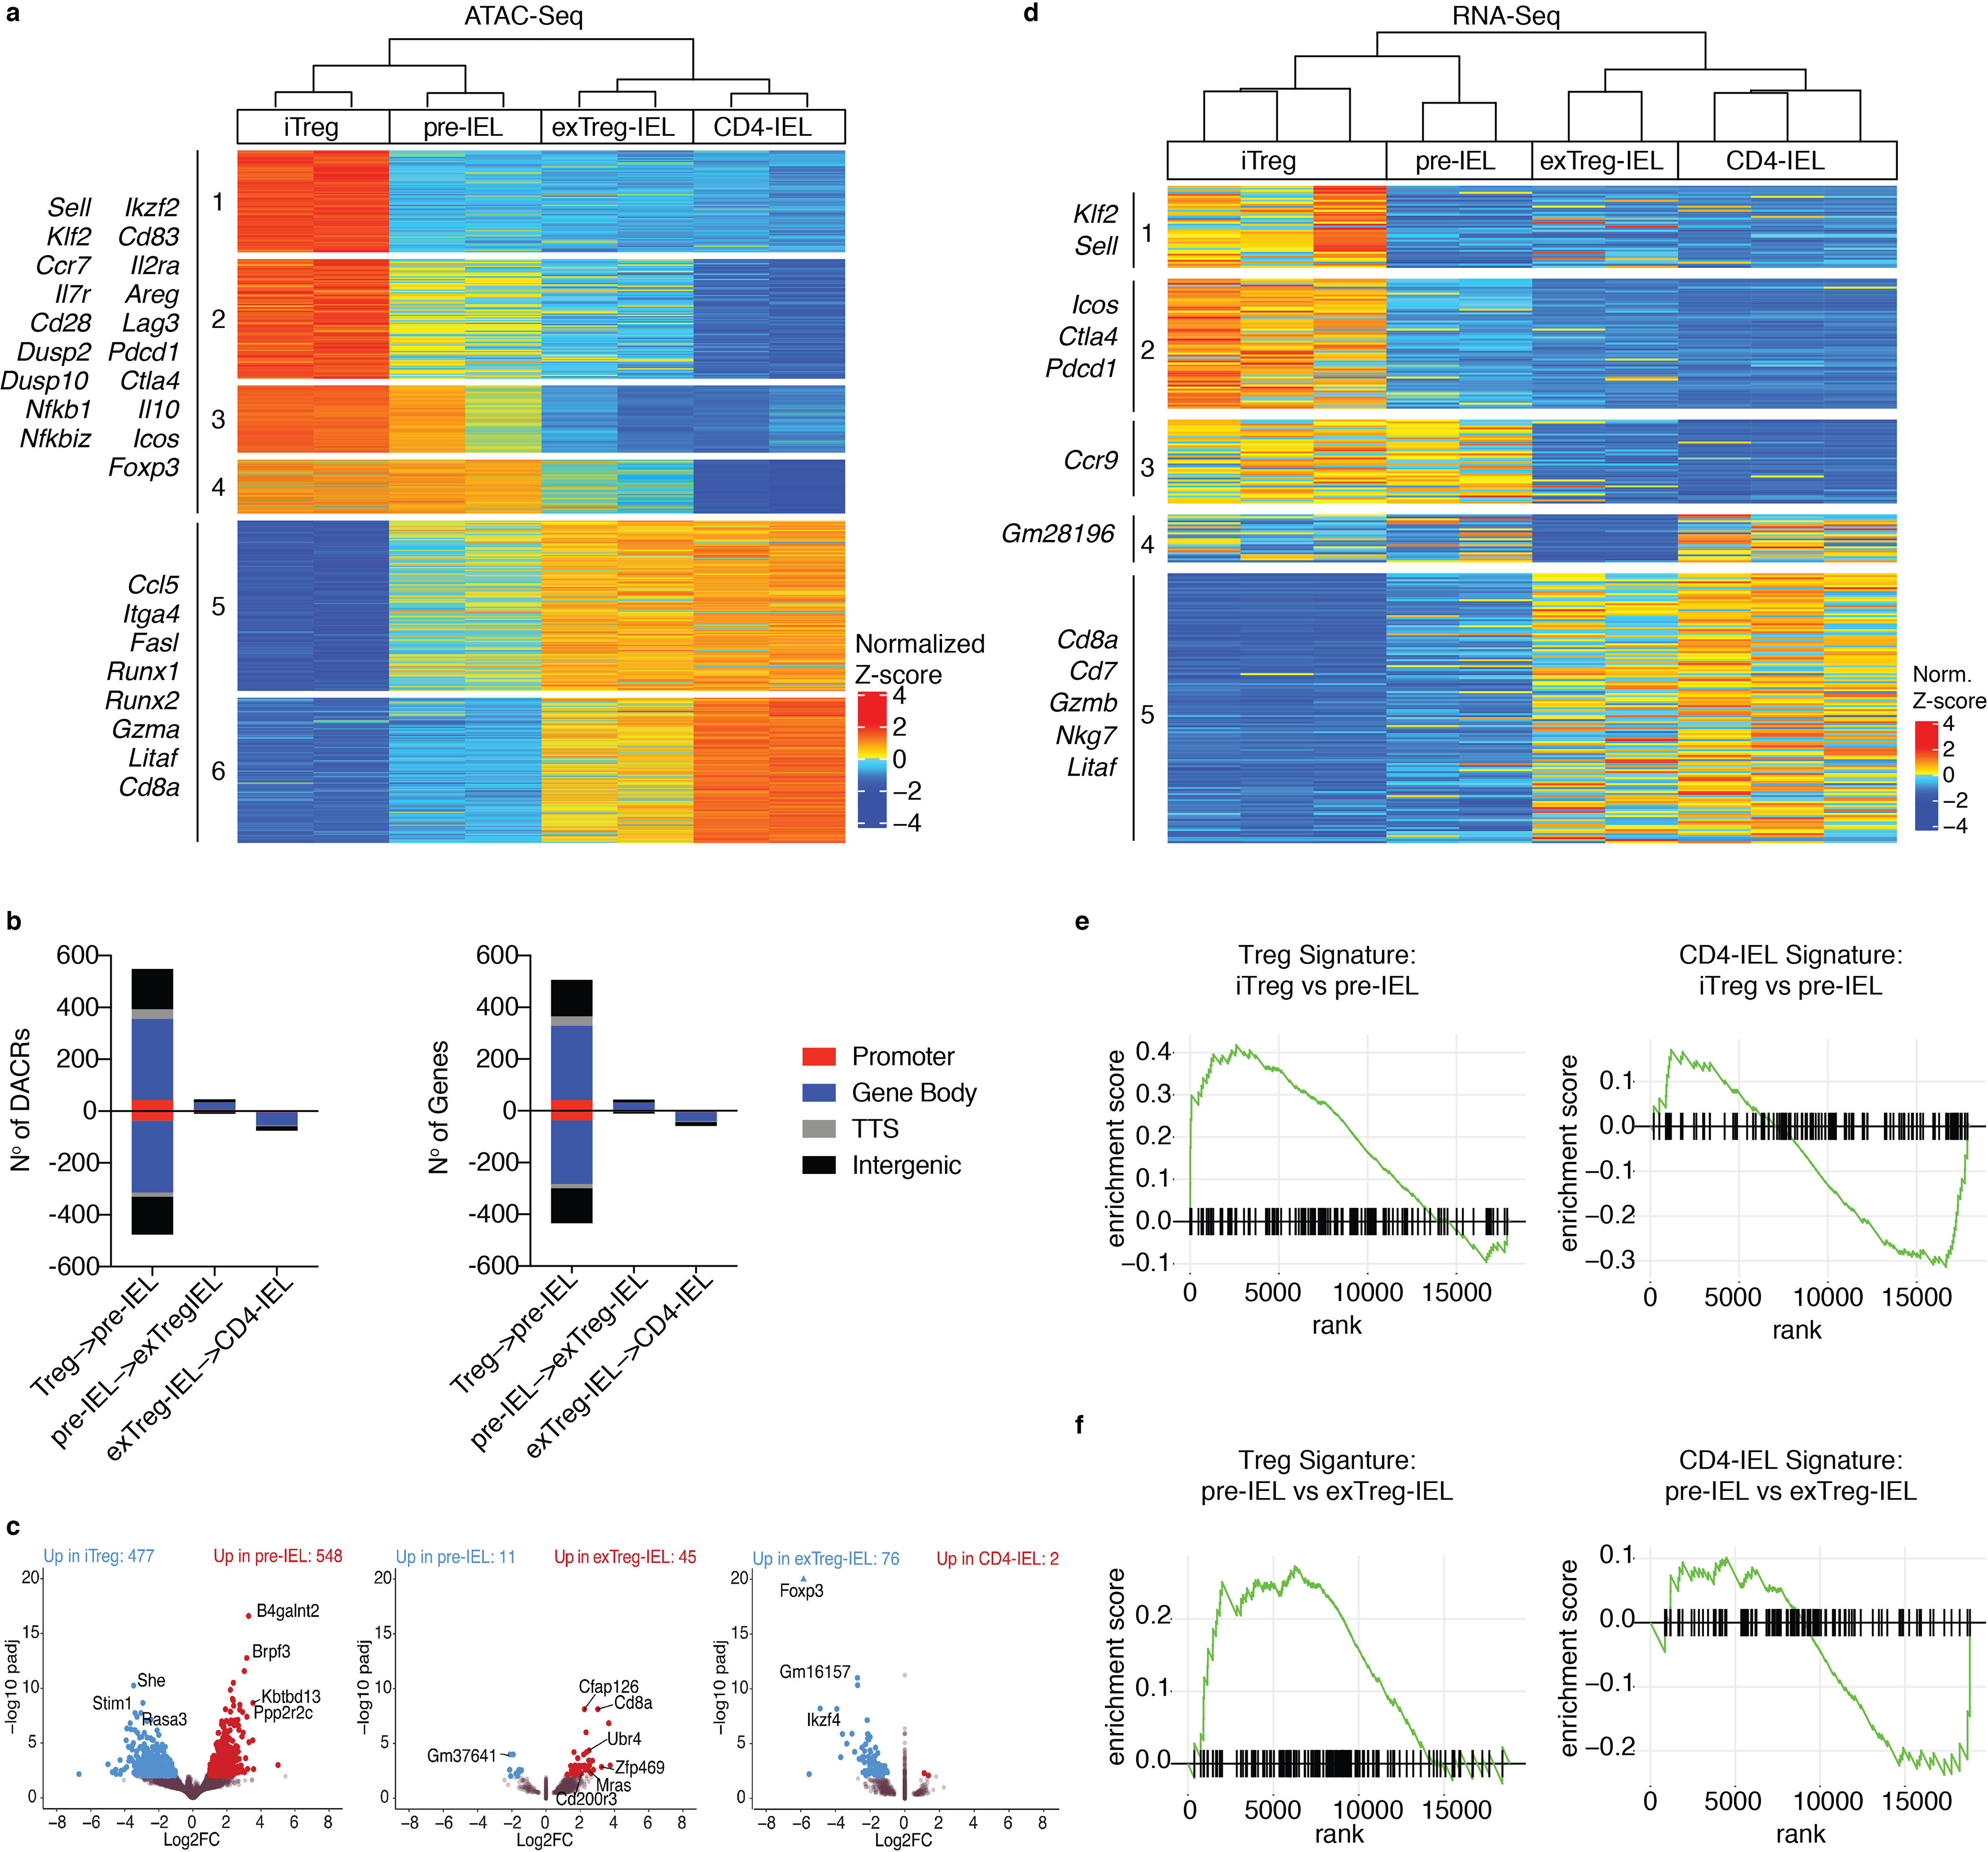
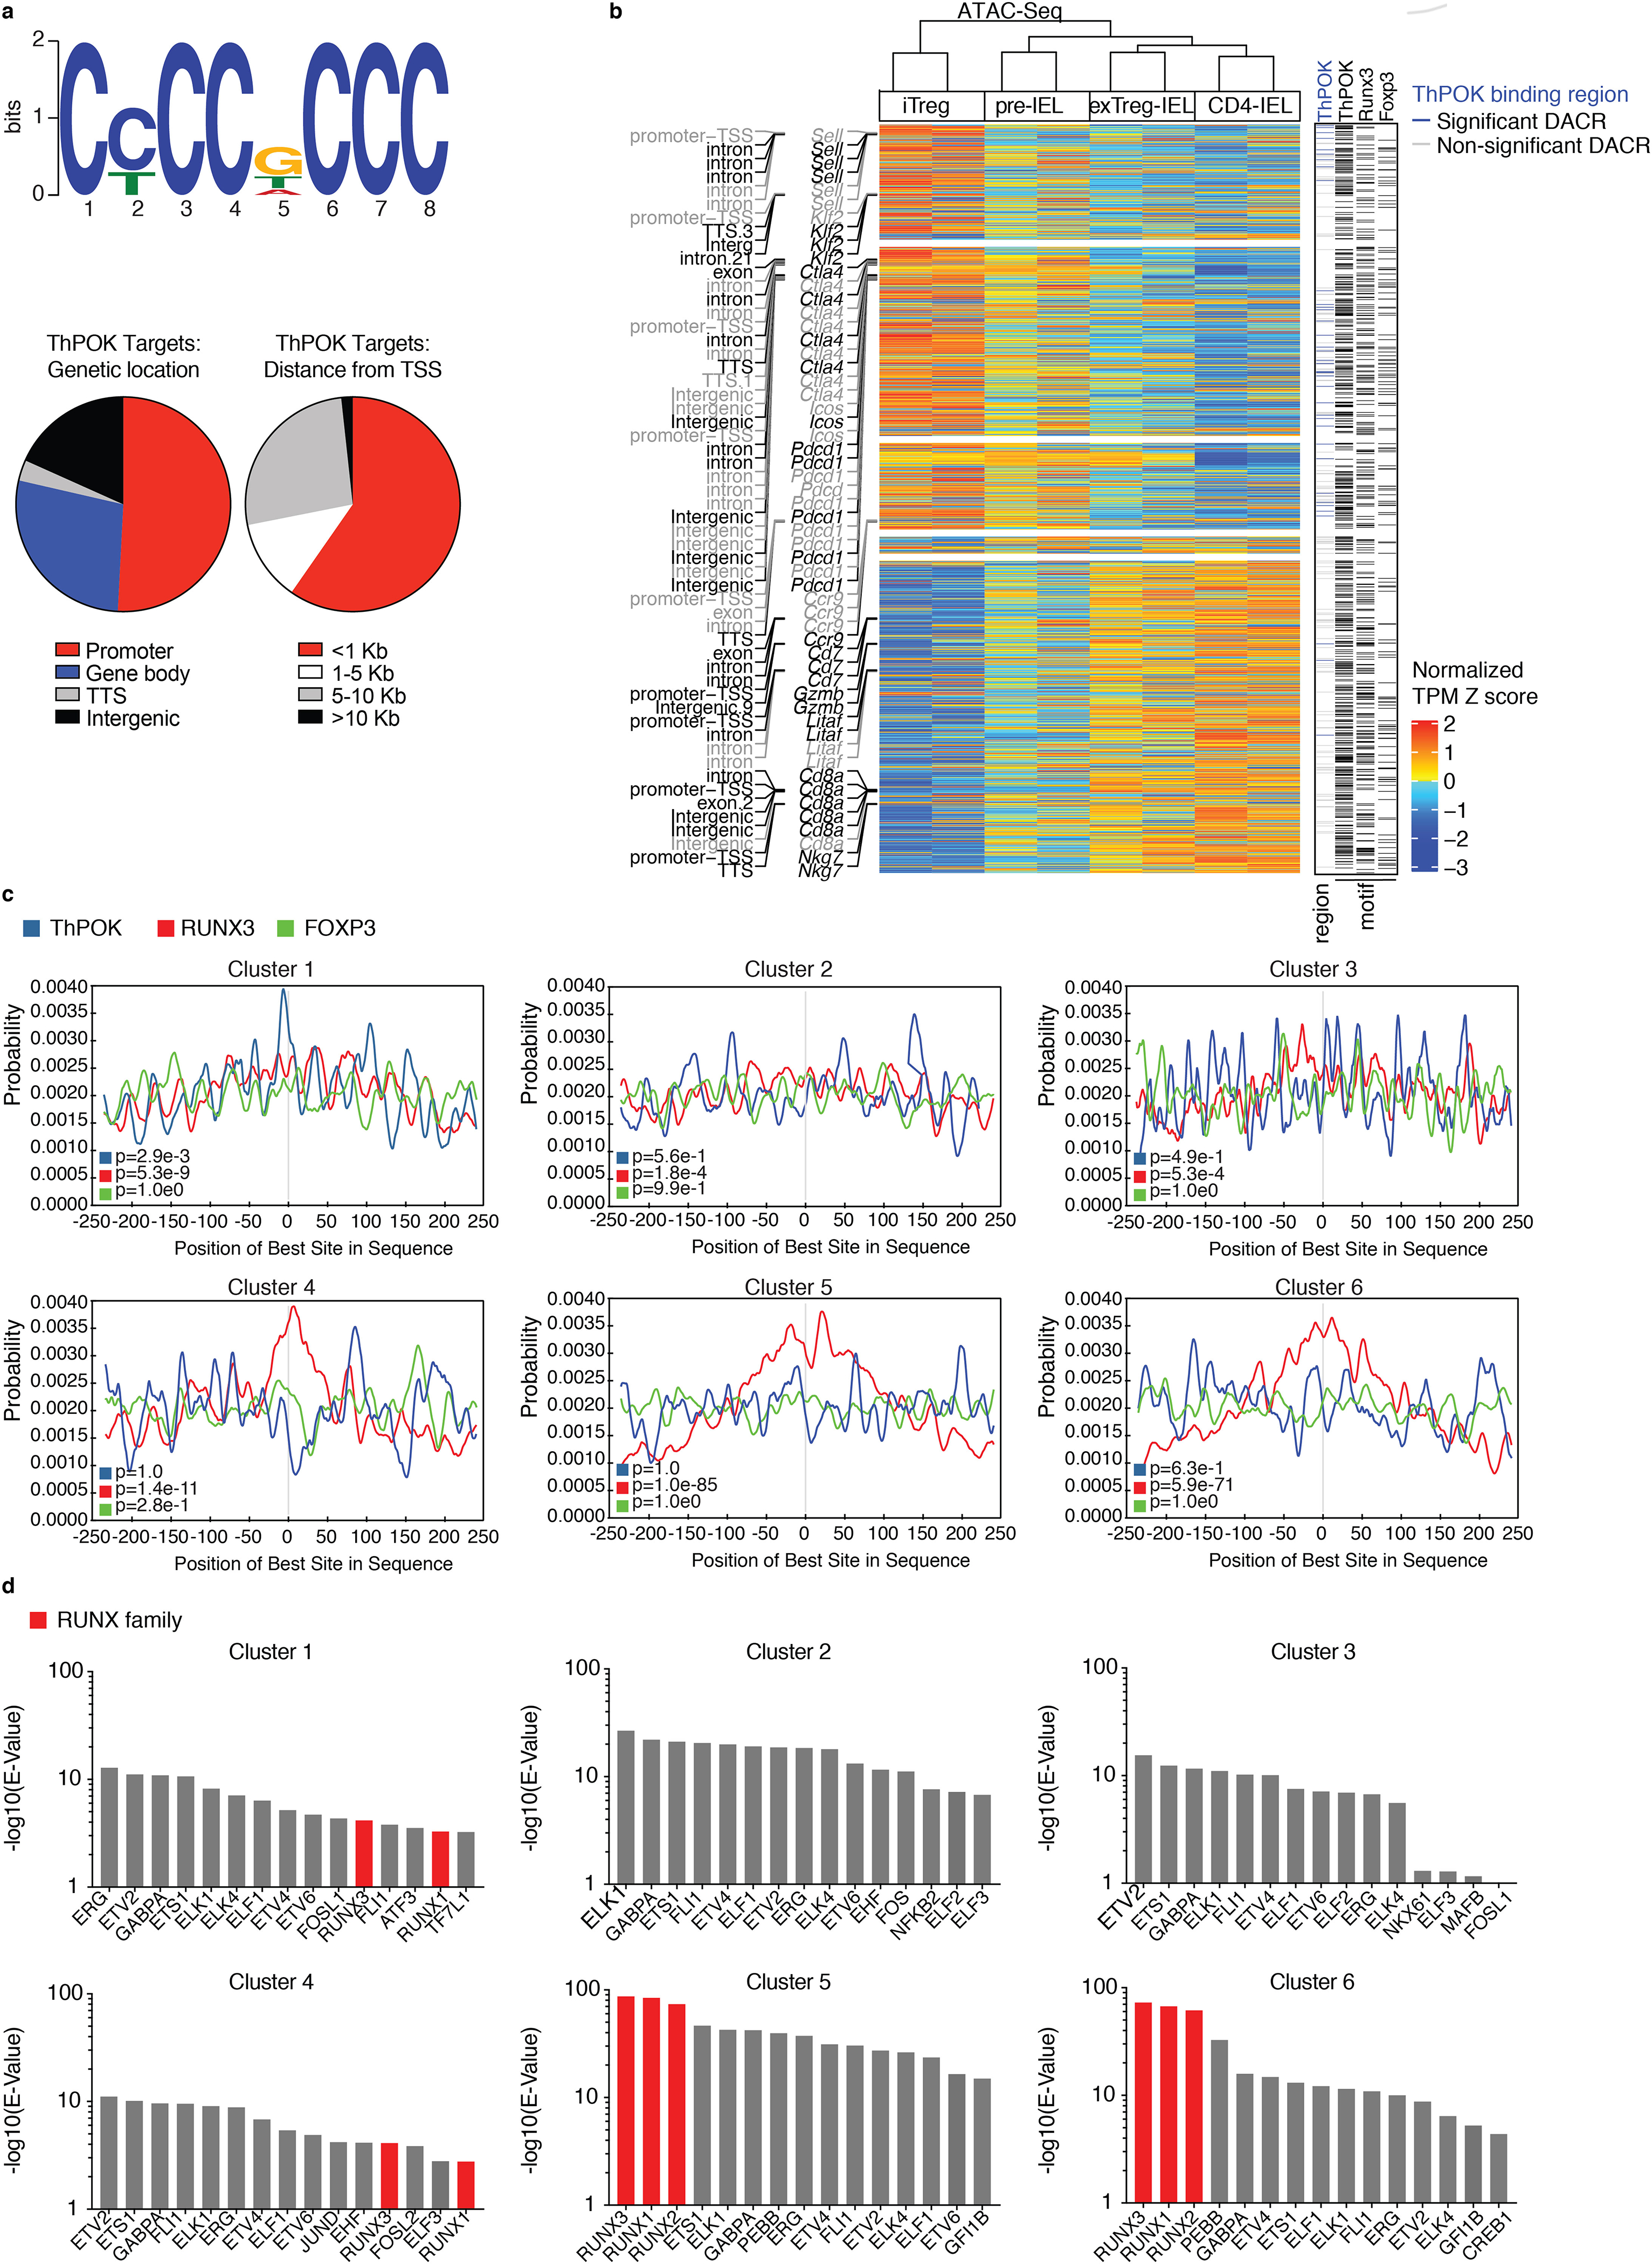
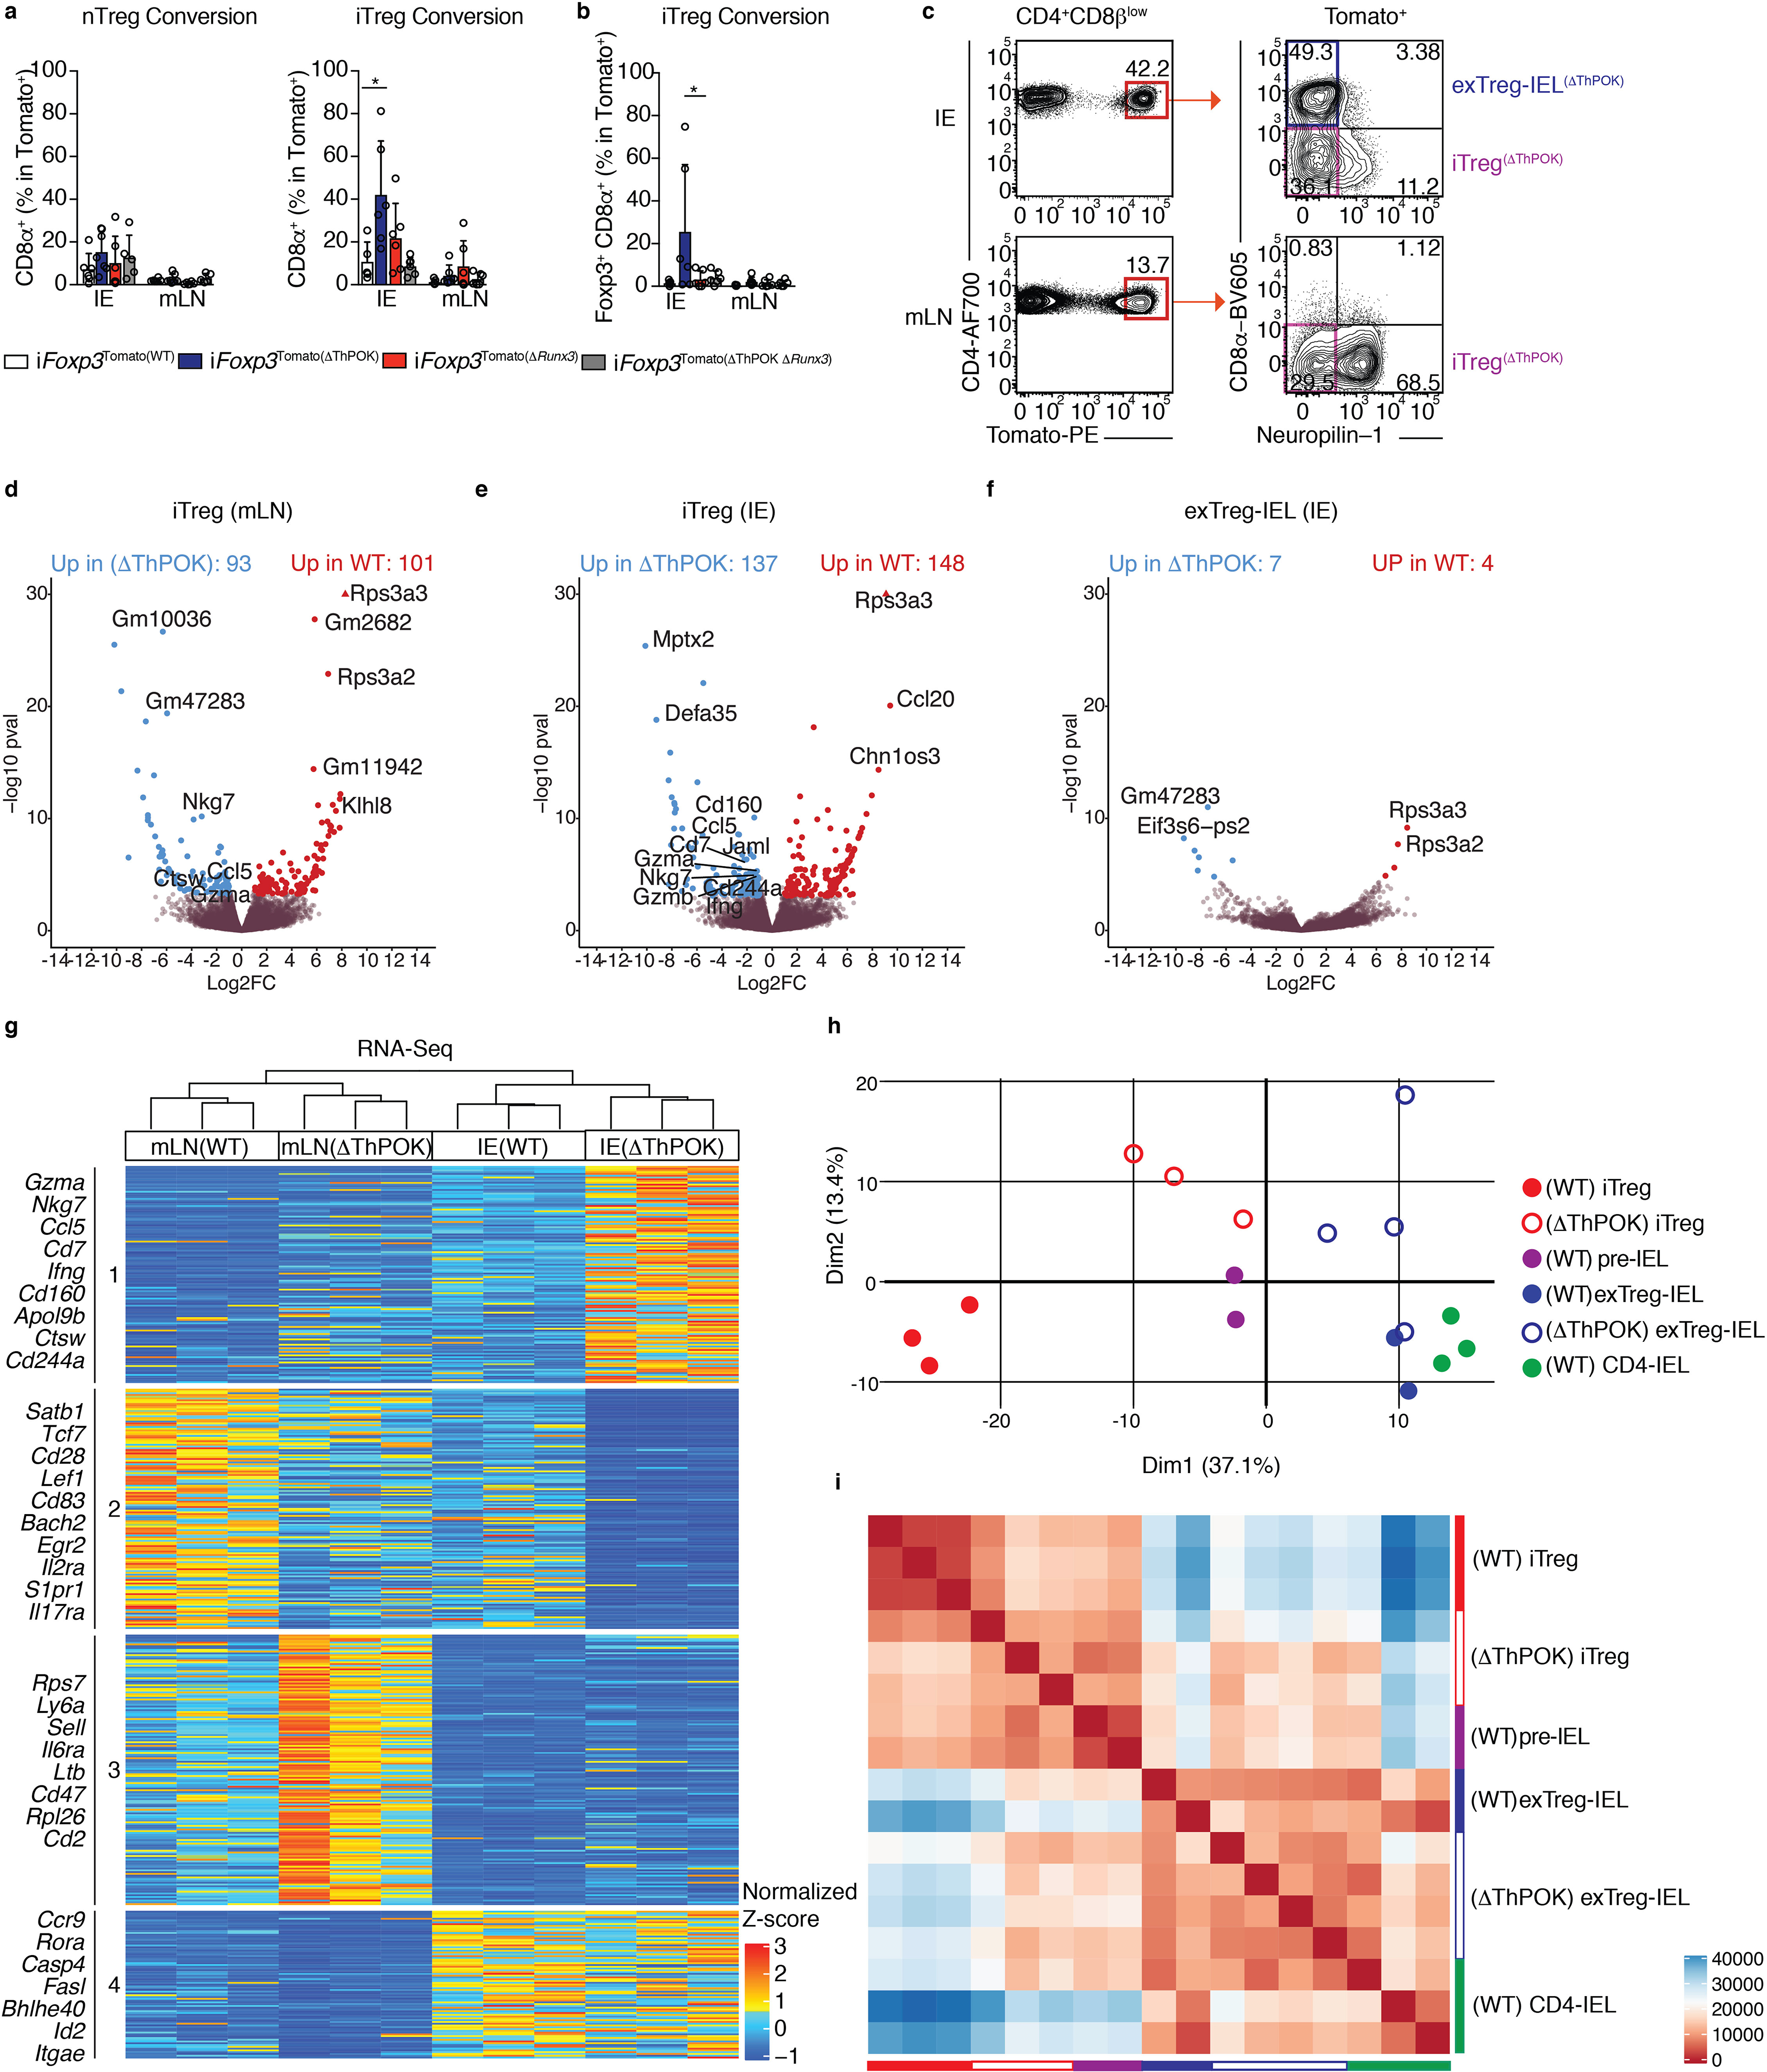
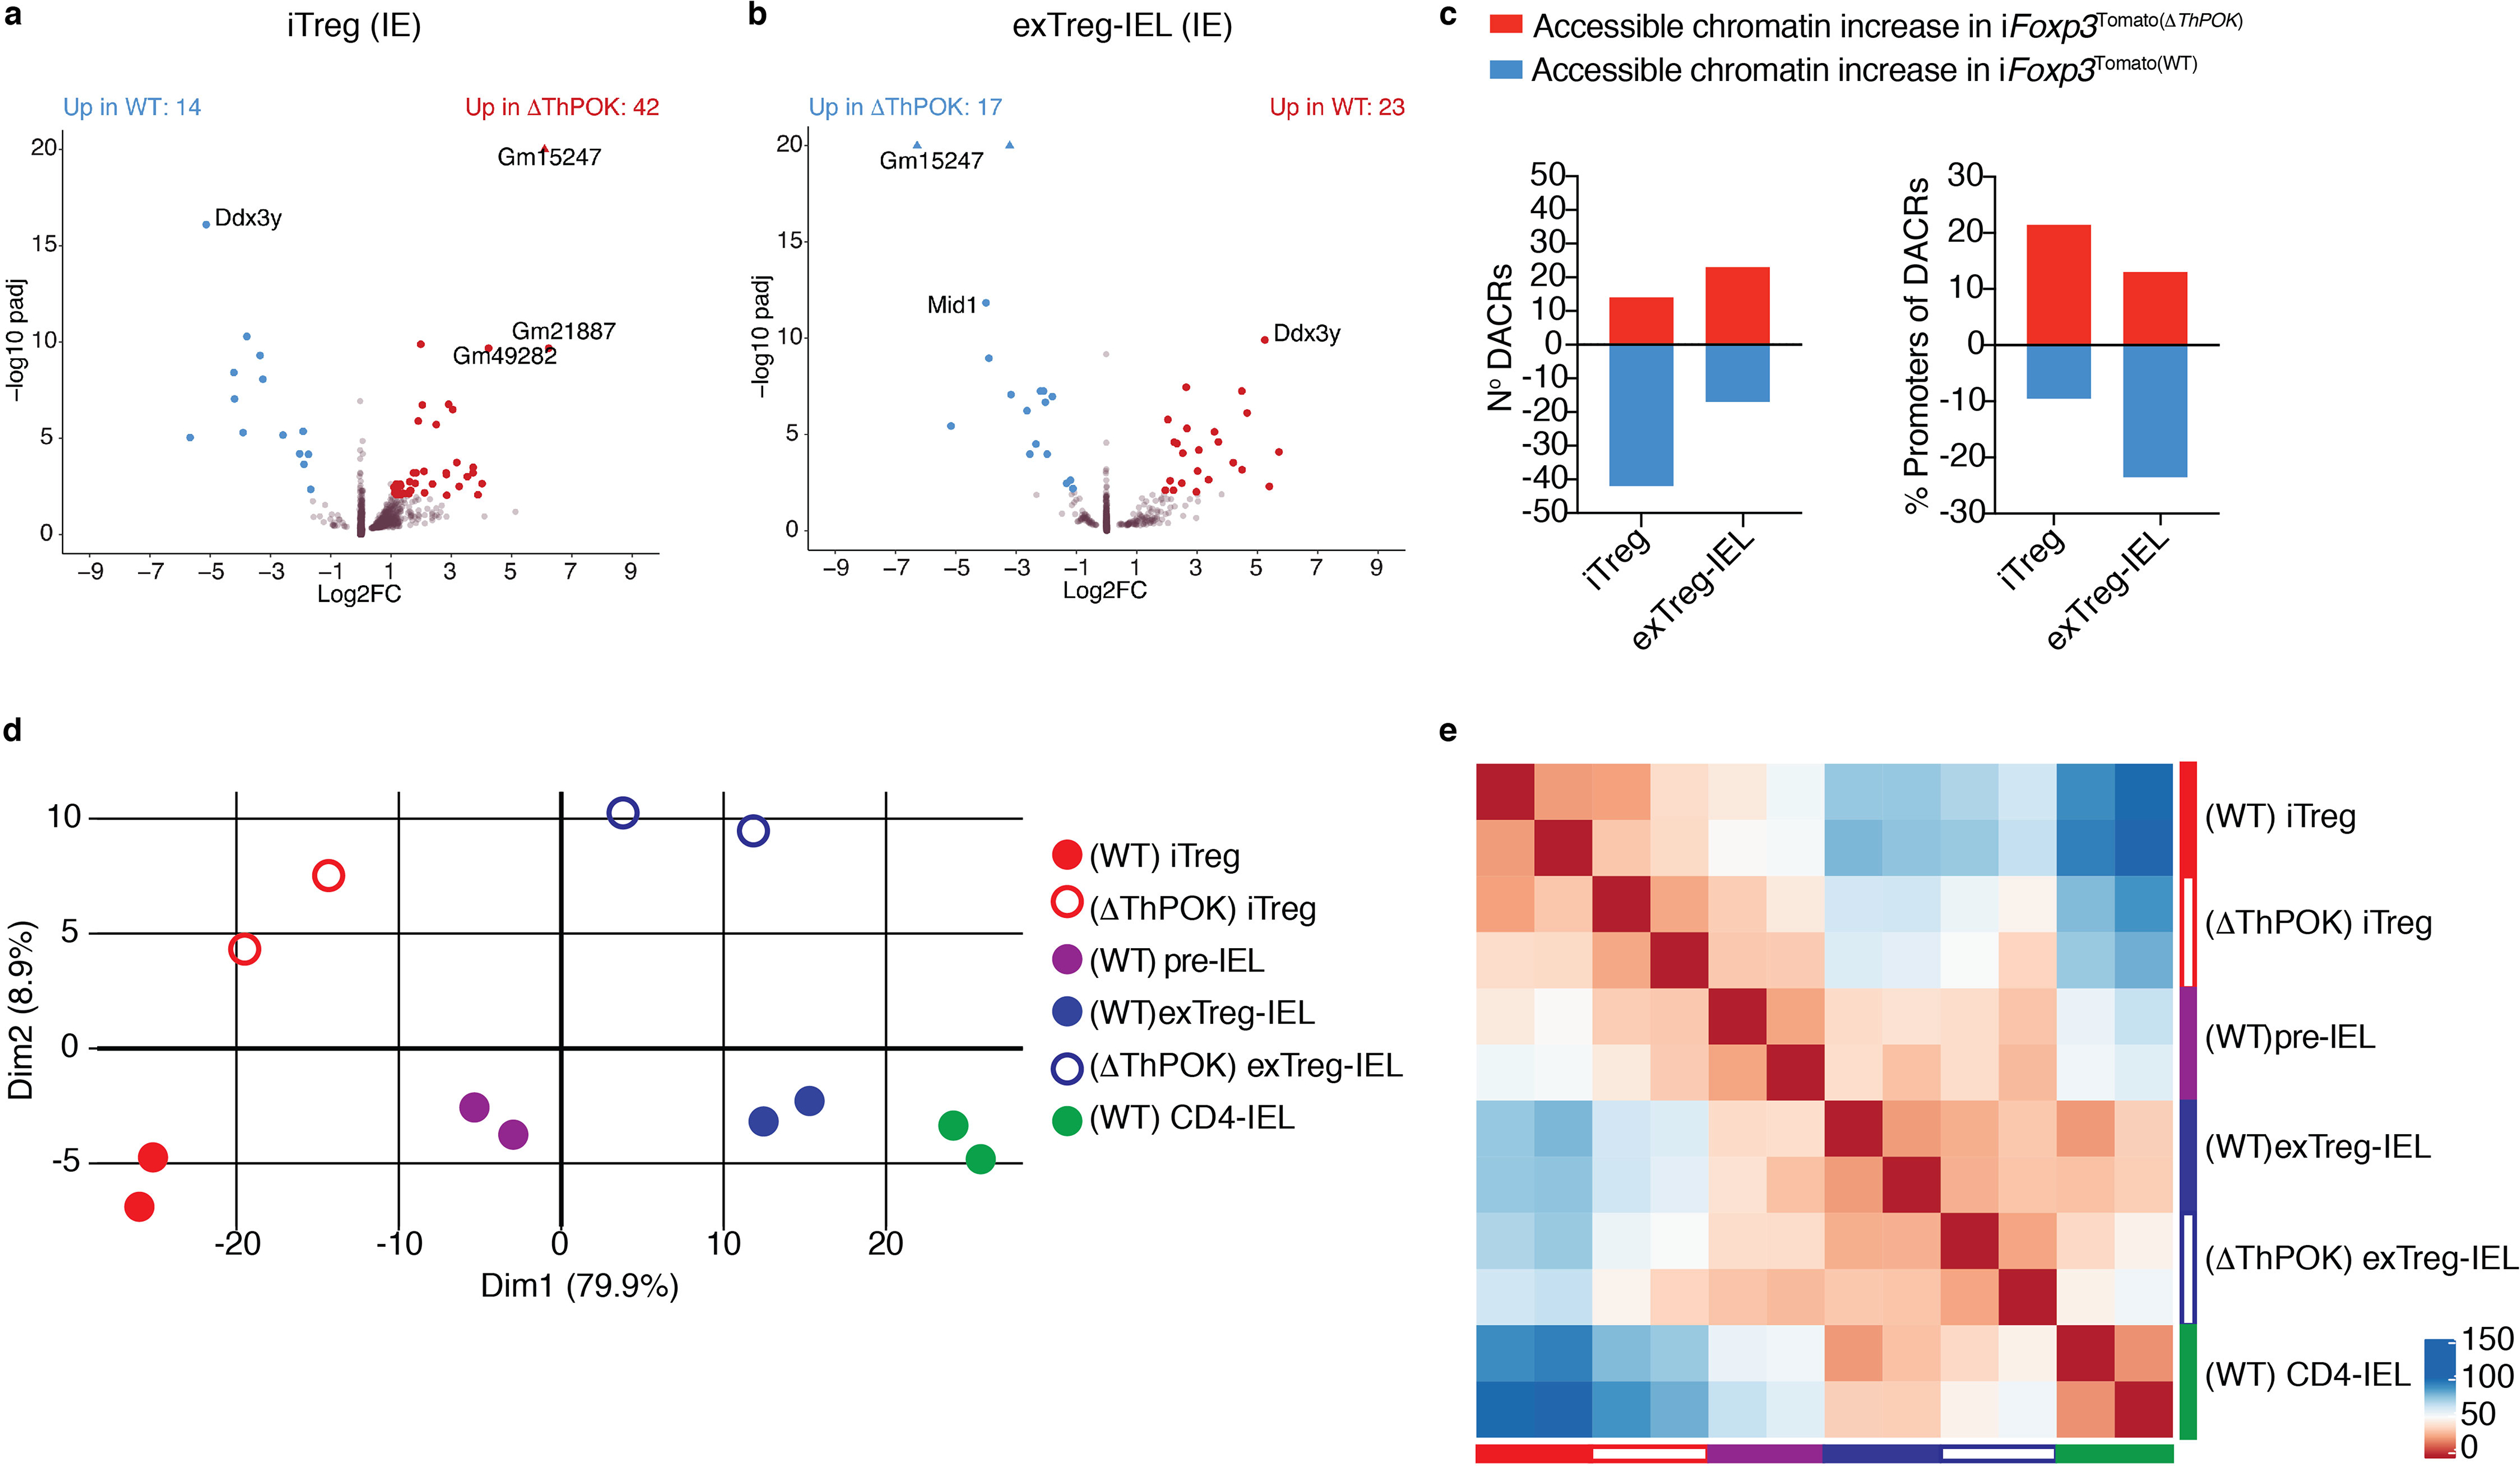
Mesenteric lymph node (mLN) T cells undergo tissue adaptation upon migrating to intestinal lamina propria and epithelium, ensuring appropriate balance between tolerance and resistance. By combining mouse genetics with single-cell and chromatin analyses, we uncovered the molecular imprinting of gut epithelium on T cells. Transcriptionally, conventional and regulatory (Treg) CD4+ T cells from mLN, lamina propria and intestinal epithelium segregate based on the gut layer they occupy; trajectory analysis suggests a stepwise loss of CD4 programming and acquisition of an intraepithelial profile. Treg cell fate mapping coupled with RNA sequencing and assay for transposase-accessible chromatin followed by sequencing revealed that the Treg cell program shuts down before an intraepithelial program becomes fully accessible at the epithelium. Ablation of CD4-lineage-defining transcription factor ThPOK results in premature acquisition of an intraepithelial lymphocyte profile by mLN Treg cells, partially recapitulating epithelium imprinting. Thus, coordinated replacement of the circulating lymphocyte program with site-specific transcriptional and chromatin changes is necessary for tissue imprinting.


Conflict of interest statement

Competing financial interests

The authors declare no conflict of interest.

Figures

Figure 1.
Figure 1.. Intestinal epithelium imprints a cytotoxic program on migrating CD4+ T cells.
(a-g) Foxp3eGFP-Cre-ERT2xRosa26lsl-tdTomatoxZbtb7bGFP(iFoxp3TomThPOKGFP) mice were treated with tamoxifen for 10 weeks, Tomato and Tomato+ CD4+ T cells from mesenteric lymph nodes (mLN), lamina propria (LP) and intestinal epithelium (IE) were sorted for scRNA-Seq using 10X Genomics platform from one mouse. Sorted Tomato and Tomato+ cells were pooled in a 2:1 ratio per tissue, resulting in 3 separate libraries. (a-b) Uniform manifold approximation and projection (UMAP) representation of all sequenced cells (6,668), color coded by cluster and separated by tissue of origin (a) or mixed (b). Cluster names and numbers correspond to colors throughout the figure as indicated. (c) Principle component analysis of cells per tissue, exhibiting top 30 contributing variables variable features. (d) Heatmap of the top differentially expressed genes in Treg clusters represented by the normalized Z-score. (e) Expression levels of Treg and CD4-IEL signatures in sequenced cells (left) and quantified per cluster (right). (f) Expression levels of indicated signatures among IE clusters as indicated. (g) Heatmap of top differentially expressed genes in CD4-IEL clusters by the normalized Z-score. Significant genes were filtered based on adjusted pvalues less than 0.01 and log2fold changes higher than 0.3.
Figure 2.
Figure 2.. Tissue segregation precedes acquisition of an IEL profile.
(a-e) Foxp3eGFP-Cre-ERT2xRosa26lsl-tdTomatoxZbtb7bGFP(iFoxp3TomThPOKGFP) mice were treated with tamoxifen for 10 weeks, Tomato and Tomato+ CD4+ T cells from mesenteric lymph nodes (mLN), lamina propria (LP) and intestinal epithelium (IE) were sorted for scRNA-Seq using 10X Genomics platform. Sorted Tomato and Tomato+ cells were pooled in a 2:1 ratio per tissue, resulting in 3 separate libraries, with 6,668 sequenced cells analyzed. (a) Pseudotime analysis of sequenced cells using Monocle3 with cells color-coded by pseudotime gradient (left) and by Slingshot with cells color-coded by cluster (right). Numbers indicate the UMAP clusters. Middle panel displays a point of bifurcation in the Monocle3 trajectory analysis, cells colored by tissue. Numbers indicate the UMAP clusters. (b, c) Expression levels overlayed on re-clustered mLN-exclusive cells (left) or quantified per cluster (right) of the LP signature (b) and the IE signature (c). (d) Cells ranked according to the first principal component (PC1) and color-coded according to tissue of origin (left) with the top 25 genes contributing to each side of the PC1 axis, and the 250 cells with the most extreme PC1 coordinates (right). (e) Gene expression levels of cells along one trajectory from a naive mLN cluster to a CD4-IEL cluster.
Figure 3:
Figure 3:. Treg program shutdown precedes IEL programming through a pre-IEL stage.
(a-f) Foxp3eGFP-Cre-ERT2xRosa26lsl-tdTomatoxZbtb7bGFP(iFoxp3TomThPOKGFP) mice were treated with tamoxifen for 10 weeks and induced Tregs (iTreg; CD4+ Tomato+ GFPHigh neuropilin-1 CD8α), pre-IELs (CD4+ Tomato+ GFPLow CD8α), exTreg-IELs (CD4+ Tomato+ GFPLow CD8α+), and CD4-IELs (CD4+ Tomato GFPLow CD8α+) were sorted in bulk from the IE. Assay for transposase-accessible chromatin (ATAC) or RNA libraries were prepared followed by sequencing of indicated populations. (a) Heatmap of likelihood ratio test (LRT) of all differentially accessible chromatin regions (DACR) of indicated bulk populations. (b) Number of DACR (left) and the genes on which they are positioned on (right) between cell types in sequential progression as performed by Wald pairwise test. Colored by chromosome region as follows: 5’UTR and promoters (Promoter; red), 3’UTR with exons and introns (Gene Body; blue), transcriptional termination site (TTS; gray) and intergenic (black). (c) Volcano plots representing DACR between cell types in sequential progression as performed by Wald pairwise test. (d) Heatmap of LRT of differentially expressed genes (DEG) between indicated populations. (e, f) Gene set enrichment analysis of Treg and CD4-IEL signatures from scRNA-Seq (cluster 21 and cluster 6, respectively as shown in Figure 1) in iTreg to pre-IEL (e) and pre-IEL to exTreg-IEL (f) progressions. Significant DACR p<0.01 and significant DEG p<0.05 in RNA-Seq. Each sample for ATAC-Seq consisted of 5,000–40,000 cells from 6 or 9 pooled mice, n=2 samples. Each sample for RNA-Seq consisted of 300–800 cells per mouse, n=2–3 mice.
Figure 4:
Figure 4:. Runx binding motifs are increasingly accessible during the iTreg to IEL progression.
(a-d) ThPOK ChIP-Seq analysis of in vivo–expanded splenic Tregs from Foxp3RFP mice coupled with RNA- and ATAC-Seq of iTregs (CD4+ Tomato+ GFPHigh neuropilin-1CD8α), pre-IELs (CD4+ Tomato+ GFPLow CD8α), exTreg-IELs (CD4+ Tomato+ GFPLow CD8α+), and CD4-IELs (CD4+ Tomato GFPLow CD8α+) from the IE of iFoxp3TomThPOKGFP mice after tamoxifen treatment (as in Figure 3). (a) A de novo ThPOK binding motif as determined by MEME-ChIP (top) and frequency of ThPOK targets at indicated regions (bottom left) and at indicated distances from transcriptional start sites (TSS, bottom right). (b) Heatmap showing the levels of chromatin accessibility among differentially expressed genes with selected annotations of chromatin (region and gene of chromatin location, left). Black indicates regions of genes with significant differential chromatin accessibility, gray indicates no significant change in chromatin accessibility. Chromatin regions with ThPOK binding regions among significant (blue) and non-significant (grey) differentially accessible chromatin regions (DACRs) and transcription factor (TF) motifs of ThPOK, Runx3, and Foxp3 marked with black lines (right). (c, d) TF motif analysis per cluster of ATAC-Seq LRT heatmap of Figure 3a, performed by MEME-ChIP. (c) Transcription factor (TF) motif analysis of indicated TFs, collapsed around transcriptional start site. (d) Top 15 TF motifs per cluster, Runx family TF’s indicated in red. Significant differentially accessible regions padj<0.01 in ATAC-Seq and significant differently expressed genes padj<0.05 in RNA-Seq. 20×106 cells were used for ChIP-Seq (10% for input, 90% for ThPOK-binding). E-value=1.6e-142 for the ChIP-Seq ThPOK motif. Foxp3 and Runx3 binding motifs are from the JASPAR database.
Figure 5:
Figure 5:. Abrogation of ThPOK in Tregs anticipates progression to IELs at the transcriptional level.
(a-b) nTreg (neuropilin-1) or iTregs (neuropilin-1+) were sorted from spleens and mLNs of CD45.2 Zbtb7bfl/+xRunx3fl/+xRosa26|s|tdTomatoxFoxp3CreER (iFoxp3), iFoxp3xRunx3fl/+ (iFoxp3ThPOK)), iFoxp3xZbtb7bfl/+xRunx3fl/fl (iFoxp3Runx3)), iFoxp3xZbtb7bfl/flxRunx3fl/fl (iFoxp3ThPOK ΔRunx3)) mice after tamoxifen administration and co-transferred with CD45.1 naïve CD4+ T cells to Rag1−/− hosts. CD45.2+TCRβ+CD4+CD8βTomato+ lymphocytes from the IE and mLN were analyzed 10 weeks after transfer. (a) Frequencies of total surface CD8α+ cells after nTreg (left) or iTreg (right) transfer. (b) Frequency of Foxp3+CD8α+ cells after iTreg transfer. (c-i) Induced Tregs (iTregs; Tomato+CD8αneuropilin-1) and Treg-derived CD4-IELs (exTreg-IELs; Tomato+CD8α+) were sorted from Zbtb7bfl/flxRunx3fl/+xRosa26|s|tdTomato xFoxp3CreER (iFoxp3ThPOK)) mice after 10 weeks of tamoxifen administration followed by RNA-Sequencing from IE or mLN. (c) ΔThPOK T cell populations sequenced. (d-f) Volcano representation of differentially expressed genes (DEG) between WT and ΔThPOK of the same cell type as indicated, performed by Wald pairwise comparison test, padj< 0.05. (g) Heatmap of DEGs between indicated bulk populations. Expression values represents the normalized Z-score of gene abundances (TPM). (h, i) Principle component analysis (h) and corresponding Euclidean distance analysis (i) of DEG of all WT and ΔThPOK cell types from the IE. (n=3–4 iFoxp3ThPOK)). (c-i) Each sample consisted of 300–800 cells per mouse, n=2–4 mice. (a-c) Data are expressed as mean +/− SEM of individual mice (n=5–6 per genotype, 3 separate experiments). *p<0.05, **p<0.01, ***p<0.001 [one-way ANOVA and Bonferonni test].
Figure 6:
Figure 6:. Abrogation of ThPOK in Tregs enhances progression to IELs at the chromatin level.
(a-e) Induced Tregs (iTregs; Tomato+CD8αneuropilin-1) and Treg derived CD4-IELs (exTreg-IELs; Tomato+CD8α+) were sorted from Zbtb7bfl/flxRunx3fl/+xRosa26|s|tdTomato xFoxp3CreER (iFoxp3ThPOK)) mice after 10 weeks of tamoxifen administration followed by ATAC-Sequencing from IE. (a, b) Volcano representation of differentially accessible chromatin regions (DACR) between WT and ΔThPOK of the same cell type as indicated, performed by Wald pairwise comparison test, padj<0.01. (c) Data of accessible chromatin increase (red) and decrease (blue) between WT and ΔThPOK of the same cell type as indicated. Numbers of DACR (left) and percent of DACRs at promoter regions (right). (d-e) Principle component analysis (d) and corresponding Euclidean distance heatmap (e) of DACR of all WT and ΔThPOK cell types from the IE. Each sample consisted of 5,000–40,000 cells from 2 or 3 pooled mice, n=2 samples).

References

    1. Olivares-Villagomez D & Van Kaer L Intestinal Intraepithelial Lymphocytes: Sentinels of the Mucosal Barrier. Trends in immunology 39, 264–275 (2018). - PMC - PubMed
    1. McDonald BD, Jabri B & Bendelac A Diverse developmental pathways of intestinal intraepithelial lymphocytes. Nature reviews. Immunology 18, 514–525 (2018). - PMC - PubMed
    1. Vantourout P & Hayday A Six-of-the-best: unique contributions of gammadelta T cells to immunology. Nature reviews. Immunology 13, 88–100 (2013). - PMC - PubMed
    1. Mucida D et al. Oral tolerance in the absence of naturally occurring Tregs. The Journal of clinical investigation 115, 1923–1933 (2005). - PMC - PubMed
    1. Bilate AM & Lafaille JJ Induced CD4+Foxp3+ regulatory T cells in immune tolerance. Annual review of immunology 30, 733–758 (2012). - PubMed

Publication types

MeSH terms

Substances