. 2021 Apr;24(4):554-564.
doi: 10.1038/s41593-021-00803-x. Epub 2021 Mar 8.

Gene-expression correlates of the oscillatory signatures supporting human episodic memory encoding

Affiliations

Gene-expression correlates of the oscillatory signatures supporting human episodic memory encoding

Stefano Berto et al. Nat Neurosci. 2021 Apr.

Abstract

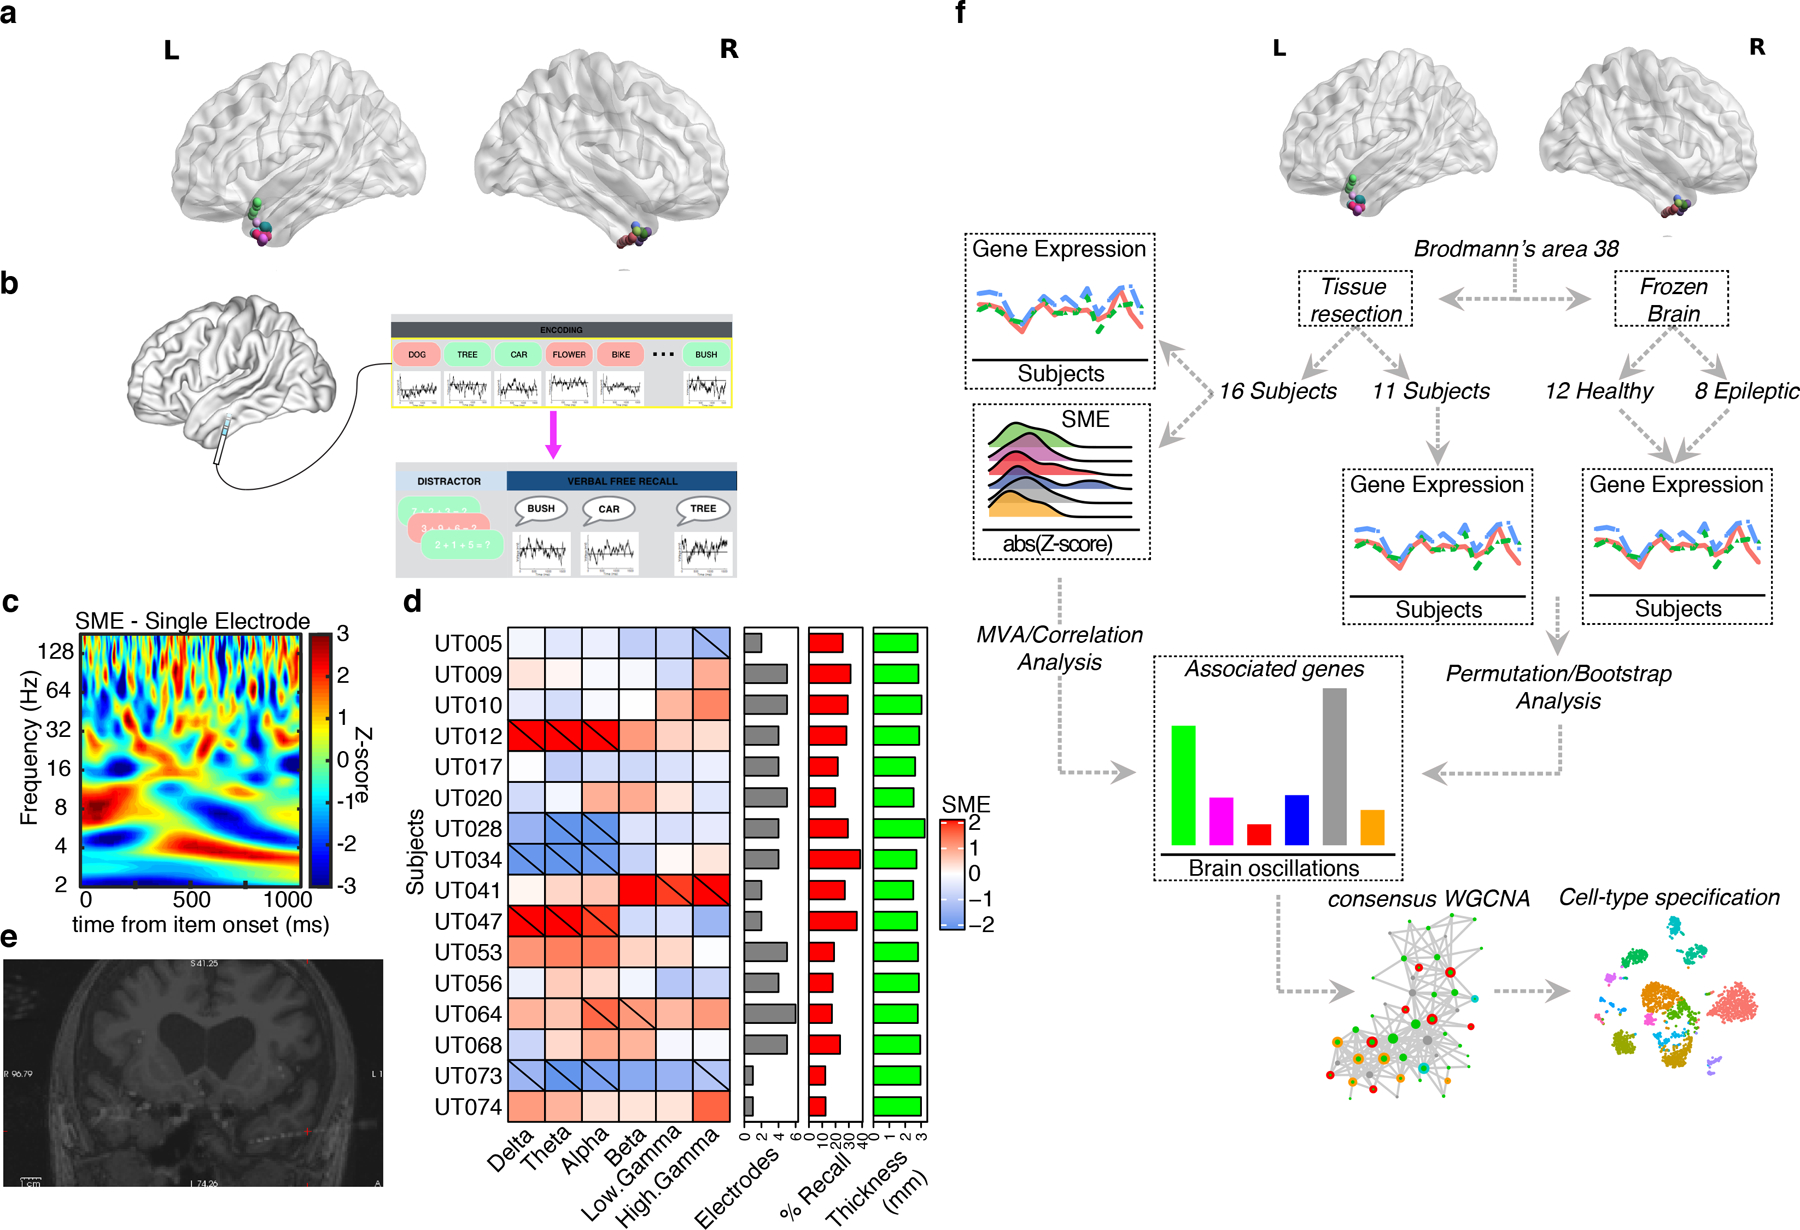
In humans, brain oscillations support critical features of memory formation. However, understanding the molecular mechanisms underlying this activity remains a major challenge. Here, we measured memory-sensitive oscillations using intracranial electroencephalography recordings from the temporal cortex of patients performing an episodic memory task. When these patients subsequently underwent resection, we employed transcriptomics on the temporal cortex to link gene expression with brain oscillations and identified genes correlated with oscillatory signatures of memory formation across six frequency bands. A co-expression analysis isolated oscillatory signature-specific modules associated with neuropsychiatric disorders and ion channel activity, with highly correlated genes exhibiting strong connectivity within these modules. Using single-nucleus transcriptomics, we further revealed that these modules are enriched for specific classes of both excitatory and inhibitory neurons, and immunohistochemistry confirmed expression of highly correlated genes. This unprecedented dataset of patient-specific brain oscillations coupled to genomics unlocks new insights into the genetic mechanisms that support memory encoding.


Conflict of interest statement

Competing interests

The authors declare no competing interests.

Figures

Extended Data Fig. 1
Extended Data Fig. 1. Data quality control
a, Box plots depicting the probability of recall for items presented at each serial position. Primacy and recency effects are visible, consistent with expectations for performance in the free recall episodic memory paradigm. Whiskers on box plots represent maximum and minimum values. Boxes extend from the 25th to the 75th percentiles, the center lines represent the median. Loess regression with confidence intervals is superimposed to depict the overall distribution. Smooth curves are shown with 95% confidence bands b, Lag conditional response probability curves in our data (lag CRP), indicating expected temporal clustering behavior. Loess regression with confidence intervals depicts the overall distribution. Smooth curves are shown with 95% confidence bands. c, Boxplot showing the comparison of within-subject variance (across all measured electrodes at each band, blue box plot,) with the variance across subjects (at each band, yellow box plot). Across subjects variance is significantly greater than within-subject variance. Reported p-value from Wilcoxon rank sum test (one-sided with alternative greater). Boxplots extend from the 25th to the 75th percentiles, the center lines represent the median. d, Scatter plot showing the fraction of all BA38 electrodes exhibiting a significant subsequent memory effect at each frequency. We observed significant differences predicting recall success across the frequency spectrum, including the delta and gamma bands. Loess regression with confidence intervals depicts the overall distribution. Smooth curves are shown with 95% confidence bands. e, Distribution of SME values for each brain oscillation and cross-correlation based on Spearman’s rank correlation. f, Barplots showing the fraction of electrodes at which oscillations were detected in each frequency band in the recalled and non-recalled conditions. 85% of electrodes exhibited an oscillation in at least one of the delta, theta, or alpha frequency bands. g, Scatter plot showing individual electrode examples of power curves used for oscillation detection via the MODAL algorithm, both before and after subtraction of the best fit line. h, Principal component analysis of the subjects used for the within-subject analysis. Variance explained by each principal component is highlighted in the axis. i, Barplot showing the variance explained by each covariate adjusted across 10 principal components (wVE) for the within-subject data. Technical, biological and sequencing covariates calculated by PICARD (see Methods) are included. l, Principal component analysis of all the subjects used in this study. PMep = post-mortem epileptic subjects, UT = within-subjects, PMctl = post-mortem healthy subjects. m, Variance explained by each covariate adjusted across 10 principal components (wVE). Type corresponds to the three different types of data included in the analysis (PMep, UT, PMctl). Technical, biological and sequencing covariates calculated by PICARD (see Methods) are included. n, Association between the first two components and covariates based on adjusted gene expression. X-axis corresponds to the −log10(P-value) from linear regression modeling between PCs and covariates.
Extended Data Fig. 2
Extended Data Fig. 2. SME gene robustness and overlap with other tasks.
a, Boxplot showing the difference between F-statistics of the SME genes (Multivariate analysis) compared with the other genes. Stars correspond to the Wilcoxon’s rank sum test (N, Sign = 753, NotSign = 14439; one-sided with alternative greater; p < 0.0001 = ****; Benjamini-Hochberg adjusted: Delta, FDR = 2.3×10−249, Theta, FDR = 3.2×10−205, Alpha, FDR = 4.1×10−140, Beta, FDR = 2.1×10−159, Low Gamma, FDR = 7.2×10−207, High Gamma, FDR = 1.3×10−63). Boxes extend from the 25th to the 75th percentiles and the center lines represent the median. b, Violin plots showing the rho^2 of the genes significantly associated with each brain oscillation. Standard errors are calculated based on the rho^2 distribution of the significantly correlated genes. Dots represent the median rho^2 for the specific brain oscillation. c, Violin plots showing the rho^2 of the genes significantly associated with each brain oscillation (Obs = observed) compared with rho^2 derived from the permutation control analyses (Perm = Permutation). Standard errors are calculated based on the rho^2 distribution of the significantly correlated genes. Dots represent the median rho^2 for the specific brain oscillation. 100 random permutations were applied to calculate the Perm values (see Methods). Stars correspond to the Wilcoxon’s rank sum test (unadjusted, one-sided with alternative greater; p < 0.0001 = ****).
Extended Data Fig. 3
Extended Data Fig. 3. WGCNA highlights modules associated with memory oscillations.
a, Representative network dendrogram for the consensus WGCNA. Heatmap shows the correlation between memory oscillatory signatures and genes. Red = positively correlated, Blue = negatively correlated. b, Heatmap showing the module association between memory oscillatory signatures and module eigengenes (Spearman’s rank correlation). Warm colors represent positive correlations and cool colors represent negative correlations. P-values for each correlation together with exact correlation values are contained within each box. c, Bubble-chart showing the enrichment for 300 SME genes decomposed by brain oscillation. Gradient color represents the −log10(FDR) and bubble size represents the odds ratio (OR) from a Fisher’s exact enrichment test of each module with disease-relevant gene lists. Y-axis shows the brain oscillations labels. X-axis indicates the modules of the present study. d, Boxplots showing the differential connectivity (e.g. number of edges) between SME genes and non-SME genes in the modules associated with memory oscillatory signatures with SME genes enriched. Stars correspond to the results of a Wilcoxon’s rank sum test (one-side test with alternative greater; p < 0.001 = ****, p < 0.01 = **, p < 0.05 = *; Benjamini-Hochberg adjusted: WM4, FDR = 0.016, WM12, FDR = 0.048, WM21, FDR = 4.5×10⁻⁴). Boxes extend from the 25th to the 75th percentiles and the center lines represent the median.
Extended Data Fig. 4
Extended Data Fig. 4. Memory-related modules are enriched for gene co-expression modules associated with neuropsychiatric disorders.
a, Bubble-chart showing the enrichment for loci associated with human traits used as negative controls. Gradient color represents the −log10(FDR) from linkage disequilibrium gene set analysis performed by MAGMA. Y-axis shows the acronyms for the GWAS data utilized for this analysis (see Methods). b, Bubble-chart showing the enrichment for modules of co-expressed genes dysregulated in ASD, SCZ or BD. Gradient color represents the −log10(FDR) and bubble size represents the odds ratio (OR) from a Fisher’s exact enrichment test. Y-axis shows the acronyms for the modules associated with neuropsychiatric disorders utilized for this analysis (see Methods). X-axis shows the modules of the present study. Modules significantly correlated with memory-related oscillations are highlighted in bold text.
Extended Data Fig. 5
Extended Data Fig. 5. snRNA-seq quality control metrices and module enrichment for cell-types dysregulated in cognitive disorders.
a, Barplot showing the total number of nuclei identified per subject. Colors correspond to the two different batches. b, Quality control boxplots for snRNA-seq with number of genes detected, number of UMIs and percentage of mitochondrial genes. Colors correspond to the two different batches. Boxes extend from the 25th to the 75th percentiles and the center lines represent the median. Dots represent outliers. c, Scatter plot showing the relationship between number of UMIs (X-axis) and detected genes (Y-axis). Each sample is indicated in a different color. d, UMAP plots showing the distribution of nuclei in each subject. Colors correspond to the two different batches. e, Proportion of nuclei representing the identified clusters. Colors correspond to the six different subjects analyzed. f, UMAP plots showing the distribution of the three major cell-classes: GABAergic (blue), Glutamatergic (red), and non-neuronal (green). g, Pie chart showing the proportion of the three major cell-type classes (GABAergic, Glutamatergic, and non-neuronal cells). h, Bubble-chart showing the enrichment of the SME modules for cell-type markers dysregulated in ASD. Color gradient represents the −log10(FDR) and bubble size represent the odds ratio (OR) from a Fisher’s exact enrichment test. Y-axis shows the acronyms for the cell-types defined in the ASD study. i, Bubble-chart showing the enrichment of the SME modules for cell-type markers dysregulated in Alzheimer disease (AD). Color gradient represents the −log10(FDR) and bubble size represent the odds ratio (OR) from a Fisher’s exact enrichment test. Y-axis shows the acronyms for the cell-types defined in the AD study.
Extended Data Fig. 6
Extended Data Fig. 6. snATAC-seq quality control metrices.
a, Barplot showing the total number of nuclei identified per subject. b, Quality control boxplots for each snATAC-seq sample demonstrating the total number of peaks, the number of reads in the peaks and the percentage of reads in peaks. Boxes extend from the 25th to the 75th percentiles and the center lines represent the median. Dots represent outliers. c, Scatter plot showing the relationship between total number of reads (X-axis) and percentage of reads in the peaks (Y-axis). Each sample is indicated in a different color. d, Heatmap of the pairwise similarity between cluster identities. Y-axis shows the snRNA-seq clusters. X-axis shows the snATAC-seq clusters. Gradient corresponds to the percentage of cells for the corresponding prediction label. e, UMAP plots showing the distribution of nuclei in each subject. f, UMAP plots showing the distribution of the three major cell-classes: GABAergic (blue), Glutamatergic (red), and non-neuronal (green). g, Pie chart showing the proportion of the three major cell-type classes.
Fig 1:
Fig 1:. Within-subject study design and quality control.
a, Representation of the position of each electrode in BA38 for the 16 subjects. b, Schematic of iEEG memory testing. Intracranial electrodes are used to record oscillations as subjects perform an episodic memory task. Oscillatory signatures of successful encoding (subsequent memory effects) are calculated by contrasting brain activity recorded as individuals either remembered (green) or forgot (red) each item. c, Example of oscillatory signatures of success encoding (subsequent memory effect) recorded from BA38 (full time frequency representation, color axis is z transformed p value for successful/unsuccessful contrast). d, Subject – level subsequent memory effect (SME) values in our data. Hash marks indicate significant SME (p < 0.05; two-sided student’s t-test with permutation procedure) at the subject level. Warm colors indicate power increases during successful encoding. Gray bar plot indicates the total number of electrodes localized to BA38 for each subject. Red bar plot indicates the recall fraction for each individual, and green bar plot indicates the measured cortical thickness in mm as determined using the FreeSurfer volume extraction routine. e, Postoperative MR/CT overlay after implantation of intracranial electrodes, used for localization. f, Human BA38 RNA-seq from resected tissue was integrated with brain oscillation data derived from subsequent memory effect (SME) analysis, identifying protein-coding genes whose gene expression support SMEs (SME genes). Permutations/bootstraps with additional human BA38 samples from independent sources were performed. SME genes were prioritized using co-expression networks and specified at the cell-type level using snRNA-seq/snATAC-seq from BA38.
Fig. 2:
Fig. 2:. Genes associated with SMEs are distinct.
a, Heatmap showing the F-statistics for the initial SME genes (753 genes; FDR < 0.05). We next use the correlation analysis to decompose the genes by brain oscillations (Spearman’s rank correlation, p < 0.05, permutations/bootstraps p < 0.05). We identified a total of 300 genes using this iterative filtering process that represents brain oscillation/gene expression correlations by wavelength. b, Upset plot indicating shared and specific SME genes between brain oscillations. Most genes are uniquely correlated to a specific wavelength. c, Venn diagram showing shared and specific genes between genes associated with memory effect (SME), genes associated with math task (Math), genes associated with cortical thickness (Thickness), and genes associated with recalled words (Memory Performance). Only one gene overlaps between SME and memory performance.
Fig. 3:
Fig. 3:. Gene co-expression networks highlight cellular processes implicated in memory encoding.
a, Bubble-chart showing the module eigengene association with brain oscillations (Spearman’s |rho| > 0.5, p < 0.05). Six modules have significant correlation. Positive correlations are indicated by red bubbles and negative correlations are indicated by blue bubbles. The size of the bubble corresponds to the strength of the correlation. b, Bubble-chart showing the module eigengene association with MATH associated brain oscillations, Percentage of Recall values, and thickness values (Spearman’s |rho| > 0.5, p < 0.05). Only two modules are significantly associated with MATH and no modules are significantly associated with memory performance or cortical thickness. c, Bubble-chart showing the enrichment for previously identified SME genes from a population-based study. Gradient color represents the −log10(FDR). Boldface type indicates the six modules significantly associated with brain oscillations as indicated in panel a. d, Representation of the top 10 hub genes for the six modules significantly associated with SME signals. SME genes significantly associated with brain oscillations are highlighted in red. Edges represent co-expression (rho^2 > 0.25). Scatterplots represent the top 3 molecular functions of each module as assessed by gene ontology analyses. Y-axis = Odds Ratio, X-axis = −log10(FDR).
Fig. 4:
Fig. 4:. SME-specific modules capture genes dysregulated in neuropsychiatric disorders.
a, Bubble-chart showing the enrichment for genes dysregulated in multiple disorders. Up/Down are genes that are up or down regulated in these disorders compared with healthy individuals. Gradient color represents the −log10(FDR) and bubble size represents the odds ratio (OR) from a Fisher’s exact enrichment test of each module with disease-relevant gene lists. Y-axis shows the acronyms for the disorders (ASD = autism spectrum disorder, BD = bipolar disorder, and SCZ = schizophrenia). X-axis indicates the modules of the present study. b, Bubble-chart showing the enrichment for risk-loci and loci associated with neuropsychiatric disorders and complex traits (see Methods for description of acronyms). Gradient color represents the −log10(FDR) from linkage disequilibrium gene set analysis performed by MAGMA. Blue border corresponds to the Bonferroni correction threshold (Bonferroni p < 0.05). Y-axis shows the acronyms for the GWAS data utilized for this analysis. X-axis shows the modules of the present study. c, Bubble-chart showing the enrichment for genes associated with ASD in the SFARI database. Gradient color represents the −log10(FDR) and bubble size represents the odds ratio (OR) from a Fisher’s exact enrichment test. Y-axis shows the acronyms for the complete SFARI database (ASD) and highly scored ASD genes (categories 1–3). X-axis shows the modules of the present study.
Fig. 5:
Fig. 5:. SME-specific modules are enriched for excitatory and inhibitory neurons.
a, Uniform manifold approximation and projection (UMAP) representation of the 20 classes of cell-types using the BA38 snRNA-seq. Each dot represents a nucleus. Excitatory neurons are highlighted in blue gradient, the inhibitory neurons in red gradient, and the non-neuronal cells in light blue gradient. Cell-types were annotated using a publicly available single cell data. A Fisher’s exact enrichment test between cell markers of the two datasets was performed. Major cell types tend to cluster near one another. b, Violin-plots representing gene markers for the major cell-types detected. Y-axis represents the log normalized expression (log(Norm Exp)) of each marker gene in each cluster. The markers for excitatory neurons (e.g. CUX, RORB) are highlighted in blue. The markers for inhibitory neurons (e.g. GAD1, RELN) are highlighted in red. The markers for non-neuronal cells (e.g. FGFR3, MOBP, VCAN) are highlighted in green. c, Bubble-chart showing the enrichment of the SME modules for cell-type markers defined by Seurat. Color gradient represents the −log10(FDR) and bubble size represent the odds ratio (OR) from a Fisher’s exact enrichment test of genes in modules from this study with genes expressed in specific cell types defined by our snRNA-seq data. X-axis represents the SME-specific modules. Y-axis represents the cell classes of the present study. Boldface type indicates the six modules significantly associated with memory-related brain oscillations. d, Violin plot representing the log normalized expression (log(Norm Exp)) level of IL1RAPL2. Adjacent dot plot represents the average expression (gradient) and percentage of cells (size) expressing IL1RAPL2. The order of cell types follows the labels of panel c. e,f, Immunohistochemistry of independent human temporal lobe specimens demonstrates the specific expression of IL1RAPL2 in excitatory (CAMKII-α+) and inhibitory neurons (GAD67+) in BA38 (e), not in oligodendrocytes (OLIG2+) or astrocytes (GFAP+) (f).
Fig. 6:
Fig. 6:. snATAC-seq highlights transcription factors regulating SME-correlated modules.
a, Visualization of the 14 classes of cell-types identified from BA38 snATAC-seq data. Nuclei are displayed based on UMAP. Each dot represents a nucleus. Cell classes were annotated using the BA38 snRNA-seq data generated in this study. Excitatory neurons are highlighted in a gradient of blue colors, the inhibitory neurons in a gradient of red colors, and the non-neuronal cells in a gradient of turquoise colors. b, Transcription factor (TF) binding site enrichment for the three modules associated with cell-types (WM4, WM12, and WM21). Only WM12 tends to have enrichment of TF binding motifs (dots to the right of the dashed line). SMAD3 is shown as a top TF whose motif is enriched in WM12 module. Y-axis represents the −log2(FC) of the motif enrichment reported by FindMotifs in Seurat. X-axis represents the −log10(FDR) of the motif enrichment reported by FindMotifs in Seurat. Dashed line corresponds to FDR = 0.05. c, Genome visualization tracks of snATAC-seq open chromatin regions representing SMAD3 binding sites in the promoter of the WM12 hub gene SHANK2. The red ridge plot represents the snATAC-seq data. The SMAD3 binding sites are indicated in blue. d, Violin plot representing the log normalized expression (log(Norm Exp)) level (Y-axis) of SMAD3 for each cell-type defined by snRNA-seq. Adjacent dot plot represents the average expression (gradient) and percentage of cells (size) expressing SMAD3. e,f, Immunohistochemistry of independent human temporal lobe specimens demonstrates the specific expression of SMAD3 in excitatory (CAMKII-α+; e) but not in inhibitory (GAD67+; e) neurons, oligodendrocytes (OLIG2+; f), nor astrocytes (GFAP+; f) in BA38.

Comment in

References

    1. Morgan SE et al. Cortical patterning of abnormal morphometric similarity in psychosis is associated with brain expression of schizophrenia-related genes. Proc Natl Acad Sci U S A 116, 9604–9609, doi:10.1073/pnas.1820754116 (2019). - DOI - PMC - PubMed
    1. Lombardo MV et al. Large-scale associations between the leukocyte transcriptome and BOLD responses to speech differ in autism early language outcome subtypes. Nat Neurosci 21, 1680–1688, doi:10.1038/s41593-018-0281-3 (2018). - DOI - PMC - PubMed
    1. Romero-Garcia R, Warrier V, Bullmore ET, Baron-Cohen S & Bethlehem RAI Synaptic and transcriptionally downregulated genes are associated with cortical thickness differences in autism. Mol Psychiatry 24, 1053–1064, doi:10.1038/s41380-018-0023-7 (2019). - DOI - PMC - PubMed
    1. Wang GZ et al. Correspondence between Resting-State Activity and Brain Gene Expression. Neuron 88, 659–666, doi:10.1016/j.neuron.2015.10.022 (2015). - DOI - PMC - PubMed
    1. Patania A et al. Topological gene expression networks recapitulate brain anatomy and function. Netw Neurosci 3, 744–762, doi:10.1162/netn_a_00094 (2019). - DOI - PMC - PubMed

Methods-only References

    1. Natu VS et al. Stimulation of the Posterior Cingulate Cortex Impairs Episodic Memory Encoding. J Neurosci 39, 7173–7182, doi:10.1523/JNEUROSCI.0698-19.2019 (2019). - DOI - PMC - PubMed
    1. Sederberg PB, Kahana MJ, Howard MW, Donner EJ & Madsen JR Theta and gamma oscillations during encoding predict subsequent recall. J Neurosci 23, 10809–10814 (2003). - PMC - PubMed
    1. Goyal A et al. Functionally distinct high and low theta oscillations in the human hippocampus. Nat Commun 11, 2469, doi:10.1038/s41467-020-15670-6 (2020). - DOI - PMC - PubMed
    1. Watrous AJ, Miller J, Qasim SE, Fried I & Jacobs J Phase-tuned neuronal firing encodes human contextual representations for navigational goals. Elife 7, doi:10.7554/eLife.32554 (2018). - DOI - PMC - PubMed
    1. Fischl B et al. Whole brain segmentation: automated labeling of neuroanatomical structures in the human brain. Neuron 33, 341–355, doi:10.1016/s0896-6273(02)00569-x (2002). - DOI - PubMed

Publication types