. 2021 Apr;18(4):397-405.
doi: 10.1038/s41592-021-01081-y. Epub 2021 Mar 8.

Single-molecule FRET imaging of GPCR dimers in living cells

Affiliations

Single-molecule FRET imaging of GPCR dimers in living cells

Wesley B Asher et al. Nat Methods. 2021 Apr.

Abstract

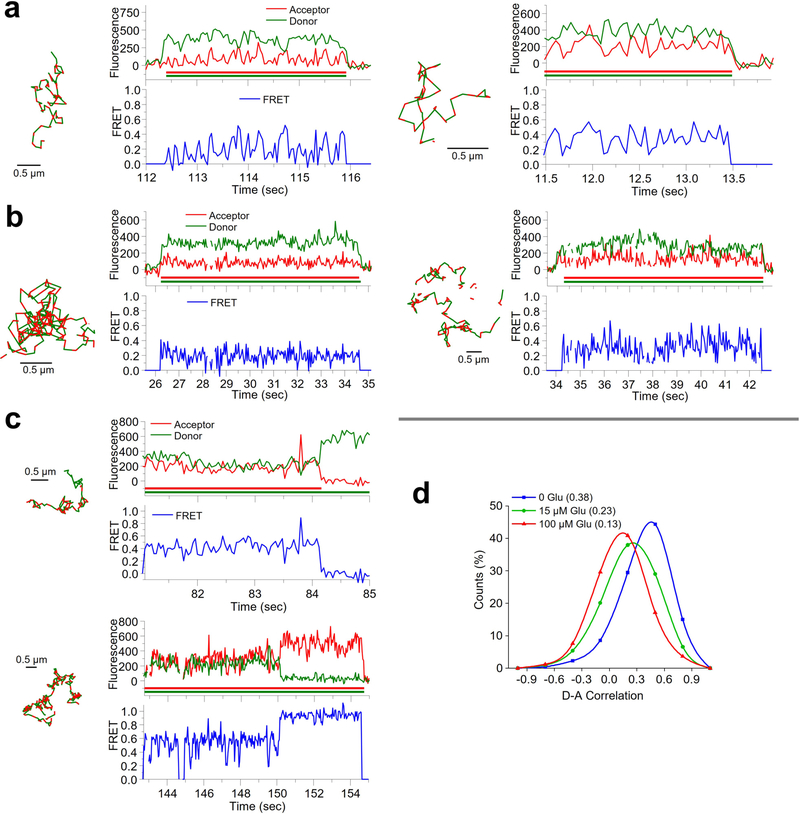
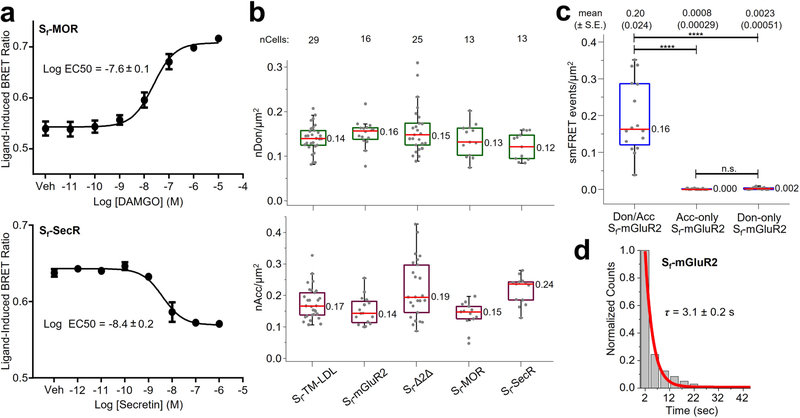
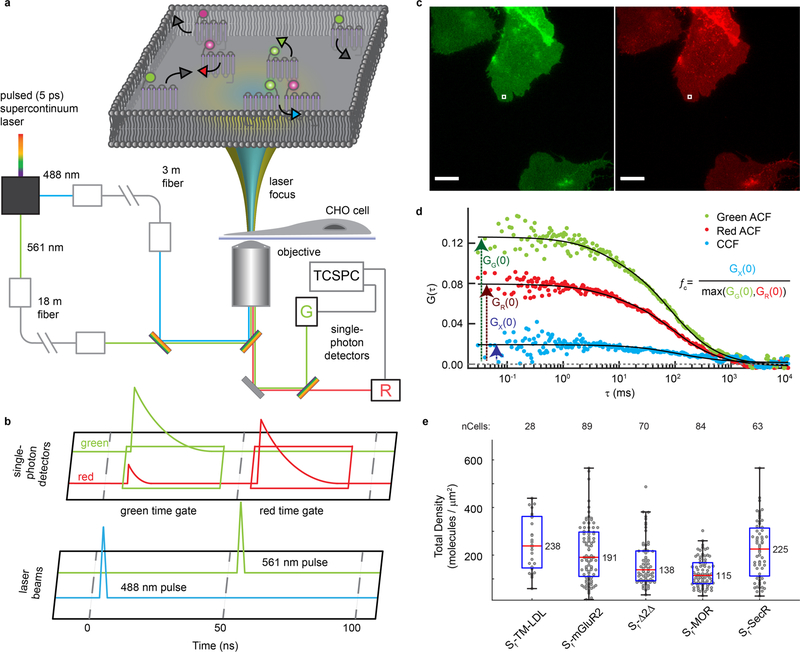
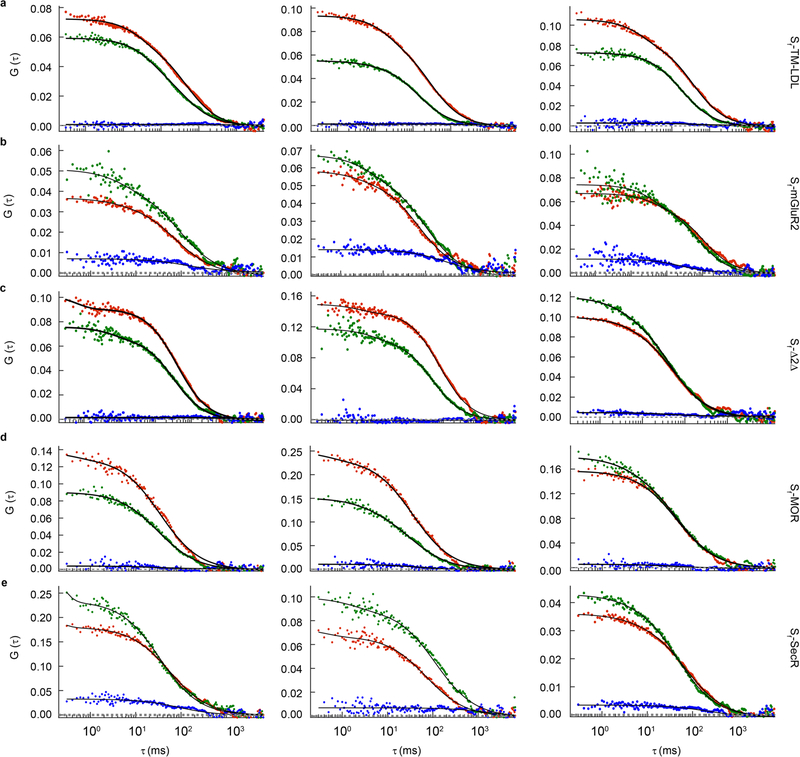
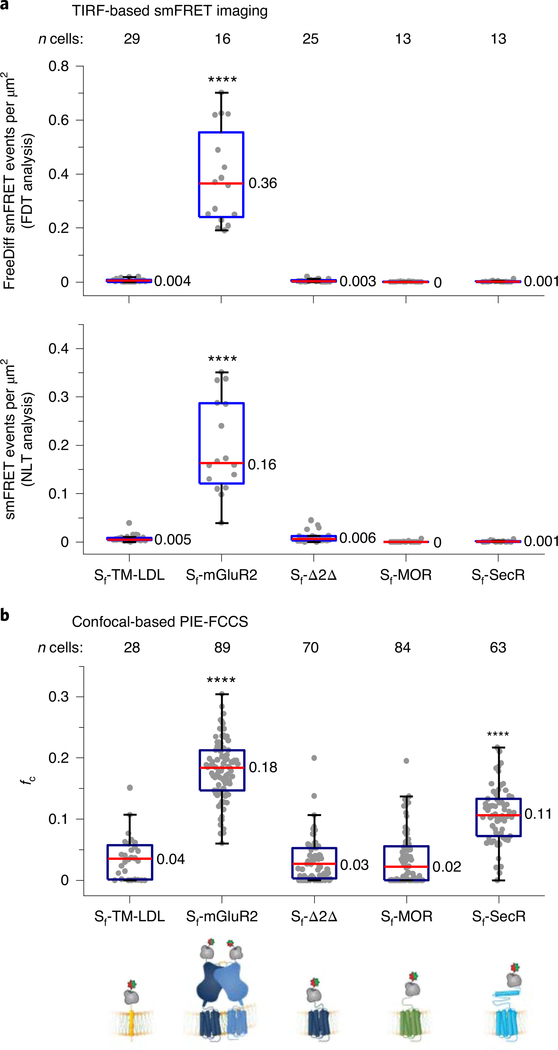
Class C G protein-coupled receptors (GPCRs) are known to form stable homodimers or heterodimers critical for function, but the oligomeric status of class A and B receptors, which constitute >90% of all GPCRs, remains hotly debated. Single-molecule fluorescence resonance energy transfer (smFRET) is a powerful approach with the potential to reveal valuable insights into GPCR organization but has rarely been used in living cells to study protein systems. Here, we report generally applicable methods for using smFRET to detect and track transmembrane proteins diffusing within the plasma membrane of mammalian cells. We leverage this in-cell smFRET approach to show agonist-induced structural dynamics within individual metabotropic glutamate receptor dimers. We apply these methods to representative class A, B and C receptors, finding evidence for receptor monomers, density-dependent dimers and constitutive dimers, respectively.


Conflict of interest statement

Competing interests

S.C.B. has an equity interest in Lumidyne Technologies. The other authors have no competing interests.

Figures

Extended Data Fig. 1 |
Extended Data Fig. 1 |. Expression and labeling of functional Sf-mGluR2 with self-healing fluorophores in living CHO cells.
a, The SNAPf tag is a modified O6-alkylguanine-DNA alkyltransferase enzyme that forms covalent linkages with benzylguanine (BG)-fluorophores. b, Dose-response curve for bioluminescence resonance energy transfer (BRET)-based cAMP inhibition assay confirming Sf-mGluR2 functionality. Global fits from three independent experiments each performed in triplicate. Error bars represent standard error of the mean (SEM). The mean Log EC50 with standard error is shown. c, Schematic of LEx-FITR CHO cells expressing the tet repressor (TetR) and with integrated receptor cDNA under control of the crippled CMV promoter (PcrCMV), two tetracycline operator 2 (2XTO2) sites, and weak Kozac sequence. Note that LEx-FITR cells were selected for a Flp-In site that leads to very low basal expression after receptor cDNA integration. d, Chemical structures of LD555p-BG and LD655-BG. Absorption (left plots) and emission (right plots) spectra of recombinantly expressed and purified SNAPf labeled with e, LD555p and f, LD655.
Extended Data Fig. 2 |
Extended Data Fig. 2 |. Quantification of the surface density of labeled Sf-mGluR2.
a, Representative initial image of a CHO cell containing donor and acceptor labeled Sf-mGluR2 of 16 cells generated by 532-nm and 640-nm dual excitation taken prior to smFRET imaging. Single-particle detection (purple circles) was used to quantify the number of particles within a region of interest (yellow line). Scale bar, 5 μm. b, Surface densities prior to smFRET imaging of cells labeled with donor and acceptor (Don/Acc) as well as with acceptor only (Acc-only) or with donor only (Don-only). Dots represent the number of acceptors or donors per area for each cell. Box plots indicate the median (central line) and interquartile range (IQR) (lower and upper box lines represent the 25- and 75-percentiles, respectively) while the whiskers represent those points that fall within 1.5 x IQR. The median density of total (acceptor + donor) labeled receptors was 0.30 receptors/μm2 (donor-to-acceptor ratio ~1:1). As expected, donor- and acceptor-only samples show labeling with only the fluorophore indicated.
Extended Data Fig. 3 |
Extended Data Fig. 3 |. Fluorescence and smFRET data for donor and acceptor labeled Sf-mGluR2 immobilized under fixed cell conditions.
a, Representative fluorescence (top)- and FRET (bottom) time traces for individual receptors. b, Distributions of the total intensity (donor + acceptor) and acceptor intensity during smFRET. The distributions were fit to a single gaussian function, yielding a mean total intensity of 458 photons/frame (full width at half maximum (FWHM) of 218) and a mean acceptor intensity of 279 photons/frame (FWHM of 288). c, Lifetime of smFRET events for Sf-mGluR2 in fixed cells. The lifetime distribution was fit to a single exponential to produce the decay constant τ. The data in panels b and c are derived from 124 molecules and a total of 16 cells.
Extended Data Fig. 4 |
Extended Data Fig. 4 |. Characterizing fluorescence and smFRET data for Sf-mGluR2 in the plasma membrane of living cells.
a, Total fraction of time spent in (left) and diffusion coefficients (right) for immobile (imm), confined (conf), free, and directed (dir) diffusion states assigned by DC-MSS. Dots represent individual cell means and the middle and upper/lower lines depict the overall mean (values shown) and standard deviation, respectively, for 16 cells. b, Distributions of the total (donor + acceptor) and acceptor intensities during smFRET. Histograms comprised of 5,546 freely diffusing smFRET trajectories from 16 cells were fit with a single-state gaussian model, yielding mean total and acceptor intensities of 457 (FWHM of 284) and 190 (FWHM of 135) photons/frame, respectively. c, Distribution of freely diffusing smFRET events per cell for receptor labeled with donor and acceptor (Don/Acc) (16 cells) compared to those with acceptor-only (16 cells) and donor-only (22 cells). Dots represent the total number of freely diffusing smFRET trajectories (including freely diffusing segments from smFRET trajectories with more than one diffusion state) per area for each cell. Box plot details are described in the legend of Extended Data Fig. 2b. One-way ANOVA (DF = 53; F-value = 92.5) and Tukey post-hoc comparison were performed to obtain p-values (****p « 0.0001; not significant (n.s.) = 0.997). The sum of the mean number of events per cell for the controls represent ~1% of those from Don/Acc Sf-mGluR2. d, Representative smFRET trajectories and fluorescence- and FRET-time traces for Sf-mGluR2 in the absence of ligand (apo state) without and e, with anticorrelation. Here and elsewhere, smFRET trajectories are shown to the left of their fluorescence (red and green traces indicating the intensities are derived from acceptor and donor tracks) and FRET traces. f, FRET-efficiency histograms fit with a single-(top) or two (bottom)-state gaussian model from traces without (top) and with anticorrelation (bottom) containing donor and acceptor labeled-mGluR2. The histograms are comprised of the number of trajectories (n) indicated from 6 cells. Each bar height represents the mean count of FRET values calculated from 6 cell samples. The length of the error bars corresponds to 1 s.d. from the mean. g, Distribution of the duration of smFRET events of 4,800 freely diffusing smFRET trajectories from 16 cells with single-exponential decay constant τ. h, Pearson correlation coefficients between donor and acceptor fluorescence traces were calculated for each segment and are shown as a histogram for the immobile (black), confined (magenta), and freely diffusing (blue) motion types. Lines are spline interpolations to facilitate comparison between conditions. Values in the legend correspond to the ensemble average correlation values. (i) FRET efficiency histogram comprised of immobile/confined segments for Sf-mGluR2 labeled with donor and acceptor. The histogram is fit with a two-state Gaussian model and consists of 93 immobile/confined segments from trajectories that also showed free diffusion obtained from 6 different cells. Error bars are described in the legend of Extended Data Fig. 4f.
Extended Data Fig. 5 |
Extended Data Fig. 5 |. SmFRET data for Sf-mGluR2 dimers diffusing within the plasma membrane of living cells.
Representative smFRET trajectories and their corresponding fluorescence- and FRET-time traces for individual receptors in the presence of a, 15 μM and b, 100 μM glutamate (Glu) as well as c, those showing transitions to the 0.84 FRET state (top, apo condition; bottom, 15 μM Glu condition). d, Pearson correlation coefficients between donor and acceptor fluorescence traces were compiled into histograms for trajectories obtained in the absence of ligands (blue), or in the presence of 15 μM Glu (green) or 100 μM Glu (red). Lines are spline interpolations to facilitate comparison between conditions. Values in the legend correspond to the ensemble average correlation values.
Extended Data Fig. 6 |
Extended Data Fig. 6 |. Characterization of functional Sf-MOR, Sf-SecR, and Sf-mGluR2 compared to controls in living cells.
a, Dose-response curves for BRET-based cAMP inhibition and generation assays confirming Sf-MOR (top) and Sf-SecR (bottom) functionality, respectively. Curve fitting details are described in Extended Data Fig. 1b legend. b, Surface densities prior to smFRET imaging of donor and acceptor labeled samples for smFRET studies. Dots represent the number of acceptor (nAcc) or donor (nDon) particles per area for single cells. Box plot details are described in the legend of Extended Data Fig. 2b. The densities for Sf-mGluR2 are reproduced from Extended Data Fig. 2b for comparison. The median density of total labeled (acceptor + donor) TM proteins ranged from 0.28 – 0.36 molecules/μm2. c, Distribution of smFRET events per cell for Sf-mGluR2 labeled with donor and acceptor (Don/Acc) (16 cells) compared to those for acceptor-only (16 cells) and donor-only (22 cells) controls as determined by the NLT analysis criteria. Dots represent the number of smFRET trajectories per area for each cell. Box plot details are described in the legend of Extended Data Fig. 2b. One-way ANOVA (DF = 53; F-value = 75.5) and Tukey post-hoc comparison were performed to obtain p-values (****p « 0.0001; n.s. = 0.996). The sum of the mean number of events per cell for the controls represent < 2% of those from Don/Acc Sf-mGluR2. d, Distribution of the duration of smFRET events of 2,695 smFRET trajectories for Sf-mGluR2 from 16 cells with the single-exponential with decay τ.
Extended Data Fig. 7 |
Extended Data Fig. 7 |. Overview of the PIE-FCCS method.
a, Schematic of the PIE-FCCS setup. Blue and green excitation beams, split from the same source, travel along fibers of different lengths to interleave the pulse arrival times. The diffraction-limited beams are focused at the cell surface and photons emitted from fluorescently labeled TM proteins diffusing through the laser focus are collected by the objective and directed to single photon detectors coupled to a TCSPC device. b, Pulsed interleaved excitation allows for separate time gating of green and red fluorophore emission readings that are time-tagged by the TCSPC device. c, A representative Sf-mGluR2 expressing CHO cells labeled with ATTO488-BG (left) and DY549P1-BG (right) in a ~1:1 ratio. White squares indicate approximate position and size of the laser focus during PIE-FCCS data collection. Scale bars, 10 μm. d, Example PIE-FCCS data from a single cell for Sf-mGluR2. Green and red dots are the autocorrelation functions (ACFs) obtained from fluorescence fluctuations in the green and red detection channels, respectively, while blue dots are the cross-correlation function (CCF) from the green and red co-diffusing species. The solid lines are model fits used to calculate fraction correlated (fc) as described in the Methods. e, Total surface densities of labeled samples for PIE-FCCS studies. Dots represent the total number of labeled molecules per area for single cells. Box plot details are described in the legend of Extended Data Fig. 2b.
Extended Data Fig. 8 |
Extended Data Fig. 8 |. Representative PIE-FCCS data curves for each construct.
PIE-FCCS data as described in Extended Data Fig. 7d from three representative cells for a, Sf-TM-LDL, b, Sf-mGluR2, c, Sf-Δ2Δ, d, Sf-MOR, and e, Sf-SecR.
Extended Data Fig. 9 |
Extended Data Fig. 9 |. SmFRET-RAP data for Sf-mGluR2.
a, Relationship between the number of acceptor and donor particles (nParticles) recovered 2 – 3 minutes after photobleaching and the total-background corrected acceptor and donor fluorescence per cell area. The number of cells for each point is 8. b, Surface densities of donor and acceptor labeled receptors before bleaching for the smFRET-RAP experiments (the median density of total labeled (acceptor + donor) receptors was ~ 4.0 molecules/μm2 (donor-to-acceptor ratio ~1:1)) compared to (c) those used for smFRET at lower expression levels reproduced from Extended Data Fig. 2b for comparison. Dots represent the number of acceptors (nAcc) and donors (nDon) per area for individual cells. Box plot details are described in the legend of Extended Data Fig. 2b. d, Representative acceptor and donor image sequence during smFRET with corresponding smFRET trajectory (red and green lines). Scale bar, 5 μm. Purple arrow at 10.64 s indicates a second donor particle that overlaps briefly with the particle showing smFRET. These occurrences do not influence the number of FRET events or their lifetime. e, Representative smFRET trajectory and fluorescence- and FRET-time traces derived from the image sequence in (d) where the donor and acceptor emission are anticorrelated upon acceptor photobleaching. f, Distribution of the duration of smFRET-RAP events comprised of 7,529 smFRET-RAP trajectories from 8 cells with single-exponential decay constant τ.
Extended Data Fig. 10 |
Extended Data Fig. 10 |. SmFRET-RAP data for Sf-SecR and Sf-MOR.
a, Acceptor (top) and donor (bottom) labeled receptor densities before photobleaching for smFRET-RAP (left panel) compared to those used for smFRET at lower receptor expression levels (right panel) reproduced from Extended Data Fig. 6b. Dots represent the number of acceptor (nAcc) or donor (nDon) particles per area for single cells. Box plot details are described in the legend of Extended Data Fig. 2b. b, c, TIRF images of representative CHO cells expressing labeled b, Sf-SecR from 7 cells and (c) Sf-MOR from 7 cells before donor and acceptor photobleaching (left panel), ~30 seconds after photobleaching (middle panel), and ~2 – 3 minutes after photobleaching (right panel) showing the recovery of labeled receptors (scale bar, 5 μm). d, Representative trajectories and sensitized acceptor intensity time traces for Sf-SecR. The top trajectory and trace are derived from the image sequence shown in Fig. 5b. e, Duration of smFRET events of SecR interactions determined from the tracking duration of sensitized acceptor trajectories. The distribution comprised of 4,232 trajectories from 21 cells was fit to a single exponential with decay constant (τ).
Fig. 1 |
Fig. 1 |. Imaging and tracking receptor dimers in living mammalian cells by smFRET.
a, Schematic of single-molecule TIRF imaging of CHO cells expressing Sf-mGluR2 labeled with LD555p and LD655 fluorophores. Don, donor; Acc, acceptor; EMCCD, electron-multiplying charge-coupled device. b, Representative image of a movie (frame 3, 0.12 s) of labeled Sf-mGluR2 excited by the donor laser (532 nm), showing acceptor signals colocalized with their corresponding donors, both delineated by white arrows. Scale bar, 5 μm; enlarged view, 8.8 μm × 5.8 μm. c, Data analysis and tracking platform for smFRET. Left, a set of control points was used to derive a nonlinear transform function T. The spatial position of the donor signal was then calculated by mapping the acceptor position at each time point onto the donor channel. Middle, representative smFRET image sequence of Sf-mGluR2 diffusing at the cell surface, showing the acceptor during FRET and its corresponding donor in the left and right channels, respectively. Scale bars, 1 μm. Trajectories for the acceptor and donor are shown as red and green lines in the image sequence. Right, fluorescence intensity time traces were generated, and FRET was calculated for each smFRET trajectory. The time traces correspond to the image sequence and smFRET trajectory shown.
Fig. 2 |
Fig. 2 |. Agonist-induced conformational dynamics in Sf-mGluR2 dimers.
a, Schematic depicting the structural reorganization of the LBD of mGluR2 upon glutamate (Glu) binding. Representative smFRET trajectories and their corresponding fluorescence and FRET time traces for receptor in the absence (apo) (b) or in the presence of 15 μM (d) or 100 μM (f) glutamate. The smFRET trajectories for each molecule are shown to the left of their fluorescence (donor and acceptor trajectories and intensities are shown in green and red, respectively) and FRET traces (in blue). The green and red bars along the time axis in the fluorescence time trace plots indicate that the signal was derived during tracking. FRET efficiency histograms of freely diffusing smFRET trajectories for molecules in the apo state (c) or in the presence of 15 μM (e) or 100 μM (g) glutamate. Histograms comprising the number of trajectories (n) shown from six cells for each condition were fit with a single Gaussian model for apo receptor, while those for glutamate-treated receptor were best fit with a two-state Gaussian model. Each bar height represents the mean count of FRET values calculated from six cell samples. The length of the error bars corresponds to 1 s.d. from the mean. h, Representative smFRET trajectories and their corresponding fluorescence and FRET time traces for receptors that show dynamics within the LBD. The trace to the left, at 100 μM glutamate, shows transitions between the ~0.29 and ~0.49 state. The trace on the right shows transitions between several states, including the ~0.84 state.
Fig. 3 |
Fig. 3 |. Comparing the dimerization of select TM proteins by TIRF-based smFRET imaging and confocal-based PIE-FCCS.
a, Distributions of smFRET events per cell area for Sf-TM-LDL, Sf-mGluR2, Sf-Δ2Δ, Sf-MOR and Sf-SecR. The smFRET events represent either the total number of freely diffusing (FreeDiff) smFRET trajectories (including freely diffusing segments from smFRET trajectories with more than one diffusion state) determined by FDT analysis (top) or the total number of smFRET trajectories determined by NLT analysis (bottom). Dots represent smFRET events per area for each cell. Box plots indicate the median (value shown as the central line) and interquartile range (lower and upper lines represent the 25th and 75th percentiles, respectively), while the whiskers represent the points that fall within 1.5 × interquartile range. Sf-mGluR2 showed a significant difference compared to each of the other samples (****P < 0.0001, both plots), while Sf-TM-LDL, Sf-Δ2Δ, Sf-MOR and Sf-SecR showed no significant differences (P ≥ 0.999, top; P ≥ 0.964, bottom) (degrees of freedom (DF) (both plots) = 95; F (top plot) = 97.0; F (bottom plot) = 74.1). One-way ANOVA and Tukey’s post hoc comparison were performed to obtain P values. b, Distribution of fc, determined by PIE-FCCS for each construct from the same cell lines used for smFRET above after induction to increase expression. Box plot details are described in the legend for a. Sf-mGluR2 and Sf-SecR showed a significant difference compared to all other samples (****P < 0.0001), while no significant differences were present between Sf-TM-LDL, Sf-Δ2Δ and Sf-MOR (P ≥ 0.977) (DF = 333; F = 170.5). One-way ANOVA and Tukey’s post hoc comparison were performed to obtain P values.
Fig. 4 |
Fig. 4 |. Summary of the smFRET-RAP method and representative Sf-mGluR2 data.
a, Schematic of the smFRET-RAP approach. Active donor- and acceptor-labeled receptors in the TIRF-illumination field are selectively photobleached in TIRF mode, producing an analysis region within the plasma membrane defined by the TIRF field. Unbleached acceptor- and donor-labeled receptors subsequently diffuse from the apical membrane outside the TIRF field into the analysis region, so that single molecules can be resolved and imaged under normal single-molecule TIRF imaging conditions. Em Don, emitting donor; Em Acc, emitting acceptor. b, TIRF images taken briefly by direct and simultaneous donor and acceptor excitation of a representative CHO cell from eight cells expressing labeled Sf-mGluR2 before donor and acceptor photobleaching (left), ~30 s after photobleaching (middle) and ~2–3 min after photobleaching (right), showing the recovery of labeled receptors (scale bar, 5 μm). c, SmFRET-RAP image of the cell shown in b, taken by donor excitation, showing sensitized acceptors and associated donors, depicted by red and green arrows, respectively. Scale bar, 5 μm; inset, higher magnification (3.7 μm × 6.7 μm).
Fig. 5 |
Fig. 5 |. Summary of smFRET-RAP data for Sf-SecR and Sf-MOR.
a, Representative smFRET-RAP image of acceptors during FRET (sensitized acceptors) for a CHO cell expressing donor- and acceptor-labeled Sf-SecR (top) from 21 cells or Sf-MOR (bottom) from 7 cells. Scale bar, 5 μm; insets, higher magnification (4.8 μm × 3.8 μm). b, Sensitized acceptor image sequence during FRET with a corresponding trajectory (red line) for Sf-SecR. c, Distribution of smFRET-RAP events per cell area for donor- and acceptor (Don–Acc)-labeled Sf-SecR and Sf-MOR, as well as for acceptor-only- and donor-only-labeled Sf-SecR. Dots represent the total number of smFRET-RAP trajectories determined by NLT analysis per area for an individual cell. Box plot details are described in the legend of Fig. 3a. Donor- and acceptor-labeled Sf-SecR showed a significant difference compared to all of the other samples shown (****P = 7.02 × 10⁻⁵, DF = 20.1, t-statistic = 4.98; ***P = 3.01 × 10⁻⁴, DF = 22.0, t-statistic = 4.29; **P = 3.16 × 10⁻⁴, DF = 20.9, t-statistic = 4.31). Unpaired two-sided t-tests were performed to obtain P values.

Comment in

Similar articles

Cited by

References

    1. Asher WB et al. Extreme vetting of dopamine receptor oligomerization. In Receptors 33, 99–127 (Humana Press, 2017).
    1. Lambert NA & Javitch JA CrossTalk opposing view: weighing the evidence for class A GPCR dimers, the jury is still out. J. Physiol. 592, 2443–2445 (2014). - PMC - PubMed
    1. Doumazane E et al. Illuminating the activation mechanisms and allosteric properties of metabotropic glutamate receptors. Proc. Natl Acad. Sci. USA 110, E1416–E1425 (2013). - PMC - PubMed
    1. Maurel D et al. Cell-surface protein–protein interaction analysis with time-resolved FRET and snap-tag technologies: application to GPCR oligomerization. Nat. Methods 5, 561–567 (2008). - PMC - PubMed
    1. White JH et al. Heterodimerization is required for the formation of a functional GABAB receptor. Nature 396, 679–682 (1998). - PubMed

Publication types

MeSH terms

Substances