. 2021 Aug 2;224(3):458-468.
doi: 10.1093/infdis/jiab122.

Tracing the Source of Influenza A Virus Zoonoses in Interconnected Circuits of Swine Exhibitions

Affiliations

Tracing the Source of Influenza A Virus Zoonoses in Interconnected Circuits of Swine Exhibitions

Dillon S McBride et al. J Infect Dis. .

Abstract

Background: Since 2011, influenza A viruses circulating in US swine exhibited at county fairs are associated with >460 zoonotic infections, presenting an ongoing pandemic risk. Swine "jackpot shows" that occur before county fairs each summer intermix large numbers of exhibition swine from diverse geographic locations. We investigated the role of jackpot shows in influenza zoonoses.

Methods: We collected snout wipe or nasal swab samples from 17 009 pigs attending 350 national, state, and local swine exhibitions across 8 states during 2016-2018.

Results: Influenza was detected in 13.9% of swine sampled at jackpot shows, and 76.3% of jackpot shows had at least 1 pig test positive. Jackpot shows had 4.3-fold higher odds of detecting at least 1 influenza-positive pig compared to county fairs. When influenza was detected at a county fair, almost half of pigs tested positive, clarifying why zoonotic infections occur primarily at county fairs.

Conclusions: The earlier timing of jackpot shows and long-distance travel for repeated showing of individual pigs provide a pathway for the introduction of influenza into county fairs. Mitigation strategies aimed at curtailing influenza at jackpot shows are likely to have downstream effects on disease transmission at county fairs and zoonoses.

Keywords: United States; animals; farms; human-animal interface; influenza A virus; pandemic risk; prevalence; public health; swine; transmission; zoonoses.


Figures

Figure 1.
Figure 1.
Characteristics of the 3 exhibition swine show types included in this study. National jackpot shows (blue) are the least frequent show type, with a small subset of all swine exhibitors traveling to attend. Attracting exhibitors from all over the US, national jackpot shows are very large, often with thousands of pigs in attendance. Circuits of state jackpot shows (orange) are organized in each state and occur every weekend for many weeks, allowing exhibitors to show every weekend and return home before showing the same or multiple pigs the following week. State jackpot circuits attract a subset of exhibitors from primarily within their individual state, but with typical interstate travel for some exhibitors. County fairs (green) occur in nearly every county within our study range, allowing only pigs from within that county to attend, and with nearly all youth swine exhibitors attending their local county fair.
Figure 2.
Figure 2.
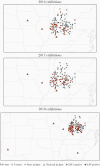
Maps of swine exhibitions sampled in 2016, 2017, and 2018. Each point represents a swine exhibition sampled for this study. The color of the point indicates whether pigs at the exhibition tested polymerase chain reaction (PCR) negative for influenza A virus (IAV, gray) or at least 1 pig tested PCR positive for IAV (red). The shape of the point indicates the type of exhibition (county, state jackpot, or national jackpot).
Figure 3.
Figure 3.
Geographic range of national and state jackpot exhibitors in 2016, 2017, and 2018. Each year, participants from 31–37 US states attended the national jackpot shows sampled in our study. The state jackpot shows in our study drew participants from 4–9 states. Circular points are the home zip code locations of sampled pigs, and point color indicates whether pigs from a particular zip code tested polymerase chain reaction (PCR) positive or PCR negative for influenza A virus (IAV). Yellow diamonds are the locations of jackpot shows. Lines are colored by show identity and connect shows to home zip codes. Histograms are binned distances (miles) traveled by exhibitors from their home zip code to show locations.
Figure 4.
Figure 4.
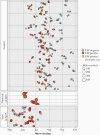
The timing of swine exhibitions organized by show type. Exhibitions that occurred from May to October during 2016–2018 are aggregated to show the relative timing (month-day) of swine exhibitions throughout the year. Point color indicates whether pigs sampled at an exhibition tested polymerase chain reaction (PCR) negative for influenza A virus (IAV, gray), if at least 1 pig tested PCR-positive for IAV (red), or if at least 1 pig tested positive for IAV and the exhibition was linked to a zoonotic infection (yellow). Point size indicates the average distance in miles traveled by exhibitors to attend that show based on the United States postal code of their home farm. Shows are arranged on the y-axis by longitude and jittered for clarity.
Figure 5.
Figure 5.
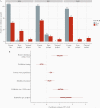
A, Number of swine exhibitions that tested polymerase chain reaction (PCR) positive or PCR negative for influenza A virus (IAV). Exhibitions were designated as IAV positive if ≥1 pig tested IAV positive using PCR. Gray bars correspond to IAV-negative exhibitions, and red bars correspond to IAV-positive exhibitions. B, Risk factors of exhibitions testing PCR positive for IAV (county fairs and state jackpots). Median coefficient estimates (circles) and posterior 50% and 95% credible intervals (CrI; inner and outer whiskers) were estimated using a Bayesian logistic regression model. Continuous predictors were mean-centered and scaled prior to model fitting
Figure 6.
Figure 6.
Influenza A virus (IAV) prevalence in all swine exhibitions (A) and IAV polymerase chain reaction (PCR)–positive swine exhibitions (B) in 2016, 2017, and 2018. Exhibitions were designated as IAV positive if ≥1 pig tested IAV positive using PCR. Violin plots show the distribution of exhibition prevalence and contain boxplots that visualize 5 summary statistics (the median, 2 hinges, and 2 whiskers). The lower and upper hinges correspond to the first and third quartiles (the 25th and 75th percentiles), and whiskers extend to points within 1.5 interquartile ranges of the lower and upper quartile for a distribution.

References

    1. Reid AH, Taubenberger JK. The origin of the 1918 pandemic influenza virus: a continuing enigma. J Gen Virol 2003; 84:2285–92. - PubMed
    1. Webster RG. The importance of animal influenza for human disease. Vaccine 2002; 20(Suppl 2):S16–20. - PubMed
    1. Smith GJ, Vijaykrishna D, Bahl J, et al. Origins and evolutionary genomics of the 2009 swine-origin H1N1 influenza A epidemic. Nature 2009; 459:1122–5. - PubMed
    1. Ma W, Kahn RE, Richt JA. The pig as a mixing vessel for influenza viruses: human and veterinary implications. J Mol Genet Med 2008; 3:158–66. - PMC - PubMed
    1. Garten RJ, Davis CT, Russell CA, et al. Antigenic and genetic characteristics of swine-origin 2009 A(H1N1) influenza viruses circulating in humans. Science 2009; 325:197–201. - PMC - PubMed

Publication types