. 2021 Mar;26(4):043007.
doi: 10.1117/1.JBO.26.4.043007.

Systematic stability testing of insulins as representative biopharmaceuticals using ATR FTIR-spectroscopy with focus on quality assurance

Affiliations

Systematic stability testing of insulins as representative biopharmaceuticals using ATR FTIR-spectroscopy with focus on quality assurance

Sven Delbeck et al. J Biomed Opt. 2021 Mar.

Abstract

Significance: Bioactive proteins represent the most important component class in biopharmaceutical products for therapeutic applications. Their production is most often biotechnologically realized by genetically engineered microorganisms. For the quality assurance of insulins as representatives of life-saving pharmaceuticals, analytical methods are required that allow more than total protein quantification in vials or batches. Chemical and physical factors such as unstable temperatures or shear rate exposure under storage can lead to misfolding, nucleation, and subsequent fibril forming of the insulins. The assumption is valid that these processes go parallel with a decrease in bioactivity.

Aim: Infrared (IR) spectroscopy has been successfully utilized for secondary structure analysis in cases of protein misfolding and fibril formation.

Approach: A reliable method for the quantification of the secondary structure changes has been developed using insulin dry-film Fourier-transform IR spectroscopy in combination with the attenuated total reflection (ATR) technique and subsequent data analyses such as band-shift determination, spectral band deconvolution, and principal component analysis.

Results: A systematic study of insulin spectra was carried out on model insulin specimens, available either as original formulations or as hormones purified by ultrafiltration. Insulin specimens were stored at different temperatures, i.e., 0°C, 20°C, and 37°C, respectively, for up to three months. Weekly ATR-measurements allowed the monitoring of hormone secondary structure changes, which are supposed to be negatively correlated with insulin bioactivity.

Conclusions: It could be shown that IR-ATR spectroscopy offers a fast and reliable analytical method for the determination of secondary structural changes within insulin molecules, as available in pharmaceutical insulin formulations and therefore challenges internationally established measurement techniques for quality control regarding time, costs, and effort of analysis.

Keywords: dry-film attenuated total reflection spectroscopy; infrared spectroscopy; insulin quality monitoring; point-of-care diagnostics; protein secondary structure analysis.


Figures

Fig. 1
Fig. 1
Schematics for the insulin sample treatment with ultrafiltration and subsequent IR ATR measurement including data evaluation.
Fig. 2
Fig. 2
(a) Photo of the ATR accessory of a Bruker ALPHA FT-IR spectrometer with manual sample deposition (volume 1  μl) and (b) diagram of an ultrafiltrated insulin dry-film after water evaporation as measured by laser scanning.
Fig. 3
Fig. 3
Spectra from three different insulin pharmaceuticals, demonstrating the reproducibility of dry-film preparations after minimum-maximum normalization with standard deviation spectra from five repeat measurements (offset for clarity).
Fig. 4
Fig. 4
(a) ATR dry-film spectra of an insulin lispro sample as formulation, and fractions after ultrafiltration, which are represented by the filtrate and the purified insulin obtained after washing cycles and prepared as aqueous solution; (b) spectra of the different excipients, as found in the insulin formulations.
Fig. 5
Fig. 5
(a) Score plots from the first two principal components of repeat spectra recorded from three different classes of manufactured insulin formulation (see also text; corresponding dry-film ATR spectra have been given in Fig. 3); (b) loading spectra after the PC analysis of seven different insulins as measured during a ten-week storage at 37°C; (c) corresponding score plots from PC one and four, illustrating the possible classification of insulins.
Fig. 6
Fig. 6
SEM image (Zeiss Sigma 300 VP, Oberkochen, Germany) of the fibril structure within an insulin detemir sample after fibrillation, measured as dry-film from a solution on a gold-sputtered microscope slide; the sample had been diluted by a factor of 10 for achieving a better optical separation of the insulin fibrils.
Fig. 7
Fig. 7
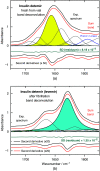
Structural analysis of the amide I band, containing information on the secondary structure components of α-helical, β-sheet, side-chain and turn conformations, and of stabilizing agents such as phenol and m-cresol (for further information on band positions of secondary sub-structures, see also Ref. 14). (a) Band positions have been selected after calculating the second derivative spectra of the reference sample of insulin detemir and (b) the sample after 48 h of incubation at 37°C in buffer solution at pH=1.5 resulting in misfolding and fibrillation.
Fig. 8
Fig. 8
Secondary structure changes detected within the amide I and II bands, and in second derivative insulin-ATR spectra, when stored at different temperature conditions over nine weeks: (a) and (c) dry-film spectra from pure insulin solutions, and (b) and (d) from insulin formulation samples.
Fig. 9
Fig. 9
(a) Plot of the amide I band positions during long term storage of an ultrafiltrated pure insulin lispro sample at 37°C, fitted with a sigmoidal Boltzmann function; (b) same plot obtained for a humalog insulin formulation stored at 20°C.
Fig. 10
Fig. 10
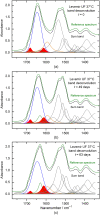
Structural analysis of pure insulin detemir bands within the interval of 1750 to 1350  cm1, containing information on the secondary structure components in different subunits with a special focus on the amide I band. The subplots (a)–(c) represent the status after different time lapses of insulin solution storage at 37°C.
Fig. 11
Fig. 11
Plot of the amide I band component integral of the band centered at 1630  cm1, attributable to changes in beta sheet formation during long term storage of an ultrafiltrated pure insulin Levemir sample at a temperature of 37°C and characterized by a sigmoidal function obtained by a least-squares fit.
Fig. 12
Fig. 12
Plot of the maximum band positions derived from amide I (black curve) and Amide A (red curve) bands, using the same insulin dry-film spectra as analyzed in Fig. 11. Results from the sigmoidal least-squares fits are given in Table 1.
Fig. 13
Fig. 13
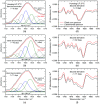
Experimental (black curves) and calculated (red curves) amide I bands of a purified insulin lispro (Humalog) sample, measured at selected storage times as dry-films on an ATR diamond from 1-μl sample volumes. (a)–(c) Secondary structure related sub bands are shown under the amide I curves, representing the determined ratio of alpha helices, beta sheets, random coils and turns; comparison of second derivative spectra as calculated from the experimental and sum band spectra are shown in the subplots on the right. Calculations have been performed using the Savitzky–Golay algorithm with nine-point cubic polynomials. (d)–(f) This final step can be used for validating the band deconvolution.

References

    1. Santos C., McCaig L., “An executive summary—USP general chapter <1049.1> design of stability studies for biotechnology product development and lifecycle management,” BioPharm International October issue (2019).
    1. Thomas F., “Stability testing: the crucial development step,” Pharm. Technol. Europe 32(3), 28–31 (2020).
    1. Carter A.W., Heinemann L., “Insulin concentration in vials randomly purchased in pharmacies in the United States: considerable loss in the cold supply chain,” J. Diabetes Sci. Technol. 12(4), 839–841 (2018).10.1177/1932296817747292 - DOI - PMC - PubMed
    1. Petersen M. P., et al. , “In response to Carter and Heinemann: insulin concentration in vials randomly purchased in pharmacies in the United States: considerable loss in the cold supply chain,” J. Diabetes Sci. Technol. 12(4), 890–891 (2018).10.1177/1932296818761972 - DOI - PMC - PubMed
    1. Connery A., Martin S., “Lilly calls into question the validity of published insulin concentration results,” J. Diabetes Sci. Technol. 12(4), 892–893 (2018).10.1177/1932296818762502 - DOI - PMC - PubMed