. 2021 Mar;38(Supplement):S11-S21.
doi: 10.4103/lungindia.lungindia_410_20.

Diagnostic accuracy of chest computed tomography in improving the false negative rate as compared to reverse transcriptase polymerase chain reaction in coronavirus disease 2019 pneumonia: A cross sectional analysis of 348 cases from India

Affiliations

Diagnostic accuracy of chest computed tomography in improving the false negative rate as compared to reverse transcriptase polymerase chain reaction in coronavirus disease 2019 pneumonia: A cross sectional analysis of 348 cases from India

Reddy Ravikanth. Lung India. 2021 Mar.

Abstract

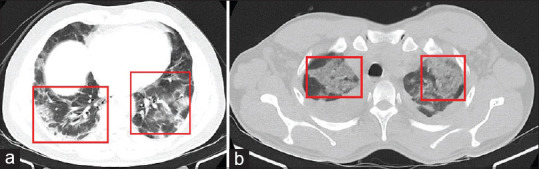
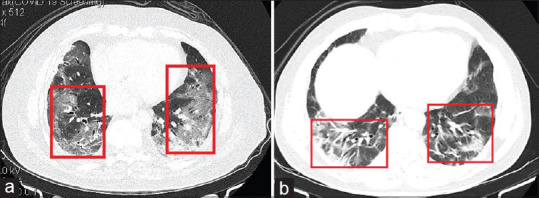
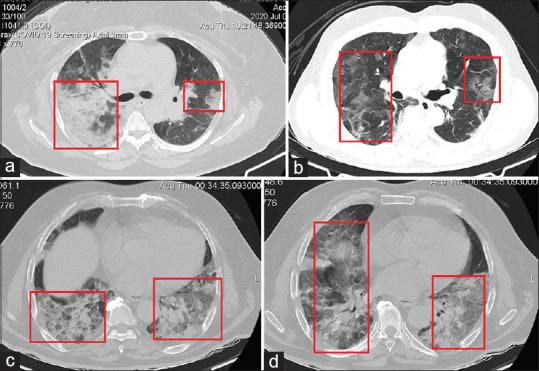
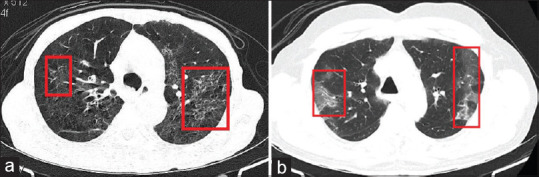
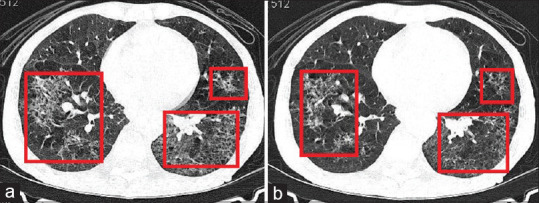
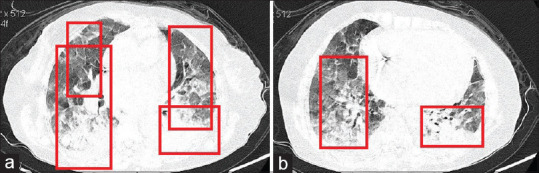
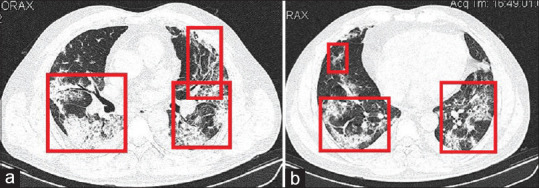
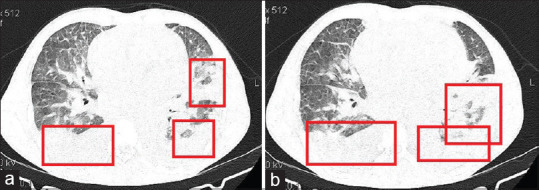
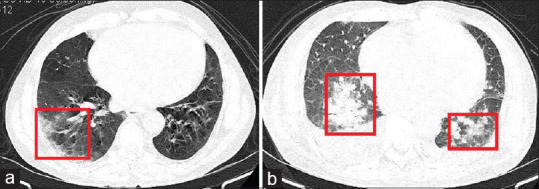
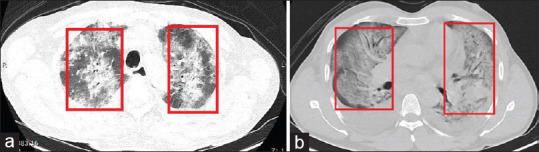
Background: Early differentiation between emergency department (ED) patients with and without coronavirus disease 2019 (COVID-19) is very important. The diagnosis of COVID-19 depends on real-time reverse transcriptase polymerase chain reaction (RT-PCR). On imaging, computed tomography (CT) manifestations resemble those seen in viral pneumonias, with multifocal ground-glass opacities and consolidation in a peripheral distribution being the most common findings. Although these findings lack specificity for COVID-19 diagnosis on imaging grounds, CT could be used to provide objective assessment about the extension of the lung opacities, which could be used as an imaging surrogate for disease burden. We set out to investigate the diagnostic accuracy of chest CT scanning in detecting COVID-19 in a population with suspected COVID-19 patients.

Materials and methods: In this cross-sectional single-center study performed on 348 cases with clinical suspicion of COVID-19, all adult symptomatic ED patients had both a CT scan and a PCR upon arrival at. CT results were compared with PCR test (s) and diagnostic accuracy was calculated.

Results: Between February 15, 2020, and June 30, 2020, 348 symptomatic patients were included. In total, 62.3% of patients had a positive PCR and 69.8% had a positive CT, resulting in a sensitivity of 94.2%, specificity of 76.7%, likelihood ratio (LR) of +2.94 and (LR) -0.18. The sensitivity of the CT tended to be higher in those with acute respiratory distress syndrome (100.0%, P = 0.017) and severe COVID-19 (98.5%, P = 0.027) than in patients with mild (82.5%, P = 0.047) and moderate COVID-19 (89.3%, P = 0.039). The diagnostic ability of chest CT was found to be high with 86.3% concordance between findings of CT and PCR. In 48 (13.7%) patients, discordant findings between CT and PCR were observed. In most cases, the CT scan was considered suspicious for COVID-19, while the PCR was negative (37/48, 77.0%). In the majority of these, the diagnosis at discharge was pulmonary infection (n = 26; 54.1%).

Conclusion: The accuracy of chest CT in symptomatic COVID suspect patients is high, but when used as a single diagnostic test, CT cannot accurately diagnose or exclude COVID-19. Therefore, we recommend a combination of both CT and RT-PCR for future follow-up, management, and medical surveillance.

Keywords: CT; Coronavirus disease 2019; RT PCR; sensitivity; specificity.


Conflict of interest statement

None

Figures

Figure 1
Figure 1
Axial computed tomography images in patients with coronavirus disease 2019 pneumonia. 62-year-old male, day 3 after symptom onset showing subpleural areas of mixed ground-glass opacities in basal segments of bilateral lower lobes (a). Follow-up computed tomography image on day 6 showing extensive consolidation in the posterior zone of left upper lobe and basal zone of right lower lobe (b)
Figure 2
Figure 2
Axial computed tomography images in patients with coronavirus disease 2019 pneumonia. 44-year-old male, day 5 after symptom onset showing mixed ground-glass opacities in posterior segments of right upper lobe and basal segments of bilateral lower lobes (a). Follow-up computed tomography image on day 9 showing extensive consolidation in inferior segments of bilateral upper lobes and lower lobes (b)
Figure 3
Figure 3
Axial computed tomography images in patients with coronavirus disease 2019 pneumonia. 60-year-old male, day 3 after symptom onset: focal ground-glass opacity associated with smooth interlobular and intralobular septal thickening in the right lower lobes (a). 71-year-old female, day 10 after symptom onset: bilateral, peripheral ground-glass opacity associated with smooth interlobular and intralobular septal thickening representing a crazy-paving pattern (b). 63-year-old female, day 20 after symptom onset: bilateral and peripheral predominant consolidation pattern with a round cystic change internally (c). 67-year-old female, day 17 after symptom onset: bilateral, peripheral mixed pattern associated with air bronchograms in both lower and upper lobes, with a small amount of pleural effusion (d)
Figure 4
Figure 4
Serial axial computed tomography images in a 67-year-old female with coronavirus disease 2019, day 5 after symptom onset showing diffuse bilateral ground-glass opacities with focal consolidations (mixed pattern) and reticulations in the lower lobes (a). Also note the subpleural sparing seen in these lesions (b)
Figure 5
Figure 5
Serial axial computed tomography images in a 60-year-old male with coronavirus disease 2019, day 4 after symptom onset showing bilateral peripheral ground-glass opacities with organizing consolidations (mixed pattern) (a). There is also “reversed halo” appearance of central ground glass opacity surrounded by denser consolidation (b)
Figure 6
Figure 6
Serial axial computed tomography images in a 54-year-old male with coronavirus disease 2019, day 7 after symptom onset showing round areas of mixed ground-glass opacity and consolidation at level of aortic arch (a) and ventricles (b) in right and left lower lobe posterior zones, and upper zones
Figure 7
Figure 7
Axial computed tomography image in a 81-year-old female with coronavirus disease 2019, day 3 after symptom onset showing ground glass opacification (a). Computed tomography image obtained on day 7 shows ground glass opacification has progressed to airspace consolidation (b)
Figure 8
Figure 8
Serial axial computed tomography images in a 31-year-old male with coronavirus disease 2019, day 3 after symptom onset showing multifocal mixed ground-glass opacities with peripheral distribution (a), and air bronchogram can be found in left lower lobe ground-glass opacities (b)
Figure 9
Figure 9
Axial computed tomography images in a 63-year-old female with coronavirus disease 2019, day 7 after symptom onset showing patchy consolidation and fibrosis (a) subsequently progressing to organizing pneumonia on day 11 (b)
Figure 10
Figure 10
Axial computed tomography image in a 40-year-old male with coronavirus disease 2019, day 5 after symptom onset showing peripheral distribution of patchy ground-glass opacities plus reticular pattern (a). Follow-up computed tomography image obtained on day 9 shows peripheral plus central distribution of ground-glass opacities, partial consolidation, and fibrosis streak (b)
Figure 11
Figure 11
Serial axial computed tomography images in a 67-year-old female with coronavirus disease 2019, day 3 after symptom onset showing bilateral diffuse ground-glass opacities (a) and reticulation (b)
Figure 12
Figure 12
Serial axial computed tomography images in a 55-year-old male with coronavirus disease 2019, day 7 after symptom onset showing multiple ground-glass opacities and septal thickening, the imaging manifestation is the so-called “white lungs” (a-c)
Figure 13
Figure 13
Axial computed tomography image in a 57-year-old male with coronavirus disease 2019, day 1 after symptom onset showing pure ground glass opacity in the right lower lobe (a). Follow-up computed tomography image on day 7 showing consolidation in the bilateral lower lobes (b)
Figure 14
Figure 14
Axial computed tomography image in a 77-year-old female with coronavirus disease 2019, day 2 after symptom onset showing slight reticular pattern in the bilateral lower lobes and subpleural areas (a). Axial computed tomography image in a 36-year-old female with coronavirus disease 2019, day 7 after symptom onset showing reticular pattern superimposed on the background of GGO – crazy paving appearance with “white out” lungs in the right middle lobe and bilateral lower lobes (b)

Similar articles

Cited by

References

    1. Wu Z, McGoogan JM. Characteristics of and important lessons from the coronavirus disease 2019 (COVID-19) outbreak in China: Summary of a report of 72 314 cases from the Chinese center for disease control and prevention. JAMA. 2020;323:1239–42. - PubMed
    1. Li Q, Guan X, Wu P, Wang X, Zhou L, Tong Y, et al. Early transmission dynamics in Wuhan, China, of novel coronavirus-infected pneumonia. N Engl J Med. 2020;382:1199–1207. - PMC - PubMed
    1. WHO 2020, We now have a name for the #2019nCoV disease: COVID-19. I’ll spell it: C-O-V-I-D hyphen one nine – COVID-19”, Tweet; 11 February. 2020. [Last accessed on 2020 Jul 29]. Available from: https://twitter.com/WHO/status/1227248333871173632 .
    1. [Last accessed on 2020 Jul 29];Wuhan Coronavirus (2019-nCoV) Global Cases (by Johns Hopkins CSSE). Case Dashboard.
    1. Zhu Y, Liu YL, Li ZP, Kuang JY, Li XM, Yang YY, et al. Clinical and CT imaging features of 2019 novel coronavirus disease (COVID-19) J Infect. 2020;81:147–78. - PMC - PubMed