. 2021 Mar 9:10:e62585.
doi: 10.7554/eLife.62585.

Proteomic and transcriptomic profiling reveal different aspects of aging in the kidney

Affiliations

Proteomic and transcriptomic profiling reveal different aspects of aging in the kidney

Yuka Takemon et al. Elife. .

Abstract

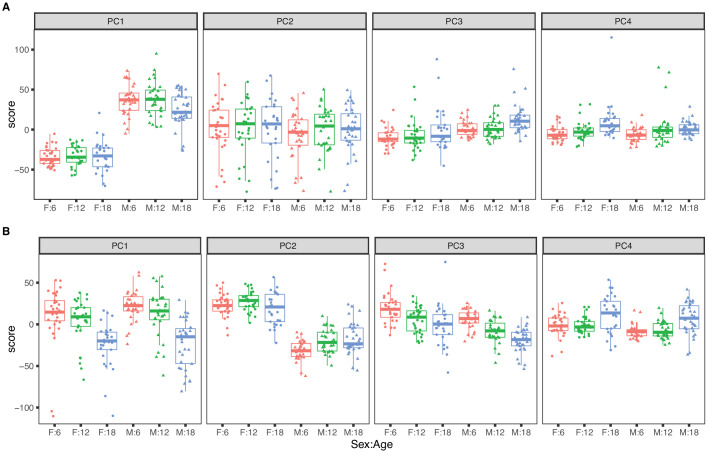
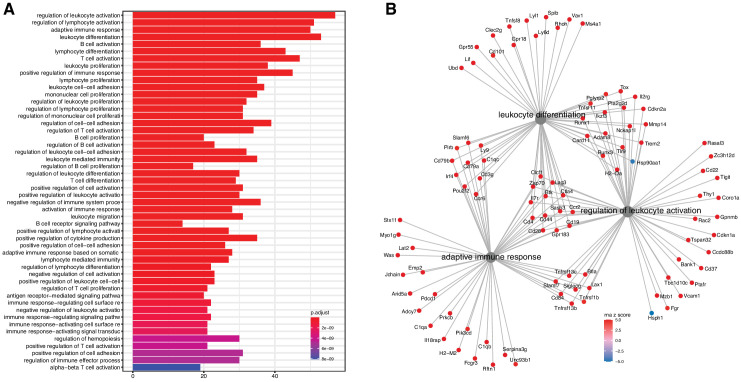
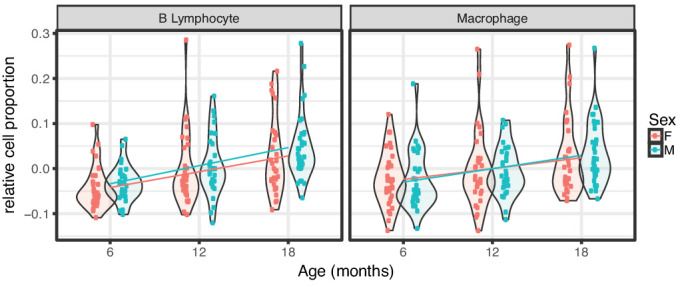
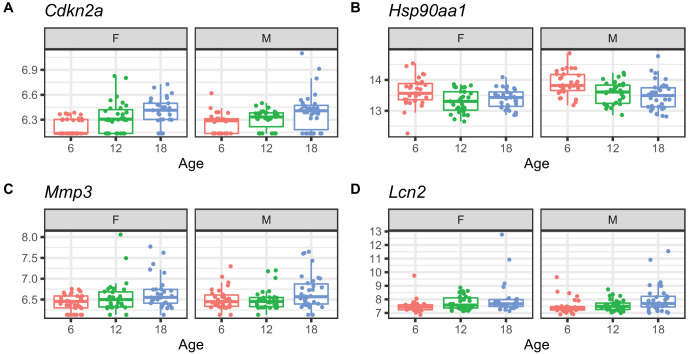
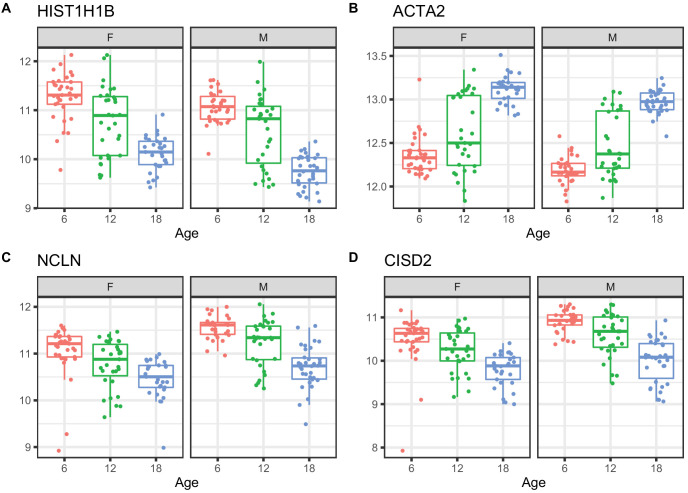
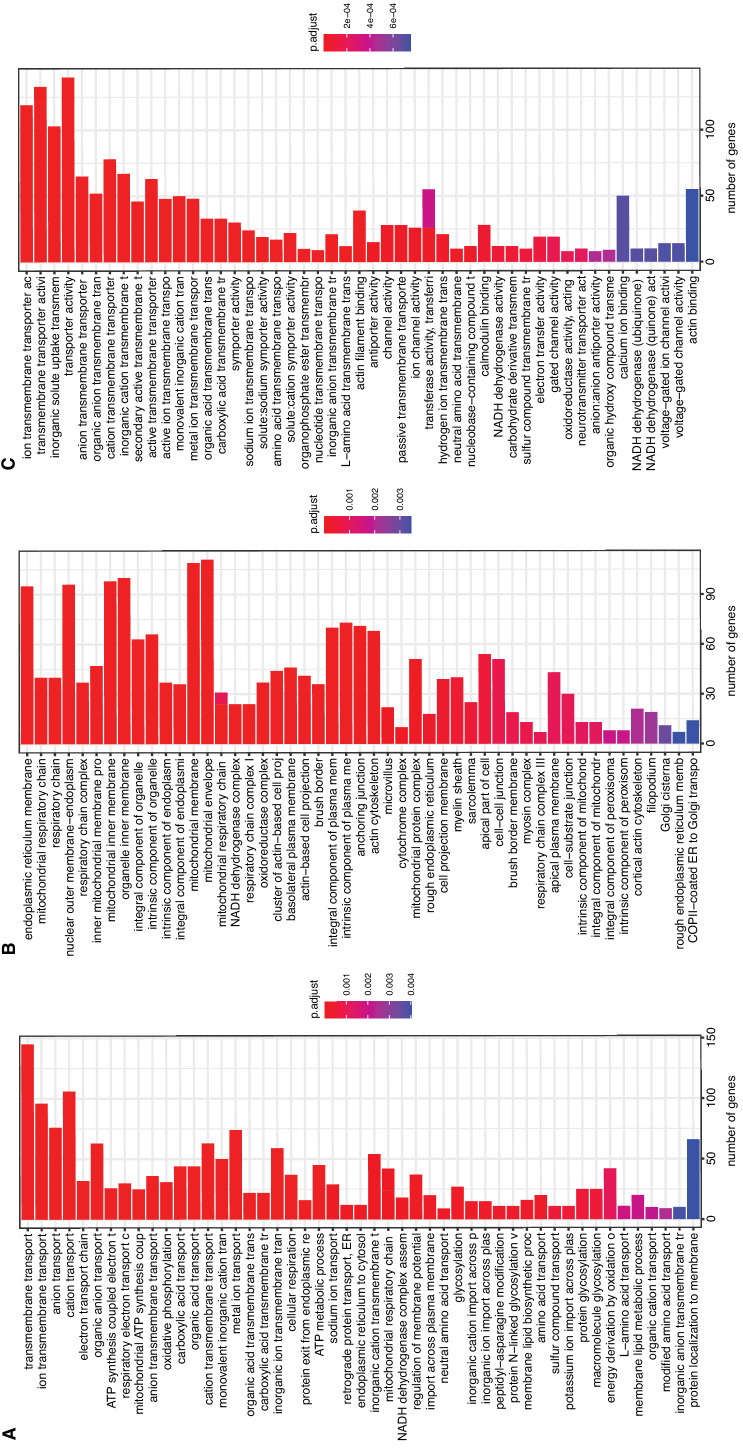
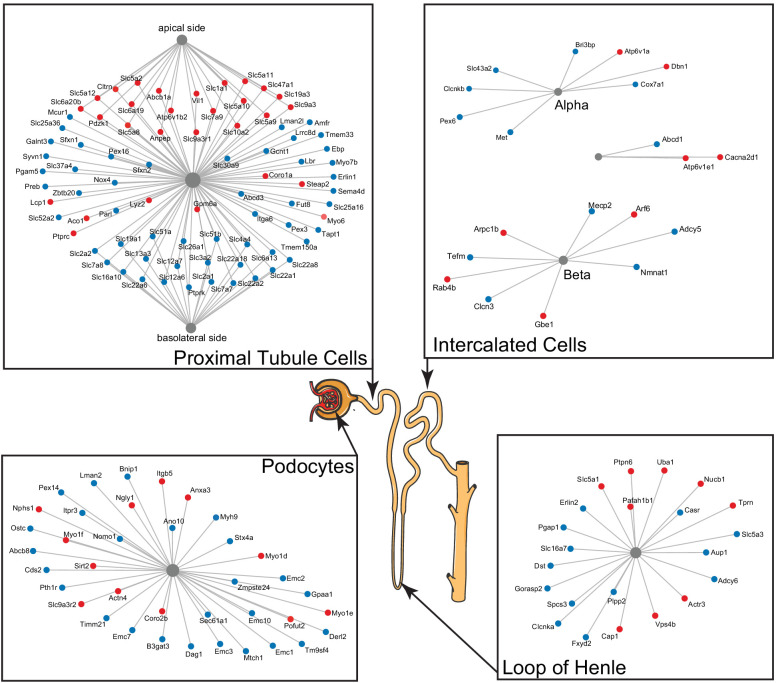
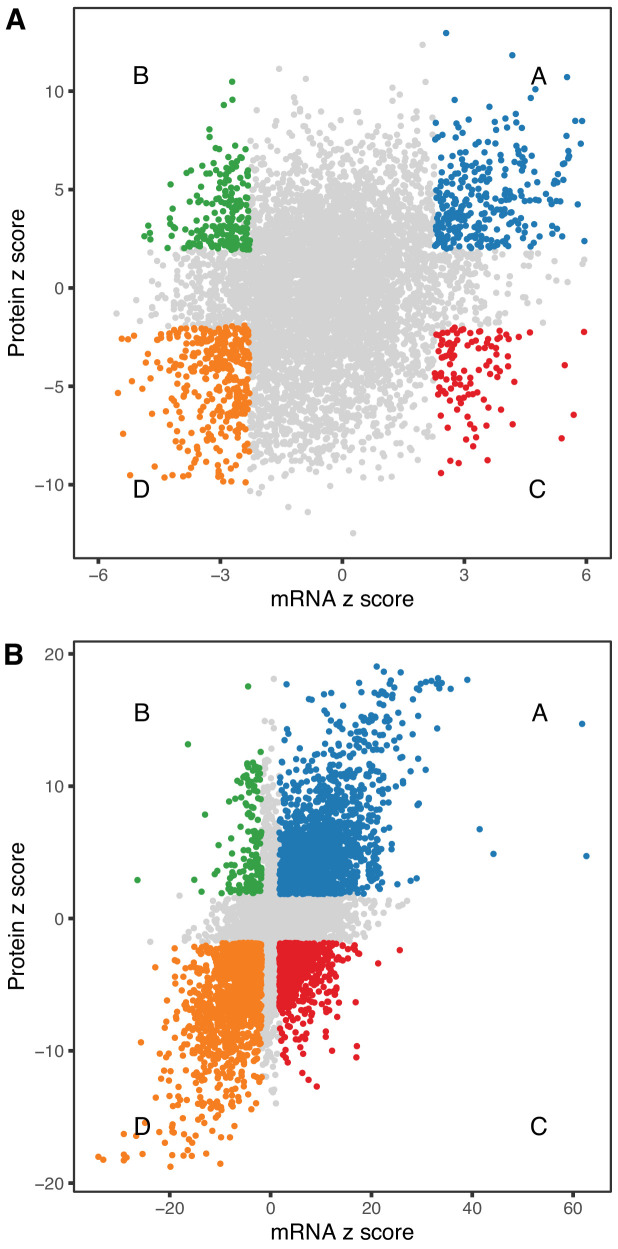
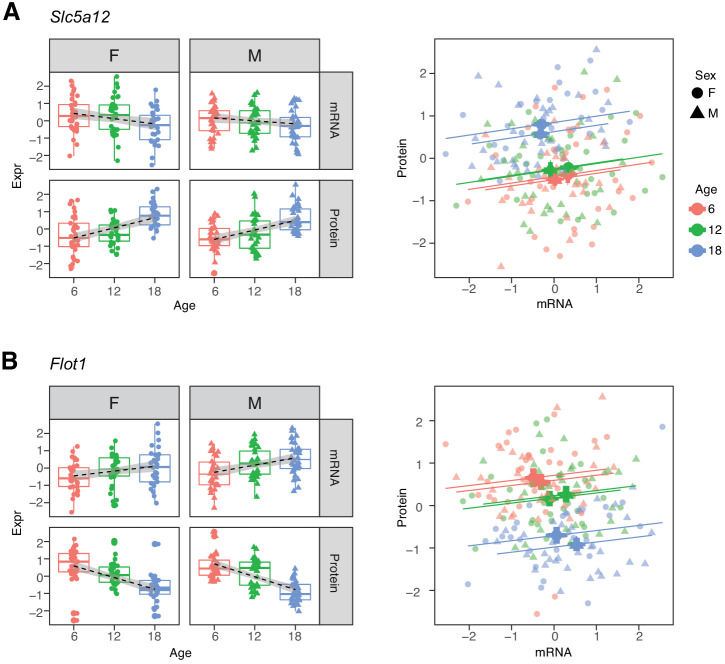
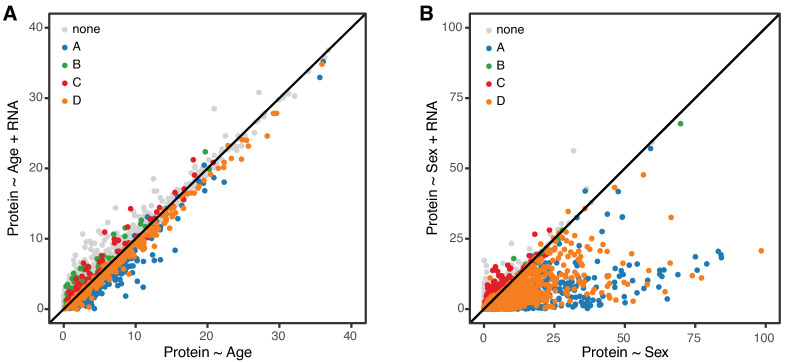
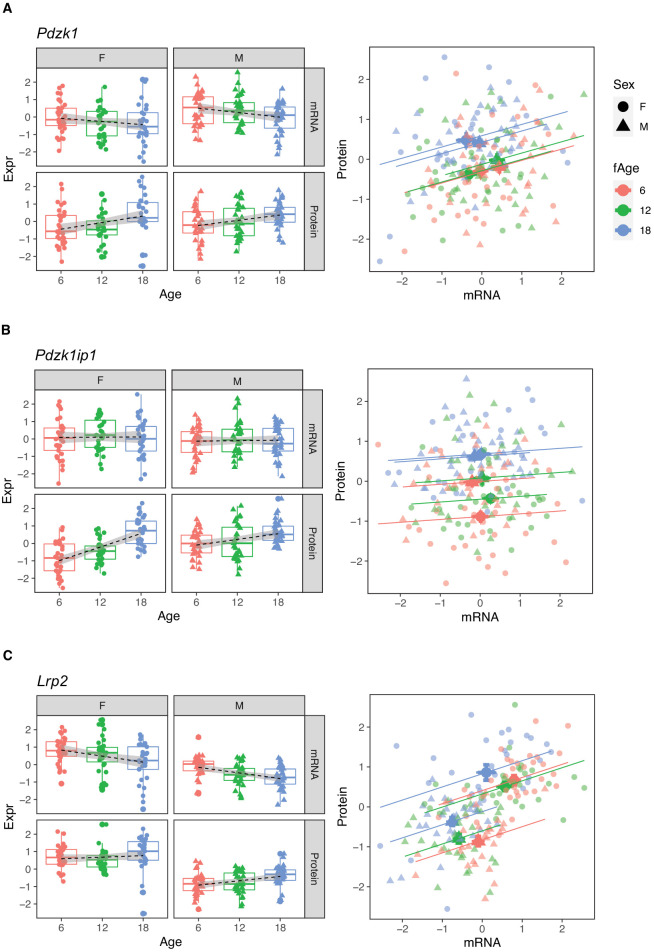
Little is known about the molecular changes that take place in the kidney during the aging process. In order to better understand these changes, we measured mRNA and protein levels in genetically diverse mice at different ages. We observed distinctive change in mRNA and protein levels as a function of age. Changes in both mRNA and protein are associated with increased immune infiltration and decreases in mitochondrial function. Proteins show a greater extent of change and reveal changes in a wide array of biological processes including unique, organ-specific features of aging in kidney. Most importantly, we observed functionally important age-related changes in protein that occur in the absence of corresponding changes in mRNA. Our findings suggest that mRNA profiling alone provides an incomplete picture of molecular aging in the kidney and that examination of changes in proteins is essential to understand aging processes that are not transcriptionally regulated.

Keywords: aging; computational biology; kidney; mRNA; mouse; protein; systems biology.


Conflict of interest statement

YT, JC, IG, DS, OD, SG, GC, RK No competing interests declared

Figures

Figure 1.
Figure 1.. Principal component analysis for females (dots) and males (triangles) at 6 (red), 12 (green), and 18 months (blue) of age.
The top four principal components for (A) RNA expression, with sex as the dominant factor and (B) protein expression, with age as the dominant factor.
Figure 2.
Figure 2.. Analysis of differentially expressed mRNA with age.
(A) Functional enrichment and (B) network analysis, using ClusterProfiler, show overrepresentation of genes involved in immune and inflammatory response and is likely the result of immune cell infiltration into the kidney.
Figure 2—figure supplement 1.
Figure 2—figure supplement 1.. Relative changes in kidney cell composition as a function of age.
Plots show relative cell proportions in kidneys for B lymphocyte and macrophage subsets as depicted in facets. Each point represents a cell proportion inferred for an individual mouse, and violin plots illustrate the density of points along the vertical axis. Lines depict linear regressions fit separately by sex. All elements of the plot are colored according to sex as illustrated in legend at right. Relative cell proportions were inferred from bulk RNA-Seq data using the CellCODE R package as detailed in Materials and methods.
Figure 2—figure supplement 2.
Figure 2—figure supplement 2.. Examples of differential mRNA expression with age.
(A) Increased expression of Cdkn2a, which encodes the senescence marker p16, (B) decreased expression of Hsp90aa1, a heat shock protein, (C) increased expression of Mmp3, a marker of cellular senescence, and (D) increased expression of Lcn2, a marker of proximal tubule damage.
Figure 3.
Figure 3.. Examples of differential protein expression with age.
(A) Decreased expression of HIST1H1B, a histone protein (B) increased expression of ACTA2, a marker of renal fibrosis, (C) decreased expression of NCLN, a part of the endoplasmic reticulum, and (D) decreased expression of CISD2, which is involved in mitochondrial autophagy.
Figure 3—figure supplement 1.
Figure 3—figure supplement 1.. Functional enrichment of differentially expressed proteins and networks.
We evaluated the proteins for functional enrichment of GO categories using ClusterProfiler and observed overrepresentation of genes associated with 186 terms (adjusted p-value < 0.01) representing a wide array of (A) biological processes, (B) cellular compartments, and (C) molecular functions.
Figure 4.
Figure 4.. A subset of differentially expressed proteins with age that are specific for various parts of the nephron, based on single-cell data, show distinct changes with age, such as actin-cytoskeleton rearrangement in podocytes and changes in intercalated cells and the loop of Henle.
Striking are the changes in channels and transporters of the proximal tubular transport, where there is an upregulation at the basolateral side and a downregulation at the apical side.
Figure 5.
Figure 5.. Comparison of age-related changes in mRNA and protein.
We identified 6514 genes with both mRNA and protein data of which 972 had significant differences with age (A) for both mRNA and protein. These can be divided in four groups depending on the direction of change, with decreased RNA and increased protein (green), decreased RNA and decreased protein (orange), increased RNA and increased protein (blue), and increased RNA and decreased protein (red). There is a similar pattern for sex-specific differences, although these are much more likely to be concordant (B). Each point represents a gene with significantly decreased RNA and increased protein (green), decreased RNA and decreased protein (orange), increased RNA and increased protein (blue), and increased RNA and decreased protein (red).
Figure 6.
Figure 6.. Examples of genes with opposite directions of age-related changes between mRNA and protein.
(A) Slc5a12 shows a decrease in mRNA and an increase in protein with age. Within age groups there is a positive correlation between mRNA and protein expression, but comparison between time points. (B) Flot1 shows the opposite with increased mRNA and decreased protein with age. Females (dots) and males (triangles) at 6 (red), 12 (green), and 18 months (blue) of age.
Figure 7.
Figure 7.. Age-related changes in protein expression are not mediated by mRNA expression.
We computed the −log10 p-value from the likelihood ratio test of the age effect on protein in two regression models, without and with mRNA as a predictor. These are displayed on the x- and y-axes of the plot in panel A. If mRNA is a mediator of the age effect on protein, we expect to see reduced significance of the age effect when mRNA is in the regression model. Each point in the figure represents one gene (mRNA and protein) and they are colored coded to show the concordant and discordant change groups as in Figure 4. The points fall close to the identity line, indicating little or no drop in the −log10 p-values, and thus no evidence for mediation. Panel B shows a similar analysis to evaluate whether mRNA is a mediator of the effects of sex on protein. Here the −log10 p-values for most genes are reduced after including mRNA in the regression model, as expected if the effects of sex on protein are mediated through changes in mRNA.
Figure 8.
Figure 8.. Correlation with phosphate and albumin (normalized to creatinine).
(A) PDZK1IP1 is the protein with the highest correlation with urinary phosphate levels and mediation analysis suggests the protein is a mediator for changes in urinary phosphate levels. There are no significant correlations for phosphate with SLC34A1 (B) or SLC34A3 (C) that form the main phosphate transporter in the proximal tubule. (D) Significant correlation between albumin and its proximal tubule receptor Megalin (LRP2). Females (dots) and males (triangles) at 6 (red), 12 (green), and 18 months (blue) of age.
Figure 9.
Figure 9.. Pdzk1 (A), Pdzk1ip1 (B), and Lrp2 (C) are genes with decreased mRNA and increased protein expression with age.
Females (dots) and males (triangles) at 6 (red), 12 (green), and 18 months (blue) of age.

References

    1. Almanzar N, Antony J, Baghel A, Bakerman I, Bansal I, Barres B, Beachy P, Berdnik D, Bilen B, Brownfield D, Cain C, Chan C, Chen M, Clarke M, Conley S, Darmanis S, Demers A, Demir K, Morree A, Divita T, Bois H, Ebadi H, Espinoza F, Fish M. A single-cell transcriptomic atlas characterizes ageing tissues in the mouse. GanNature. 2020;583:590–595. doi: 10.1038/s41586-020-2496-1. - DOI - PMC - PubMed
    1. Anisimova AS, Meerson MB, Gerashchenko MV, Kulakovskiy IV, Dmitriev SE, Gladyshev VN. Multifaceted deregulation of gene expression and protein synthesis with age. PNAS. 2020;117:15581–15590. doi: 10.1073/pnas.2001788117. - DOI - PMC - PubMed
    1. Bolignano D, Lacquaniti A, Coppolino G, Donato V, Campo S, Fazio MR, Nicocia G, Buemi M. Neutrophil Gelatinase-Associated lipocalin (NGAL) and progression of chronic kidney disease. Clinical Journal of the American Society of Nephrology. 2009;4:337–344. doi: 10.2215/CJN.03530708. - DOI - PMC - PubMed
    1. Bolignano D, Mattace-Raso F, Sijbrands EJG, Zoccali C. The aging kidney revisited: a systematic review. Ageing Research Reviews. 2014;14:65–80. doi: 10.1016/j.arr.2014.02.003. - DOI - PubMed
    1. Broman KW, Gatti DM, Svenson KL, Sen Ś, Churchill GA. Cleaning genotype data from diversity outbred mice. G3: Genes, Genomes, Genetics. 2019;9:1571–1579. doi: 10.1534/g3.119.400165. - DOI - PMC - PubMed

Publication types