. 2021 Mar 9:10:e65169.
doi: 10.7554/eLife.65169.

A polarity pathway for exocyst-dependent intracellular tube extension

Affiliations

A polarity pathway for exocyst-dependent intracellular tube extension

Joshua Abrams et al. Elife. .

Abstract

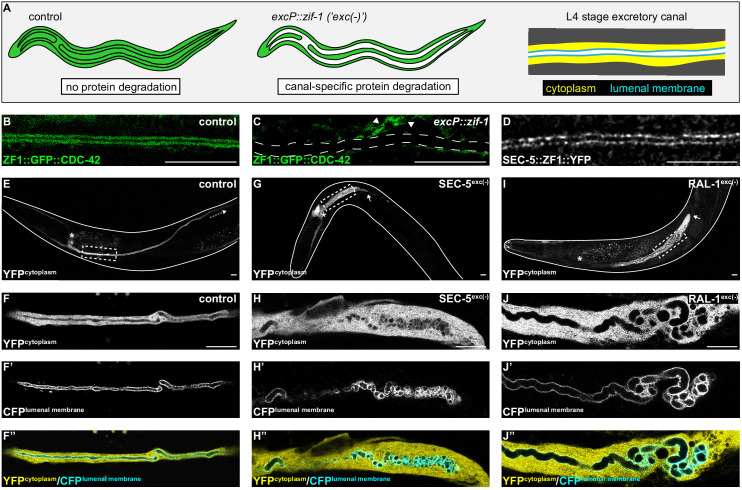
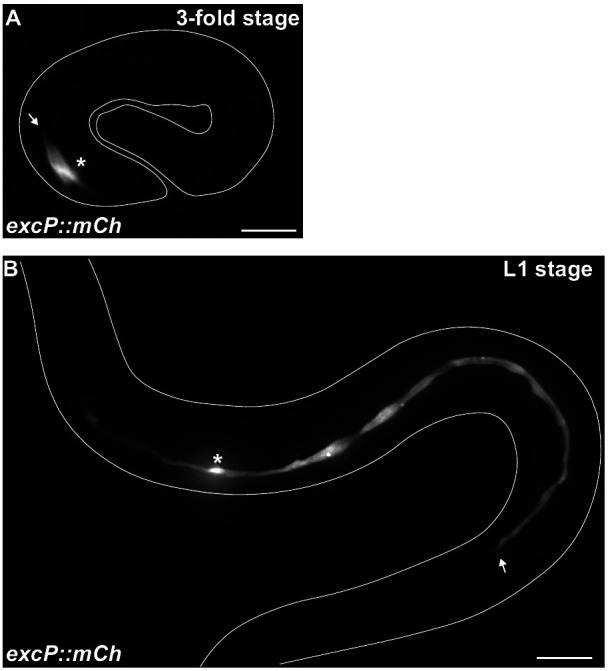
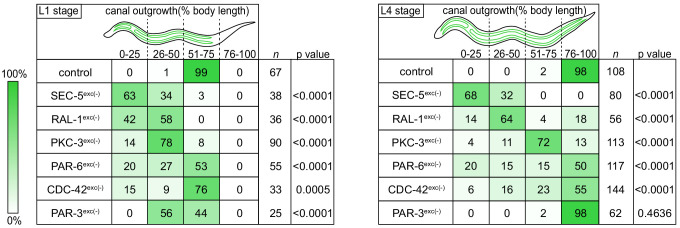
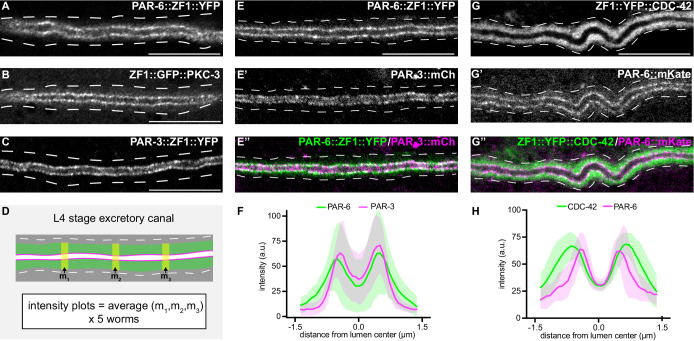
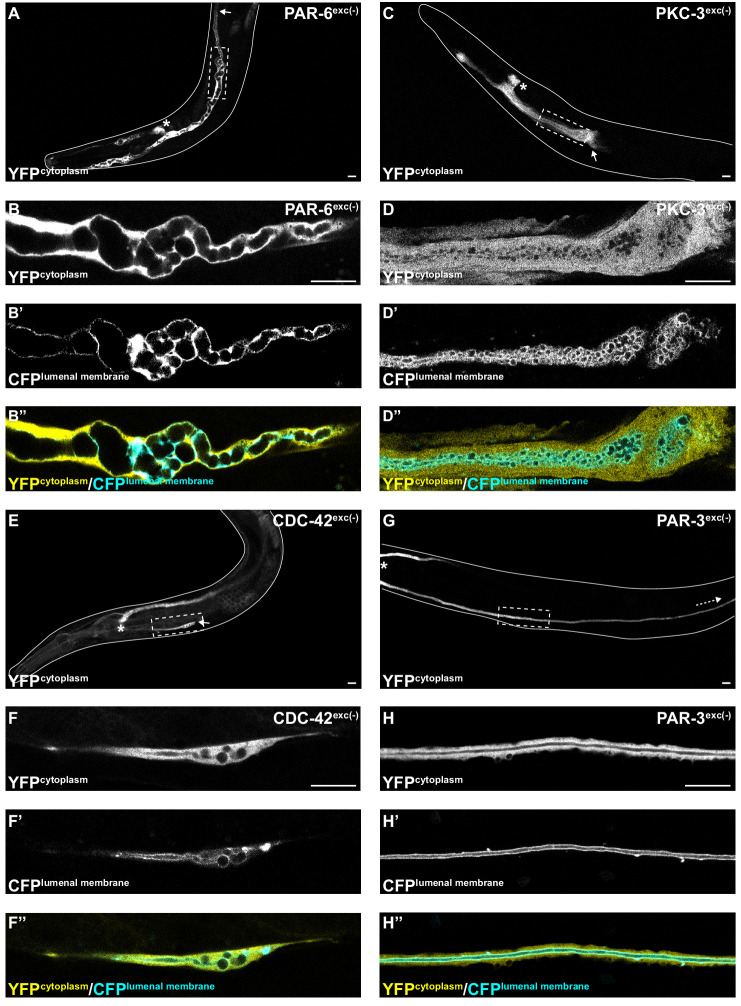
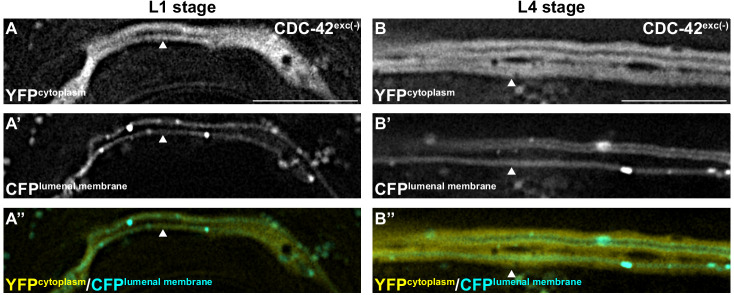
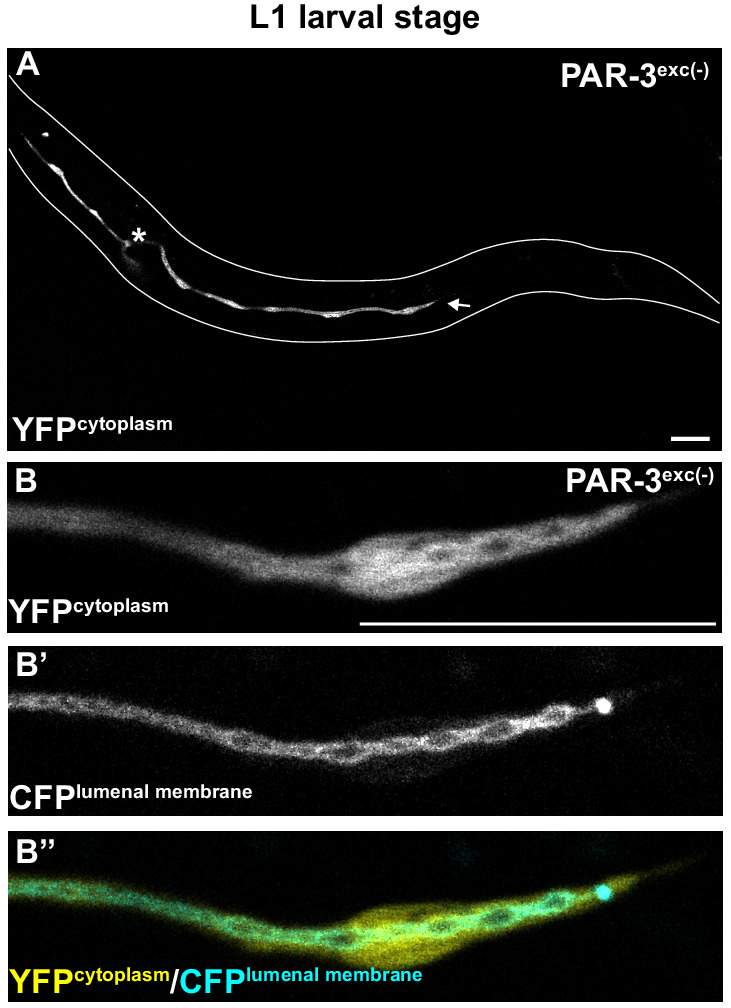
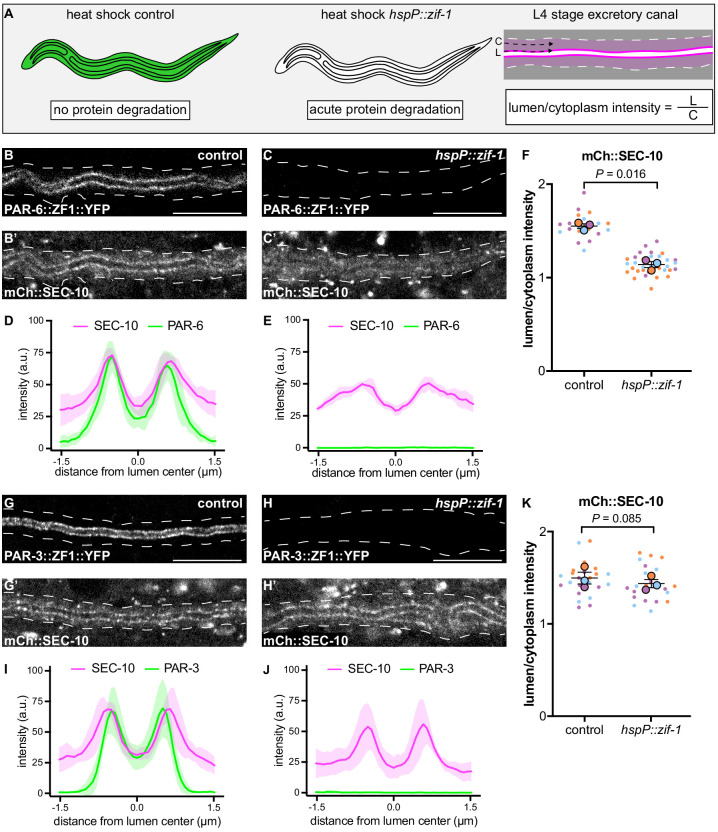
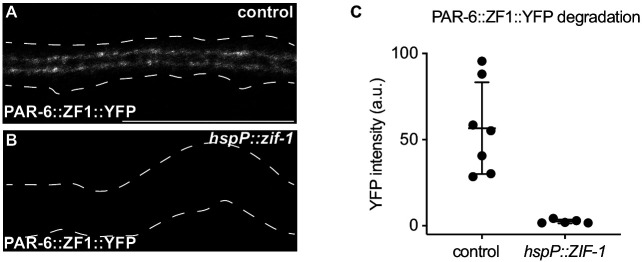
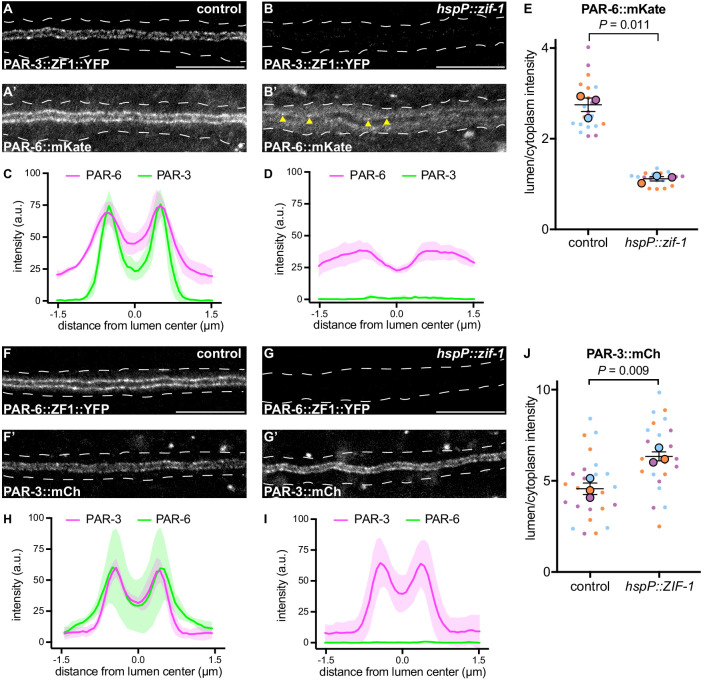
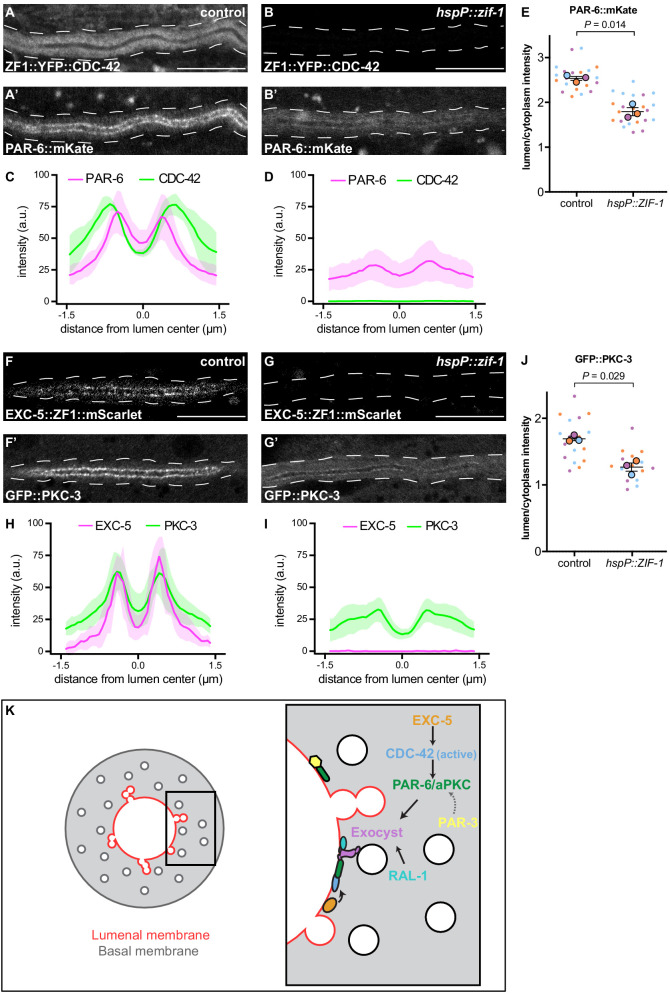
Lumen extension in intracellular tubes can occur when vesicles fuse with an invading apical membrane. Within the Caenorhabditis elegans excretory cell, which forms an intracellular tube, the exocyst vesicle-tethering complex is enriched at the lumenal membrane and is required for its outgrowth, suggesting that exocyst-targeted vesicles extend the lumen. Here, we identify a pathway that promotes intracellular tube extension by enriching the exocyst at the lumenal membrane. We show that PAR-6 and PKC-3/aPKC concentrate at the lumenal membrane and promote lumen extension. Using acute protein depletion, we find that PAR-6 is required for exocyst membrane recruitment, whereas PAR-3, which can recruit the exocyst in mammals, appears dispensable for exocyst localization and lumen extension. Finally, we show that CDC-42 and RhoGEF EXC-5/FGD regulate lumen extension by recruiting PAR-6 and PKC-3 to the lumenal membrane. Our findings reveal a pathway that connects CDC-42, PAR proteins, and the exocyst to extend intracellular tubes.

Keywords: C. elegans; PAR proteins; Rho GTPase; cell biology; developmental biology; exocyst; polarity; tubulogenesis; vesicle trafficking.


Conflict of interest statement

JA, JN No competing interests declared

Figures

Figure 1.
Figure 1.. SEC-5 and RAL-1 are required in the excretory cell for lumen extension.
(A) Schematics of L4 larval stage worms depicting excretory cell-specific protein depletion using excP::zif-1. The H-shaped excretory canal is outlined and a hypothetical ubiquitous ZF1-tagged protein is depicted in green. The typical region of the canal examined by microscopy is enlarged to show cytoplasmic (yellow, excP::YFP) and lumenal membrane (cyan, IFB-1::CFP) markers used for analyzing excretory canal morphology. Anterior left, dorsal top. (B and C) L4 stage excretory canal in transgenic control (B) and excP::zif-1 (C) animals expressing ZF1::GFP::CDC-42. Outline of excretory canal cytoplasm is indicated by dotted line. ZF1::GFP::CDC-42 is degraded in the excretory cell, but not surrounding cells (arrowhead), in excP::zif-1 animals. (D) Endogenous expression of SEC-5::ZF1::YFP at the excretory canal lumenal membrane of L4 stage larva. (E–J’’) Larval excretory canal phenotypes in control (E–F’’), SEC-5exc(-) (G–H’’), and RAL-1exc(-) (I–J’’). Canal cytoplasm and lumenal membrane are marked by an extrachromosomal array expressing excretory cell-specific cytoplasmic and lumenal membrane markers (see panel A). Confocal images were acquired using ×20 (E, G, I) and ×63 objectives (F–F’’, H–H’’, J–J’’). Excretory cell body indicated by asterisk. Posterior tip of excretory canal indicated by white arrow. Posterior excretory canal that has extended beyond the focal plane is indicated by dashed white arrow. Dashed box indicates approximate region represented in high magnification images. Outline of each animal is indicated by solid white line. Scale bars, 10 μm.
Figure 1—figure supplement 1.
Figure 1—figure supplement 1.. t28h11.8p is an excretory cell-specific promoter during embryonic and larval canal outgrowth.
(A) Widefield fluorescence images of t28h11.8p::mCherry (‘excP::mCh’) transcriptional reporter during embryonic elongation. Threefold stage of embryo elongation is shown as this represents the initial stage of posterior canal growth. t28h11.8p::mCherry expression could not be visually detected in any tissues outside of the excretory canal during embryogenesis. (B) t28h11.8p::mCh expression during the L1 larval stage, as canal growth proceeds beyond half of the animal’s body length. Excretory cell body indicated by asterisk. Posterior tip of excretory canal indicated by white arrow. Outline of each animal is indicated by solid white line. A single canal arm is shown in each image with anterior canal extensions visible adjacent to the cell body. Scale bars, 10 μm. ‘Unsharp mask’ filter was applied equally to all images using ImageJ software.
Figure 2.
Figure 2.. Canal outgrowth phenotypes upon exocyst or PAR protein depletion.
Schematics of the excretory cell are shown at the L1 stage, when the canal is extending, and the L4 larval stage, when the canal is fully extended. Canal outgrowth defects upon depleting the indicated proteins in the excretory cell are depicted as the percentage of animals in each of four phenotypic categories (quartiles) that measure posterior canal extension relative to body length. The relative intensity of green shading reflects the percentage of larvae observed in each phenotypic category. p values were calculated using Fisher’s exact test after pooling quartiles and comparing each genotype to the control group (L1 stage:<50% versus>50% canal outgrowth; L4 stage:<75% versus>75% canal outgrowth). p value significance was adjusted using Bonferroni correction to account for multiple comparisons to a common control, such that p≤0.008 is considered statistically significant.
Figure 2—figure supplement 1.
Figure 2—figure supplement 1.. The SEC-5exc(-) canal outgrowth phenotype is not enhanced by a sec-5 null allele.
Canal outgrowth defects upon depleting the indicated proteins in the excretory cell are indicated as the percentage of animals in each of four phenotypic categories that measure posterior canal extension relative to body length at L4 larval stage (see Figure 2). The relative intensity of green shading reflects the percentage of larvae observed in each phenotypic category. The pvalue was calculated using Fisher’s exact test (<50% versus>50% canal outgrowth).
Figure 3.
Figure 3.. PAR-6, PKC-3, and PAR-3 are enriched at the lumenal membrane and CDC-42 extends into the canal cytoplasm.
(A–C) Distribution of endogenously tagged PAR-6, PKC-3, and PAR-3 in the excretory cell canal. (D) Schematic of excretory cell line trace measurements displayed in F and H. Three line-trace measurements (m1, m2, m3) were taken perpendicular to the excretory cell lumen in each animal. Measurements were averaged to generate a single line trace for each larva, and five larvae were measured from each genotype. (E–E’’) Distribution of PAR-6::ZF1::YFP and PAR-3::mCherry in the larval excretory canal. (F) Line traces of PAR-6::ZF1::YFP (green) and PAR-3::mCherry (magenta). Solid line represents mean and shaded area is ± SD. Intensities were normalized to compare peak values of each channel. ‘0.0’ on x-axis represents the center point of the canal lumen. n = 5 larvae. (G–G’’) Distribution of ZF1::YFP::CDC-42 and PAR-6::mKate in the larval excretory canal. (H) Line trace of ZF1::YFP::CDC-42 (green) and PAR-6::mKate (magenta). Solid line represents mean and shaded area is ± SD. Intensities were normalized to compare peak values of each channel. ‘0.0’ on x-axis represents the center point of the canal lumen. n = 5 larvae. Outline of excretory canal cytoplasm is indicated by dashed lines. Scale bars, 10 μm.
Figure 4.
Figure 4.. PAR-6, PKC-3, and CDC-42, but not PAR-3, are required for excretory cell lumen extension.
Larval excretory canal phenotypes in PAR-6exc(-) (A–B’’), PKC-3exc(-) (C–D’’), CDC-42exc(-) (E–F’’) and PAR-3exc(-) (G–H’’) L4 stage worms expressing cytoplasmic and lumenal membrane markers. Confocal images were acquired using ×20 (A, C, E, G) and ×63 (B–B’’, D–D’’, F–F’’, H–H’’) objectives. Excretory cell body indicated by asterisk. Posterior tip of excretory canal indicated by white arrow. Posterior excretory canal that has extended beyond the focal plane is indicated by dashed white arrow. Dashed box indicates approximate region represented in high-magnification images. Outline of each animal is indicated by solid white line. Scale bars, 10 μm.
Figure 4—figure supplement 1.
Figure 4—figure supplement 1.. CDC-42 depletion causes a split lumen phenotype in larval excretory canals.
(A–B’’) Widefield fluorescence images of larval excretory canal phenotypes in CDC-42exc(-) L1 and L4 larval stage worms expressing cytoplasmic and lumenal membrane markers. An additional lumen that has split off of the canal arm is indicated by white arrowhead. Scale bars, 10 μm. ‘Unsharp mask’ filter was applied equally to all images using ImageJ software.
Figure 4—figure supplement 2.
Figure 4—figure supplement 2.. Depletion of PAR-3 causes mild excretory cell lumen defects during early larval stages.
(A–B’’) Larval excretory canal phenotypes in PAR-3exc(-) L1 stage worms expressing cytoplasmic and lumenal membrane markers. Images are of the same animal at different magnifications, ×20 (A) and ×63 (B–B’’). Excretory cell body indicated by asterisk. Posterior tip of excretory canal indicated by white arrow. Outline of animal is indicated by solid white line. Single canal arm is shown in each image with anterior canal extensions visible adjacent to cell body. Scale bars, 10 μm.
Figure 5.
Figure 5.. PAR-6, but not PAR-3, is required to enrich SEC-10 at the lumenal membrane.
(A) Schematic of L4 larval stage worms depicting heat-shock inducible protein depletion. The excretory canal is outlined in black and a hypothetical ubiquitous ZF1-tagged protein is shown in green. Upon heat-shock, the ZF1-tagged protein is rapidly degraded in all somatic cells of animals expressing hspP::zif-1. To measure fluorescence intensity, average pixel intensity was calculated along a region of the excretory cell lumenal membrane (‘L’) and within the cytoplasm (‘C’); dividing L/C yields the lumen/cytoplasm ratio shown in (F and K). Anterior left, dorsal top. (B–C) Distribution of PAR-6::ZF1::YFP in larval excretory canal in control (B) and hspP::zif-1 (C). (B’–C’) Distribution of mCherry::SEC-10 in larval excretory canal of control (B’) and hspP::zif-1 (C’) worms expressing PAR-6::ZF1::YFP. (D–E) Line trace of PAR-6::ZF1::YFP (green) and mCherry::SEC-10 (magenta). Intensities were normalized to compare peak values of each channel. ‘0.0’ on x-axis represents the center point of the canal lumen. n = 5 larvae. (F) Quantification of lumenal membrane to cytoplasm intensity ratio of mCherry::SEC-10 in the excretory canal of control and hspP::zif-1 larvae expressing PAR-6::ZF1::YFP. Individual data points (small dots) are color-coded (orange, purple, and light blue) from three independent replicates. Large dots represent the mean of each replicate, horizontal bar is the mean of means, and error bars are the SEM. p values were calculated using a ratio paired t-test of the means. n = 5, 8, 7 for control; n = 13, 11, 10 for hspP::zif-1. (G–H) Distribution of PAR-3::ZF1::YFP in larval excretory canal in control (G) and hspP::zif-1 (H). (G’–H’) Distribution of mCherry::SEC-10 in the larval excretory canal of control (G’) and hspP::zif-1 (H’) worms expressing PAR-3::ZF1::YFP. (I–J) Line trace of PAR-3::ZF1::YFP (green) and mCherry::SEC-10 (magenta). Intensities were normalized to compare peak values of each channel. ‘0.0’ on x-axis represents the center point of the canal lumen. n = 5 larvae. (K) Quantification of lumenal membrane to cytoplasm intensity ratio of mCherry::SEC-10 expression in the excretory canal of control and hspP::zif-1 larvae expressing PAR-3::ZF1::YFP. Data is shown as in panel F. p values were calculated using a ratio paired t-test of the means. n = 7, 9, 8 for control; n = 7, 8, 8 for hspP::zif-1. Outline of excretory canal cytoplasm is indicated by dashed line. Scale bars, 10 μm.
Figure 5—figure supplement 1.
Figure 5—figure supplement 1.. PAR-6::ZF1::YFP depletion by acute ZIF-1 expression.
(A–B) Distribution of PAR-6::ZF1::YFP in larval excretory canal in control (A) and hspP::zif-1 (B). (C) Quantification of PAR-6::ZF1::YFP intensity in the excretory canal of control and hspP::zif-1 larvae. Individual data points from a single experiment are represented by black dots, horizontal bar is the mean, and error bars are the SEM. Outline of excretory canal cytoplasm is indicated by dotted line. Scale bar, 10 μm.
Figure 6.
Figure 6.. PAR-3 is required to enrich PAR-6 at the lumenal membrane.
(A–B) Distribution of PAR-3::ZF1::YFP in larval excretory canal in control (A) and hspP::zif-1 (B) worms. (A’–B’) Distribution of PAR-6::mKate in the larval excretory canal of control (A’) and hspP::zif-1 (B’) worms expressing PAR-3::ZF1::YFP. Arrowheads show punctate PAR-6::mKate along lumenal membrane. (C–D) Line traces of PAR-3::ZF1::YFP (green) and PAR-6::mKate (magenta). Intensities were normalized to compare peak values of each channel. ‘0.0’ on x-axis represents the center point of the canal lumen. n = 5 larvae. (E) Quantification of lumenal membrane to cytoplasm intensity ratio of PAR-6::mKate expression in the excretory canal of control and hspP::zif-1 larvae expressing PAR-3::ZF1::YFP. Individual data points (small dots) are color-coded (orange, purple, and light blue) from three independent replicates. Large dots represent the mean of each replicate, horizontal bar is the mean of means, and error bars are the SEM. p values were calculated using a ratio paired t-test of the means. n = 6, 6, 8 for control; n = 4, 7, 8 for hspP::zif-1. (F–G) Distribution of PAR-6::ZF1::YFP in larval excretory canal in control (F) and hspP::zif-1 (G) worms. (F’–G’) Distribution of PAR-3::mCherry in larval excretory canal of control (F’) and hspP::zif-1 (G’) worms expressing PAR-6::ZF1::YFP. (H–I) Line traces of PAR-6::ZF1::YFP (green) and PAR-3::mCherry (magenta). Intensities were normalized to compare peak values of each channel. ‘0.0’ on x-axis represents the center point of the canal lumen. n = 5 larvae. (J) Quantification of lumenal membrane to cytoplasm intensity ratio of PAR-3::mCherry expression in the excretory canal of control and hspP::zif-1 larvae expressing PAR-6::ZF1::YFP. Data depicted as in panel E. p values were calculated using a ratio paired t-test of the means. n = 9, 8, 9 for control; n = 7, 8, 9 for hspP::zif-1. Outline of excretory canal cytoplasm is indicated by dotted line. Scale bars, 10 μm.
Figure 7.
Figure 7.. CDC-42 and EXC-5 are required to enrich PAR-6 and PKC-3 at the lumenal membrane.
(A–B) Distribution of ZF1::YFP::CDC-42 in larval excretory canal in control (A) and hspP::zif-1 (B) worms. (A’–B’) Distribution of PAR-6::mKate in the larval excretory canal of control (A’) and hspP::zif-1 (B’) worms expressing ZF1::YFP::CDC-42. (C–D) Line trace of ZF1::YFP::CDC-42 (green) and PAR-6::mKate (magenta). Intensities were normalized to compare peak values of each channel. ‘0.0’ on x-axis represents the center point of the canal lumen. n = 5 larvae. (E) Quantification of lumenal membrane to cytoplasm intensity ratio of PAR-6::mKate expression in the excretory canal of control and hspP::zif-1 larvae expressing ZF1::YFP::CDC-42. Individual data points (small dots) are color-coded (orange, purple, and light blue) from three independent replicates. Large dots represent the mean of each replicate, horizontal bar is the mean of means, and error bars are the SEM. p values were calculated using a ratio paired t-test of the means. n = 8, 7, 7 for control; n = 9, 7, 8 for hspP::zif-1. (F–G) Distribution of EXC-5::ZF1::mScarlet in the larval excretory canal in control (F) and hspP::zif-1 (G) worms. (F’–G’) Distribution of GFP::PKC-3 in the larval excretory canal of control (F’) and hspP::zif-1 (G’) worms expressing EXC-5::ZF1::mScarlet. (H–I) Line trace of GFP::PKC-3 (green) and EXC-5::ZF1::mScarlet (magenta). Intensities were normalized to compare peak values of each channel. ‘0.0’ on x-axis represents the center point of the canal lumen. n = 5 larvae. (J) Quantification of lumenal membrane to cytoplasm intensity ratio of GFP::PKC-3 expression in the excretory canal of control and hspP::zif-1 larvae expressing EXC-5::ZF1::mScarlet. Data are depicted as in panel E. p values were calculated using a ratio paired t-test of the means. n = 5, 6, 6 for control; n = 5, 5, 6 for hspP::zif-1. (K) Model of PAR and exocyst regulation of excretory cell lumen extension. Cross section of larval excretory canal (left) depicts large, canalicular vesicles fusing with the lumenal membrane (red) during lumen extension. Boxed region represents a portion of canal where lumen extension is occurring, magnified at right to show a proposed molecular pathway for lumenal vesicle tethering. Outline of excretory canal cytoplasm is indicated by dotted line. Scale bars, 10 μm.

References

    1. Aceto D, Beers M, Kemphues KJ. Interaction of PAR-6 with CDC-42 is required for maintenance but not establishment of PAR asymmetry in C. elegans. Developmental Biology. 2006;299:386–397. doi: 10.1016/j.ydbio.2006.08.002. - DOI - PMC - PubMed
    1. Achilleos A, Wehman AM, Nance J. PAR-3 mediates the initial clustering and apical localization of junction and polarity proteins during C. elegans intestinal epithelial cell polarization. Development. 2010;137:1833–1842. doi: 10.1242/dev.047647. - DOI - PMC - PubMed
    1. Ahmed SM, Nishida-Fukuda H, Li Y, McDonald WH, Gradinaru CC, Macara IG. Exocyst dynamics during vesicle tethering and fusion. Nature Communications. 2018;9:5140. doi: 10.1038/s41467-018-07467-5. - DOI - PMC - PubMed
    1. Ahmed SM, Macara IG. The Par3 polarity protein is an exocyst receptor essential for mammary cell survival. Nature Communications. 2017;8:14867. doi: 10.1038/ncomms14867. - DOI - PMC - PubMed
    1. Armenti ST, Chan E, Nance J. Polarized exocyst-mediated vesicle fusion directs intracellular lumenogenesis within the C. elegans excretory cell. Developmental Biology. 2014a;394:110–121. doi: 10.1016/j.ydbio.2014.07.019. - DOI - PMC - PubMed

Publication types

MeSH terms