. 2021 May;384(2):465-486.
doi: 10.1007/s00441-021-03422-x. Epub 2021 Mar 9.

Organic dust-induced mitochondrial dysfunction could be targeted via cGAS-STING or cytoplasmic NOX-2 inhibition using microglial cells and brain slice culture models

Affiliations

Organic dust-induced mitochondrial dysfunction could be targeted via cGAS-STING or cytoplasmic NOX-2 inhibition using microglial cells and brain slice culture models

Nyzil Massey et al. Cell Tissue Res. 2021 May.

Abstract

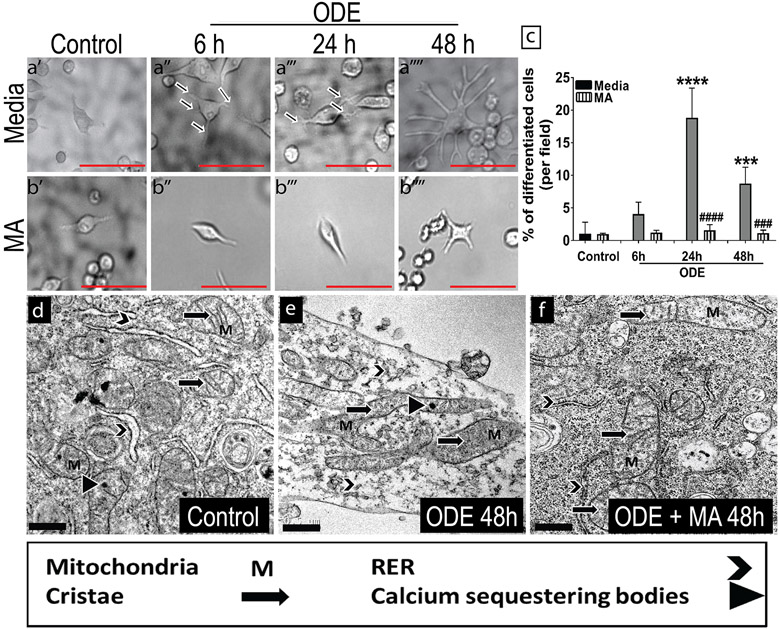
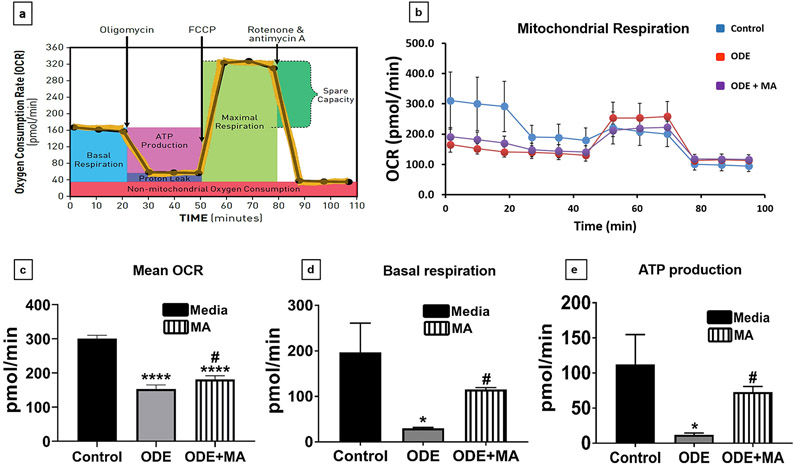
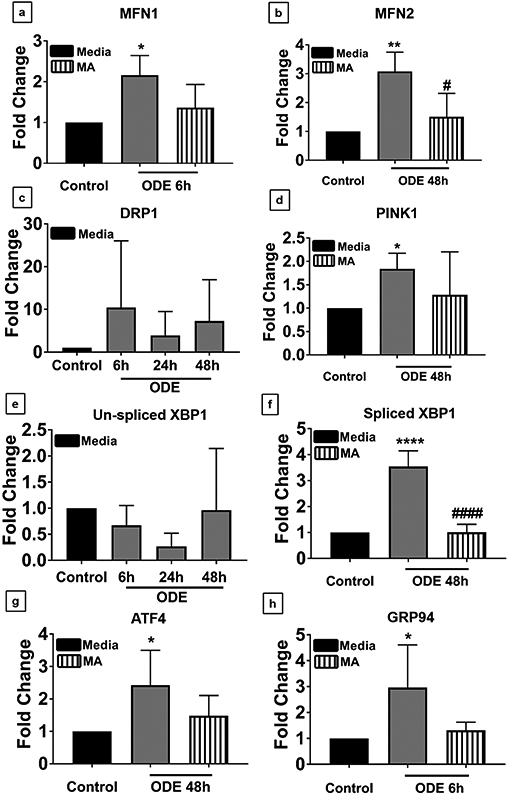
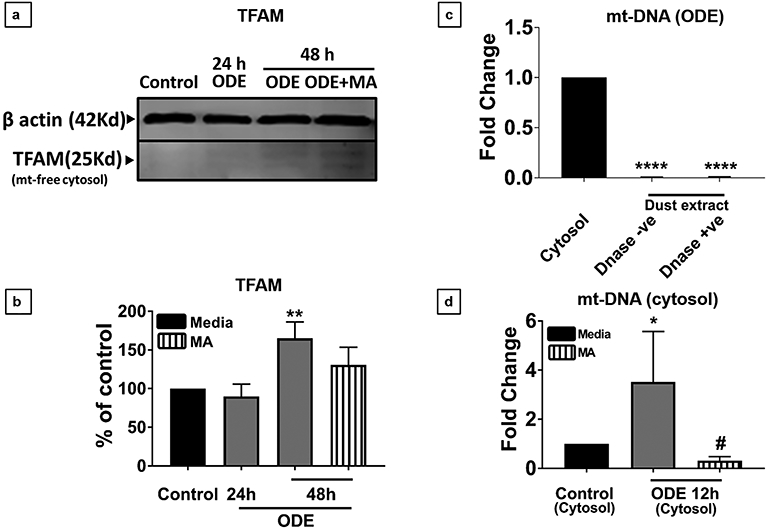
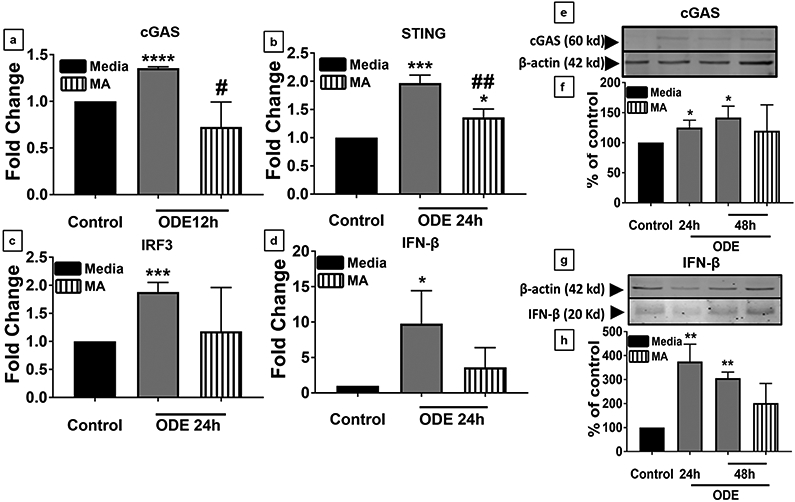
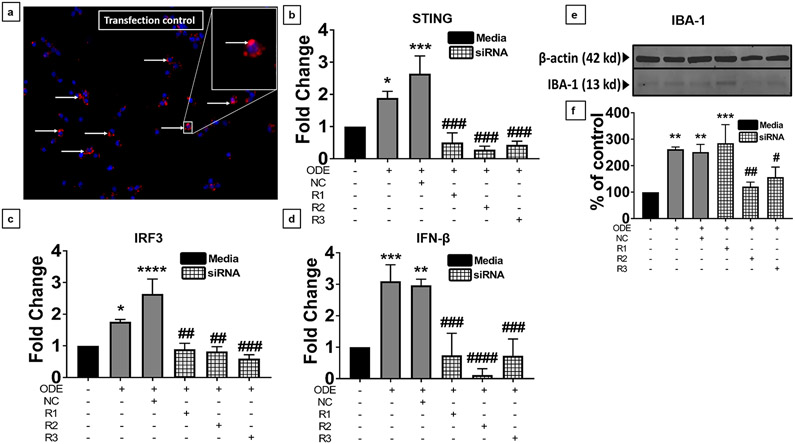
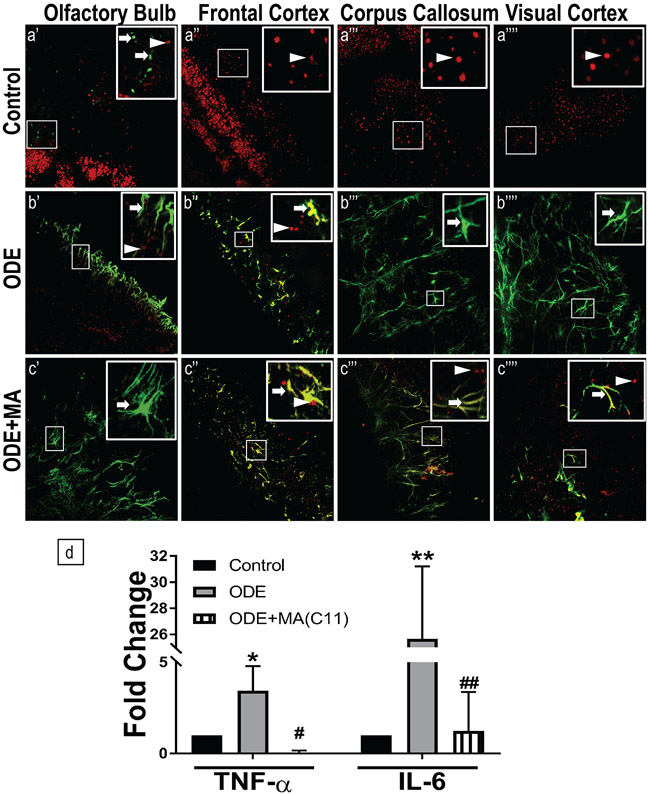
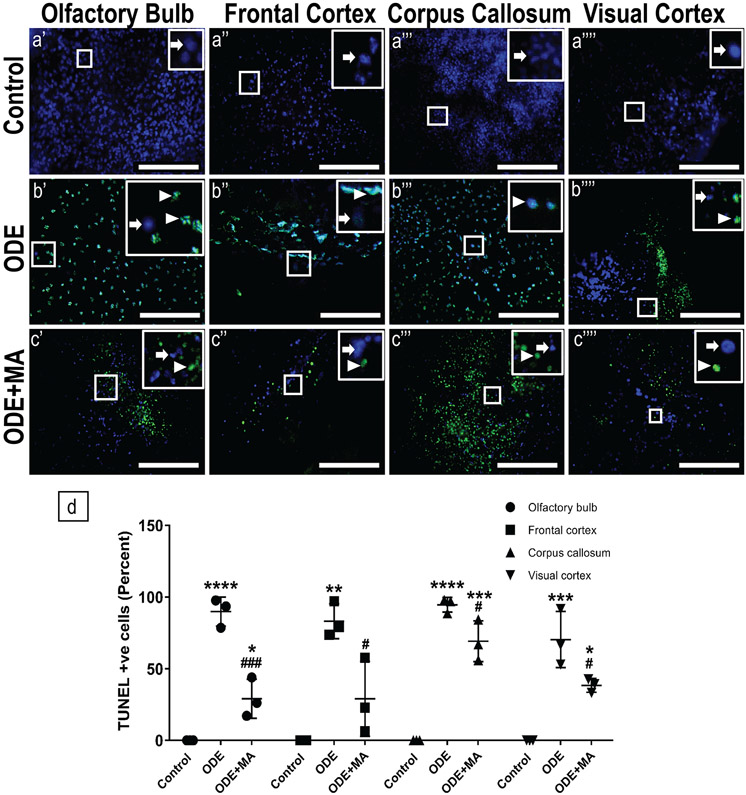
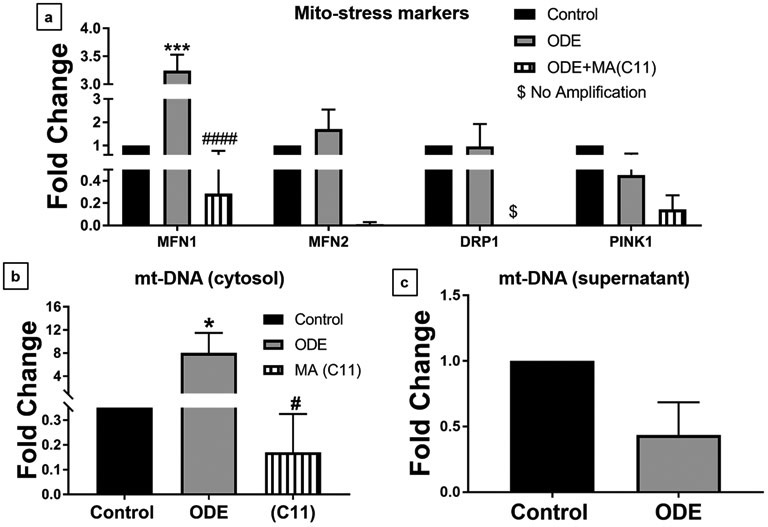
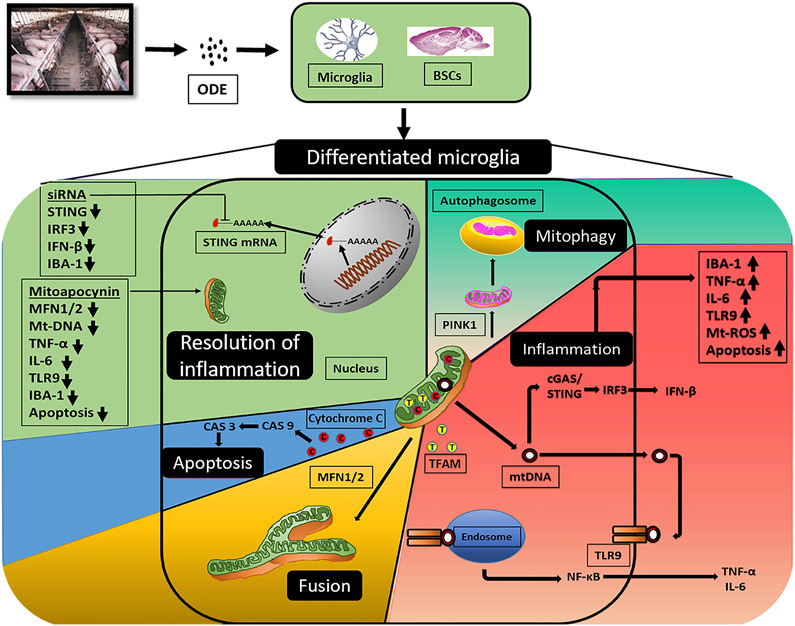
Organic dust (OD) exposure in animal production industries poses serious respiratory and other health risks. OD consisting of microbial products and particulate matter and OD exposure-induced respiratory inflammation are under investigation. However, the effect of OD exposure on brain remains elusive. We show that OD exposure of microglial cells induces an inflammatory phenotype with the release of mitochondrial DNA (mt-DNA). Therefore, we tested a hypothesis that OD exposure-induced secreted mt-DNA signaling drives the inflammation. A mouse microglial cell line was treated with medium or organic dust extract (ODE, 1% v/v) along with either phosphate-buffered saline (PBS) or mitoapocynin (MA, 10 µmol). Microglia treated with control or anti-STING siRNA were exposed to medium or ODE. Mouse organotypic brain slice cultures (BSCs) were exposed to medium or ODE with or without MA. Various samples were processed to quantify mitochondrial reactive oxygen species (mt-ROS), mt-DNA, cytochrome c, TFAM, mitochondrial stress markers and mt-DNA-induced signaling via cGAS-STING and TLR9. Data were analyzed and a p value of ≤ 0.05 was considered significant. MA treatment decreased the ODE-induced mt-DNA release into the cytosol. ODE increased MFN1/2 and PINK1 but not DRP1 and MA treatment decreased the MFN2 expression. MA treatment decreased the ODE exposure-induced mt-DNA signaling via cGAS-STING and TLR9. Anti-STING siRNA decreased the ODE-induced increase in IRF3, IFN-β and IBA-1 expression. In BSCs, MA treatment decreased the ODE-induced TNF-α, IL-6 and MFN1. Therefore, OD exposure-induced mt-DNA signaling was curtailed through cytoplasmic NOX-2 inhibition or STING suppression to reduce brain microglial inflammatory response.

Keywords: Inflammation; Microglia; Mitochondrial DNA; Organic dust; cGAS-STING.


Conflict of interest statement

Conflicts of interest/Competing interests

AGK has an equity interest in PK Biosciences Corporation located in Ames, IA.

The terms of this arrangement have been reviewed and approved by Iowa State University per its conflict of interest policies. All other authors have declared no potential conflicts of interest.

Figures

Fig 1.
Fig 1.. MA reduces ODE induced morphological and ultrastructural changes in Microglia.
Microglia were exposed to media or ODE and co-treated with either vehicle or MA. Morphological signs of differentiation such as an increase in size and change in shape (amoeboid body with thick and longer processes) were observed, and percent of differentiated microglia/microscopic field was calculated manually at 6, 24, and 48 h (supplementary data, Fig. 1). Compared to controls, ODE treated microglia appeared to increase in size with a round center and thick amoeboid processes (arrows) (a’-a’’’’). MA (cytoplasmic NOX-2 inhibitor) successfully reduced ODE-induced changes in microglia (micrometer bar= 50 μm) (b’-b’’’’). The number of microglia was manually counted in five randomly chosen fields, and percent differentiated cells was calculated. Compared to controls, ODE significantly induced morphological signs of differentiation at 24 and 48 h. MA treatment successfully reduced ODE-induced microglial differentiation at 24 and 48 h (c). Microglia were exposed to media or ODE with or without MA and processed for transmission electron microscopy (TEM). Control cells showed mitochondria with normal cristae, electron-dense calcium sequestration bodies, and rough endoplasmic reticulum (RER) (d). Following ODE exposure, mitochondria were hypertrophic with cristolysis, contained larger calcium sequestration bodies, and fragmented RER (e). Compared to vehicle treatment, MA-treatment reduced ODE-induced mitochondrial hypertrophy, cristolysis, larger electron-dense calcium sequestration bodies, and fragmentation of RER at 48 h (f, micrometer bar = 0.5 μm). (n=4, * exposure effect, P < 0.05).
Fig 2.
Fig 2.. MA reduces ODE induced mitochondrial dysfunction.
Cells were exposed to media and ODE with or without MA and processed for seahorse assay to measure the mitochondrial bioenergetics. Standard mitochondrial stressors (oligomycin 1 μg/mL, FCCP 1 μmol, and antimycin A 10 μmol) were used, and mitochondrial bioenergetics was measured. The chart represents the whole timeline or an overview of the sea horse assay. It depicts when the injections were administered at a particular time after the start of the experiment. It also shows the different phases of respiration during the seahorse assay (a). Time-lapse visualization of change in mitochondrial respiration of microglia exposed to media or ODE and co-treated with either vehicle or MA upon treatment with mitochondrial stressors (b). Compared to control, ODE treated cells showed a decrease in mean oxygen consumption rate (OCR), basal respiration, and ATP production in mitochondria. MA treatment significantly increased the mean OCR, basal respiration, and ATP production of mitochondria when compared to ODE group (c-e), (n=4, * exposure effect, # MA treatment effect, P < 0.05).
Fig 3.
Fig 3.. ODE induces increased expression of mitochondrial and endoplasmic reticulum stress genes.
Cells were exposed to media or ODE and co-treated with either vehicle or MA and processed for qRT-PCR analysis. Compared to control, ODE exposed cells showed increased expression of MFN1 at 6 h, and MA treatment had no effect (a). Compared to control, ODE exposed cells showed increased expression of MFN2 at 6 h (data not shown), 24 h (data not shown), and 48 h following ODE treatment. MA significantly reduced MFN2 expression at 6h (data not shown) and 48 h (b). DRP1 expression did not change between control and any of the treatment groups (c). Compared to control, ODE exposed cells showed increased expression of PINK1 at 48 h, and MA treatment had no effect (d). Un-spliced XBP1 expression did not change between control and any of the treatment groups (e). Compared to control, ODE exposed cells showed increased expression of spliced XBP1 gene at 24 (data not shown) and 48 h. MA significantly reduced the expression of spliced XB1 at 48 h (f). Compared to controls, ODE exposed cells showed increased ATF4 gene expression at 6 h (data not shown) and 48 h. MA treatment did not affect ATF4 expression (g). Compared to controls, ODE exposed cells showed increased GRP94 gene expression at 6 h. MA treatment did not affect (h). (n=3 in duplicates * exposure effect, # MA treatment effect, P < 0.05).
Fig 4.
Fig 4.. ODE induces the release of TFAM and mitochondrial DNA into the cytosol of microglia.
Cells were exposed to media or ODE with or without MA and processed for Western blot analysis. Normalized (β-actin, loading control) bands of TFAM were processed for densitometry (ImageJ, NIH), and statistical analysis was performed. Compared to controls, ODE exposure significantly increased the TFAM levels at 48 h, and MA treatment had no effect (a-b). Mitochondria-free cellular cytosolic fraction and ODE treated with (negative control) or without DNase were processed for DNA extraction. mt-DNA specific primers were used for qRT-PCR analysis. ODE samples treated with and without DNase confirmed that there was no background mitochondrial DNA in the ODE samples (c). Microglia treated with medium, ODE with or without mitoapocynin (C2) were processed to extract mitochondria-free cytosolic fraction, and mt-DNA content was quantified using qRT-PCR. ODE treated microglia contained significantly higher amounts of mt-DNA in the mitochondria free cytosolic fraction at 12 h, and MA treatment significantly reduced the ODE induced mt-DNA release (d). (n=4, * exposure effect, # MA treatment effect and p < 0.05).
Fig 5.
Fig 5.. ODE exposure upregulates cGAS, STING, IRF3, and IFN-β expression in microglia.
Microglia were exposed to media or ODE (12 h, 24 h, and 48 h) and co-treated with either vehicle or MA (48 h) and processed to quantify mRNA (a-d) or protein levels (e-h). cGAS, STING, IRF3, and IFN-β specific primers were used to quantify mRNA (2−ΔΔCt method) and compared to controls, cGAS (12 h), STING (24 h), IRF3 (24 h) and IFN-β (24 h) mRNA levels increased. In contrast, MA treatment significantly decreased cGAS and STING expression and did not change the IRF3 (c) and IFN-β (c) mRNA levels. cGAS (e), IFN-β (g) and β-actin antibodies (house-keeping protein) detected 60 kD, 20 kD, and 42 kD bands, respectively. Densitometry of normalized bands showed that, compared to controls, ODE exposure increased the cGAS (f) and IFN-β (h) levels at 24 and 48 h, and MA treatment had no effect (n=3, * exposure effect, # MA treatment effect, P < 0.05).
Fig 6.
Fig 6.. STING knockout with siRNA downregulates STING, IRF3, IFN-β, and IBA1 expression.
Microglia were treated with DsiRNAs TYE 563 (transfection control, Cy3) or anti-STING siRNAs (R1, R2, R3) A scrambled siRNA was also used as a negative control (NC). Following treatment, cells were either fixed with paraformaldehyde (a) or processed for qRT-PCR analysis (b-d) or processed for western blot analysis (e-f). After 24 h, immunofluorescence (cy3, red) shows a successful transfection (white arrows and inset) (a) in the cytoplasm of microglia, and the nucleus is stained with DAPI (blue). Following qRT-PCR analysis, R1 (10 nmol), R2 (10 nmol), and R3 (10 nmol) significantly reduced the mRNA expression of STING (b), IRF-3 (c), and IFN-β (d) mRNAs at 24 h. Following the siRNA-mediated knockdown of STING mRNA, IBA-1 and β-actin (house-keeping protein) were detected in ODE treated (24 h) microglia at 13 kD and 42 kD bands, respectively (e). Normalized densitometry values show that, compared to ODE treated cells either with or without negative control siRNA (NC), anti-STING siRNA treatment (R2 and R3) reduced the IBA 1 protein levels at 24 h (f). (n=4, * exposure effect, # siRNA treatment effect, P < 0.05).
Fig 7.
Fig 7.. Organic dust extract (ODE)-exposure induces microglial activation and pro-inflammatory cytokines gene expression in organotypic brain slice culture (BSCs).
BSCs were exposed to media (control) or ODE (5 days) followed by either vehicle or MA(C11) treatment and were stained with anti-NeuN (arrow head; neuronal marker; Cy3, red), anti-Iba1 (arrow; microglial activation marker; FITC, green) antibodies (a-c) or processed for qRT-PCR analysis (d). Compared to control (a), ODE-exposed BSCs showed higher amounts of Iba-1 staining in the olfactory bulb, frontal cortex, corpus callosum, and visual cortex of the brain (b). MA(C11) treatment had no effect on ODE induced microglial activation (c). Compared to medium, ODE-exposed BSCs showed an upregulation of TNF-α and IL-6 gene expression. MA(C11) treatment decreased the gene expression of TNF-α and IL-6 (d). (n=3, * exposure effect, # MA(C11) treatment effect, P < 0.05, micrometer bar = 100 μm).
Fig 8.
Fig 8.. Organic dust extract (ODE)-exposure induces neurodegeneration in BSCs.
BSCs were exposed to media (control) or ODE (5 days) and co-treated with either vehicle or MA (C11). BSCs were labeled with dUTP-FITC (arrow head; apoptosis marker, FITC, green), and nucleus stained with DAPI (arrow; blue) (a-c). The total number of cells (DAPI, blue) and TUNEL positive cells (FITC, green) per field (20X) were counted in a total of five random fields. Compared to control, ODE-exposed BSCs showed a higher number of TUNEL positive cells in the olfactory bulb, frontal cortex, corpus callosum and visual cortex of the brain. MA(C11) significantly reduced the number of TUNEL positive cells in the olfactory bulb, frontal cortex, corpus callosum and visual cortex (d). (n=3, * exposure effect, # MA(C11) treatment effect, P < 0.05, micrometer bar = 100 μm).
Figure 9.
Figure 9.. ODE exposure of organotypic brain slice culture activates mitochondrial stress response and induces the release of mt-DNA into the cytosol.
BSCs were exposed to media or ODE (5 days) and co-treated with either vehicle or MA(C11). DNA extracted from the whole cell (a), mt-free cell cytosol (b), and supernatant (c) was processed for mt-DNA specific qRT-PCR analysis. Compared to medium, ODE-exposed brain slices showed an upregulation of MFN1 but not MFN2, DRP1, and PINK1. MA(C11) significantly decreased the MFN1 expression (a). Compared to control (vehicle), ODE induced a significant increase in the cytosolic mt-DNA fraction in BSCs. MA(C11) treatment significantly reduced cytosolic mt-DNA release in the cytosol (b). ODE exposed BSCs did not show any significant rise in mitochondrial DNA in supernatant (secreted) at 5 days post-treatment (c) (n=3, * exposure effect, # MA(C11) treatment effect, P < 0.05).
Figure 10.
Figure 10.. An overview of ODE exposure induced mitochondrial dysfunction in microglia and BSCs.
Mitochondria is a vital organelle of the cell involved in the maintenance and survival of the cell. Thus, ODE induced mitochondrial damage can have different consequences simultaneously. 1) Cytochrome c is a respiratory chain protein loosely associated with the inner membrane of mitochondria. ODE exposure induced mitochondrial damage will result in the release of Cytochrome c into the cellular cytosol and initiation of apoptotic changes inside the cell through activation of Caspase 3 and Caspase 9. 2) Mitochondrial fusion (MFN1/2 mediated) is a form of stress response and is a mechanism for coping with the altered cellular homeostasis. 3) TFAM is a mitochondrial DNA binding protein that aids in the transcription of the mitochondria genome. Damage to mitochondria renders TFAM and mt-DNA vulnerable for release into the cellular cytosol. When in the cytosol, mt-DNA can potentiate an inflammation response through TLR9-NFκB signaling resulting in pro-inflammatory cytokine release or mt-DNA can be sensed by cGAS-STING pathway, ultimately leading to IFN-β production. 4) PINK1 mediated mitophagy is a response often seen in damaged or stressed mitochondria to contain the inflammation. During mitophagy, mitochondria undergo selective degradation to maintain cellular homeostasis. 5) Finally, by targeting mitochondria and preventing it from experiencing damage or stress can help alleviate the inflammation. Use of MA (C2 or C11) reduced mitochondrial fusion, prevented mt-DNA release, downregulated pro-inflammatory cytokines as well as prevented microglial activation and cellular apoptosis. Selective STING DsiRNA knockdown also helped in reducing microglial activation. Both MA (C2 or C211) and STING knockdown downregulated the ODE induced inflammatory and apoptotic markers and promoted the resolution of inflammation.

Similar articles

Cited by

References

    1. American Thoracic Society (1998) Respiratory health hazards in agriculture. Am J Respir Crit Care Med, vol 158, pp S1–S76 - PubMed
    1. Anantharam V, Kaul S, Song C, Kanthasamy A, Kanthasamy AG (2007) Pharmacological inhibition of neuronal NADPH oxidase protects against 1-methyl-4-phenylpyridinium (MPP+)-induced oxidative stress and apoptosis in mesencephalic dopaminergic neuronal cells. Neurotoxicology 28:988–997 - PMC - PubMed
    1. Area-Gomez E, Guardia-Laguarta C, Schon EA, Przedborski S (2019) Mitochondria, OxPhos, and neurodegeneration: cells are not just running out of gas. The Journal of Clinical Investigation 129:34–45 - PMC - PubMed
    1. Bhat SM, Massey N, Karriker LA, Singh B, Charavaryamath C (2019) Ethyl pyruvate reduces organic dust-induced airway inflammation by targeting HMGB1-RAGE signaling. Respir Res 20:27. - PMC - PubMed
    1. Block ML, Zecca L, Hong JS (2007) Microglia-mediated neurotoxicity: uncovering the molecular mechanisms. Nat Rev Neurosci 8: - PubMed