. 2021 Apr;31(4):592-606.
doi: 10.1101/gr.261032.120. Epub 2021 Mar 9.

Genomic analyses provide insights into peach local adaptation and responses to climate change

Affiliations

Genomic analyses provide insights into peach local adaptation and responses to climate change

Yong Li et al. Genome Res. 2021 Apr.

Abstract

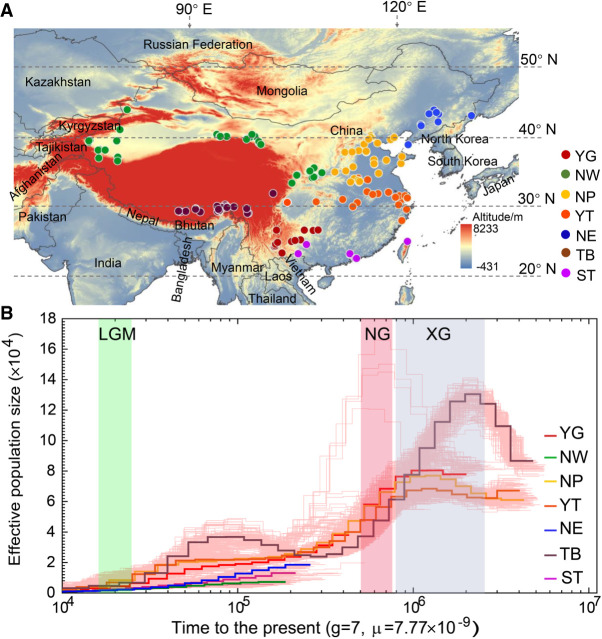
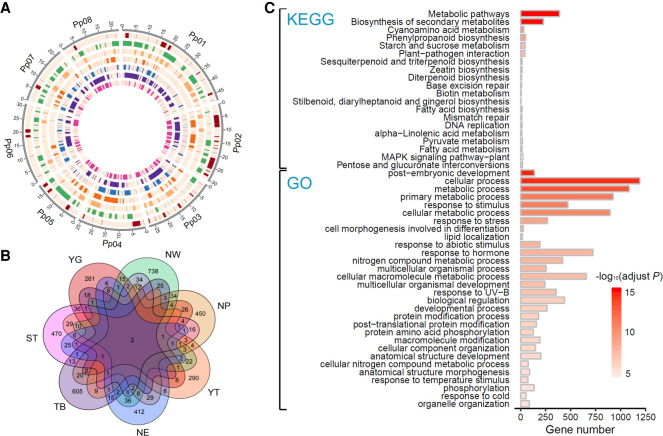
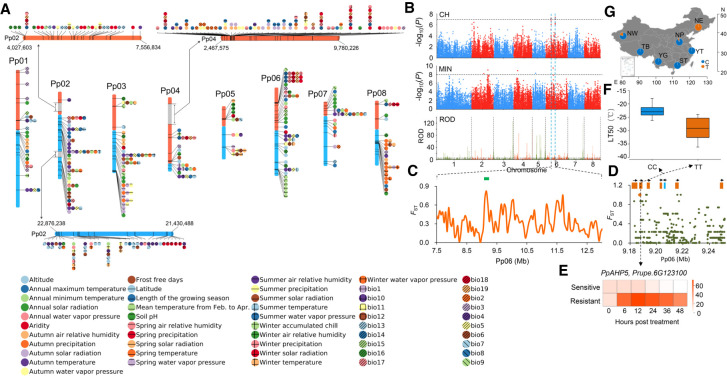
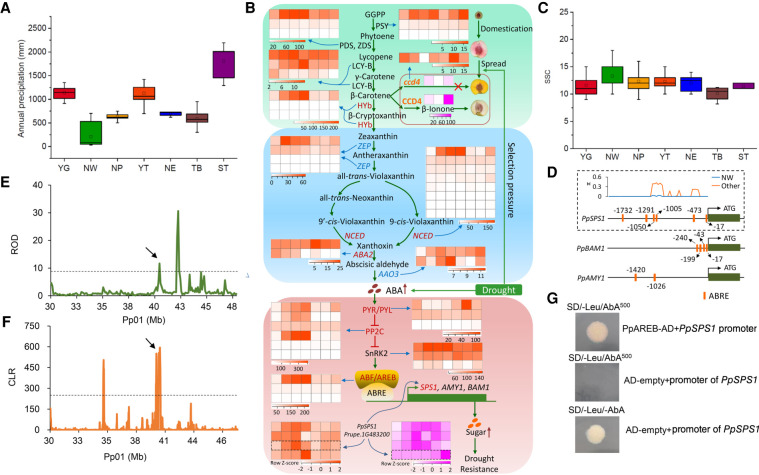
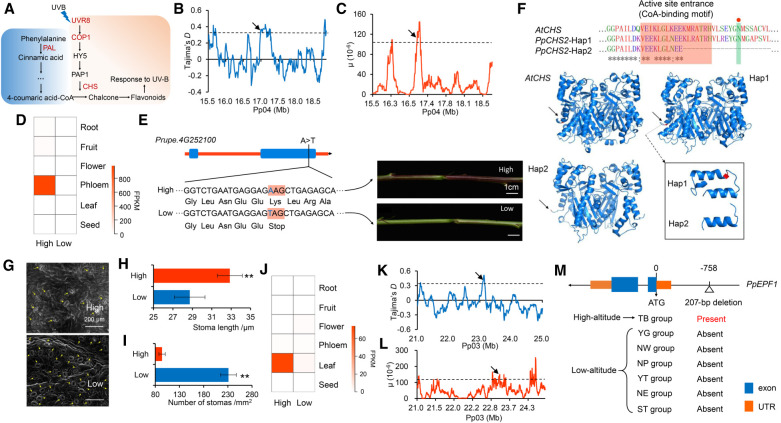
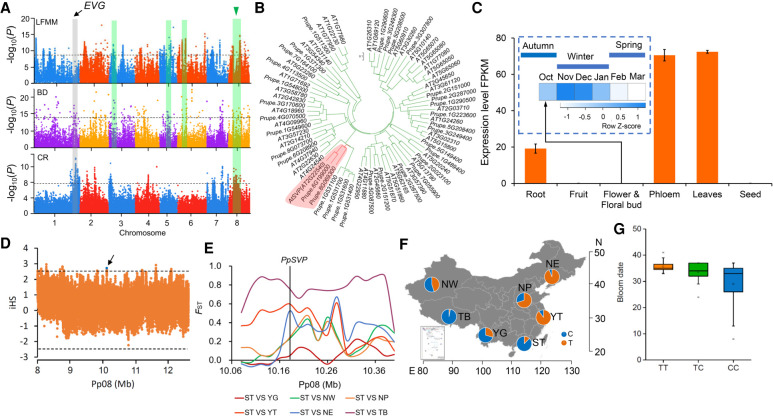
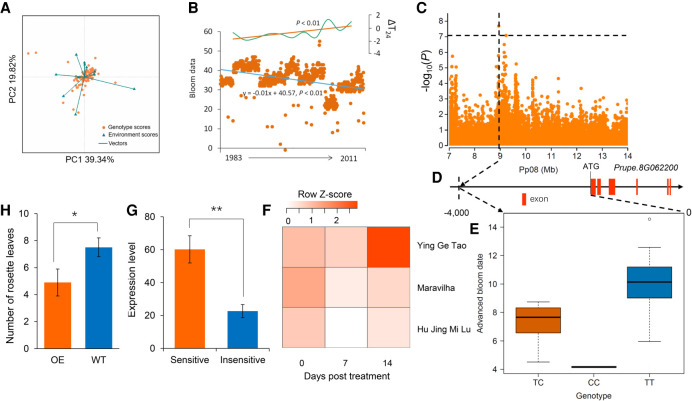
The environment has constantly shaped plant genomes, but the genetic bases underlying how plants adapt to environmental influences remain largely unknown. We constructed a high-density genomic variation map of 263 geographically representative peach landraces and wild relatives. A combination of whole-genome selection scans and genome-wide environmental association studies (GWEAS) was performed to reveal the genomic bases of peach adaptation to diverse climates. A total of 2092 selective sweeps that underlie local adaptation to both mild and extreme climates were identified, including 339 sweeps conferring genomic pattern of adaptation to high altitudes. Using genome-wide environmental association studies (GWEAS), a total of 2755 genomic loci strongly associated with 51 specific environmental variables were detected. The molecular mechanism underlying adaptive evolution of high drought, strong UVB, cold hardiness, sugar content, flesh color, and bloom date were revealed. Finally, based on 30 yr of observation, a candidate gene associated with bloom date advance, representing peach responses to global warming, was identified. Collectively, our study provides insights into molecular bases of how environments have shaped peach genomes by natural selection and adds candidate genes for future studies on evolutionary genetics, adaptation to climate changes, and breeding.


Figures

Figure 1.
Figure 1.
Distribution of the 263 peach accessions and demographic history of the seven ecotypes. (A) Geographic distribution of 263 peach accessions used in this study. Each accession is represented by a dot on the world map. Seven ecotypes are highlighted using solid circles with different colors. (B) Demographic history of the seven peach groups. Ancestral population size was inferred using the PSMC model. Three periods, the last glacial maximum (LGM, ∼20 KYA), Naynayxungla Glaciation (NG, 0.5∼0.78 MYA), and Xixiabangma Glaciation (XG, 0.8∼0.17 MYA), are shaded in green, red, and blue, respectively.
Figure 2.
Figure 2.
Summary of genes under selection for the seven peach groups. (A) Circos plot of the selective sweeps for the seven groups (Supplemental Table S4). The Circos plot in SVG format is available at figshare (https://figshare.com/articles/figure/Genomic_analyses_provide_insights_into_peach_local_adaptation_and_responses_to_climate_change/13158482). The outer track represents the eight chromosomes of the peach genome. The seven inner tracks depict the distribution of selective sweeps across the peach genome in YG, NW, NP, YT, NE, TB, and ST groups, respectively (from the outside inward). (B) Venn diagram showing the number of genes under selection in the seven groups. (C) Overrepresented Gene Ontology (GO) terms and Kyoto Encyclopedia of Genes and Genomes (KEGG) pathways in overall selection regions. Only the top 20 and 30 most overrepresented KEGG pathways and GO terms are shown. (YG) Yun-gui plateau, (NW) Northwest China, (NP) North Plain China, (YT) Yangtze River Middle and Backward, (NE) Northeast China, (TB) Tibet plateau, (ST) South China Subtropical.
Figure 3.
Figure 3.
Genome-wide environmental association studies of 51 environmental variables and genomic loci associated with winter cold adaptation. (A) SNPs associated with environmental variables (EVs). Only the top 10 association signals for each EV are shown. All signals were included if the total number of signals was <10. Three EV association hotspots are highlighted using gray rectangles, and zoom-in figures for these hotspots are displayed. (B) The PpAHP5 locus involved in adaptation to winter low temperature in peach. Manhattan plots for a GWAS study of cold hardiness (CH) and winter lowest temperature (MIN), and selection signals of the NE group are presented. The horizontal dashed lines represent the significance threshold for each test. The candidate genomic region is highlighted between two dashed blue vertical lines. (C) Distribution of FST values between NE and ST groups in the candidate region. The green bar indicates the PpAHP5 locus. (D) Close-up view of the FST values in a region corresponding to the green bar in C. This region contains six PpAHP homologs (orange) and one other gene (light blue). The candidate SNP is highlighted using an orange dot. (E) Relative expression changes of PpAHP5 after cold treatment (−28°C) in resistant and sensitive cultivars. (F) Associations between genotypes (CC or TT) of locus Pp06: 9,187,362 and cold hardiness (lethal temperature of 50%, LT50). (G) Allele (C or T) frequencies of association locus (Pp06: 9,187,362) in PpAHP5 across the seven groups.
Figure 4.
Figure 4.
Genetic basis of drought resistance and high sugar content in the NW group. (A) Annual precipitation among geographic regions of the seven groups. (B) Relationship between the ABA pathway, drought stress, and evolution of flesh color. Heat maps in orange indicate gene expression levels (FPKM) under drought stress (0 h, 6 h, 12 h, 24 h, 3 d, 6 d, 12 d). Heat maps in pink indicate gene expression levels (FPKM) during peach fruit development (10, 50, and 90 d post-bloom date [dpb] for PpCCD4; 20, 40, 60, 80, 100, 120 dpb for PpSPS1). Genes under selection in the NW group are highlighted in red. Red arrows indicate the increase in levels of ABA and sugars. (C) Soluble solid content (SSC) among the seven groups. (D) ABRE cis-acting elements in the promoters of PpSPS1, PpBAM1, and PpAMY1. Orange boxes indicate ABRE elements in the promoter of each gene. The number around each ABRE represents the position from the ATG. The distribution of ABRE elements and nucleotide diversity (π) in the promoter of PpSPS1 in the NW and other groups are shown in a dashed box. (E) Distribution of ROD around PpSPS1 on Chromosome 1. Black arrow points to PpSPS1. (F) Distribution of CLR values around PpSPS1 on Chromosome 1. Black arrow points to PpSPS1. (G) Verification of the interaction between PpAREB (Prupe.1G434500) and the promoter of PpSPS1 (Prupe.1G483200) using a yeast one-hybrid assay.
Figure 5.
Figure 5.
Genomic regions and candidate genes related to high-altitude adaptation of peach. (A) Pathway related to plant response to UVB. Genes under selection are highlighted in red. (B,C) Distribution of Tajima's D (B) and μ statistic (C) in the region around PpCHS2 (Prupe.4G252100) on Chromosome 4 (15.5–19.0 Mb). The dashed horizontal lines indicate a threshold of the top 5% for Tajima's D (≥0.36) and μ test (≥1.07). Arrows point to PpCHS2. (D) Heat map of expression profiles of PpCHS2 in different tissues in low- and high-altitude accessions. (E) A candidate stop-gained SNP in PpCHS2 that is associated with high-altitude adaption and new shoot colors in accessions from low and high altitudes. (F) Effects of stop-gained SNP on protein structure of CHS. 3D structure of CHS protein was obtained from Swiss-Prot. The red shadow represents the CoA-binding motif. The green shadow represents one of the conserved enzyme active site. (G) Scanning electron microscopy (SEM) of stomata from leaves of high- and low-altitude accessions. The magnification is 800×. (H,I) Stomatal length (H) and stomatal density (I) in high- and low-altitude accessions. (**) P < 0.01. (J) Heat map of expression profiles of PpEPF1 in different tissues in accessions from low and high altitudes. (K,L) Distribution of Tajima's D (K) and μ values (L) in a region around PpEPF1 (Prupe.3G235800) on Chromosome 3 (21.0–25.0 Mb). The dashed horizontal lines indicate a threshold of the top 5% for Tajima's D (≥0.36) and μ test (≥1.07). Arrows point to PpEPF1. (M) Structure of PpEPF1 and the position of the 207-bp deletion. The presence and absence of the 207-bp deletion in the seven groups are given.
Figure 6.
Figure 6.
A major PpSVP locus involved in local adaptation of bloom date in peach. (A) Manhattan plots of SNPs associated with EVs (LFMM), bloom date (BD), and chilling requirement (CR). Dashed horizontal lines represent the significance thresholds for the tests. The overlapped regions between GWAS for BD and LFMM are highlighted using green shaded rectangles. The major QTL for CR and BD overlapping with local selection signals on Chromosome 8 surrounding PpSVP is indicated by a blue triangle. The EVG locus is highlighted using a gray shaded rectangle. (B) Neighbor-joining tree of PpSVP and MIKC-type MADS family genes. The clade containing PpSVP is highlighted in red. (C) Temporal and spatial expression patterns of PpSVP. Error bars represent standard deviation of three biological replicates. (D) Patterns of normalized iHS scores across the ∼4.5-Mb genomic region around PpSVP. The dashed horizontal lines represent the threshold of positive selection signal (|iHS| > 2.5). The blue dot indicates the SNP (Pp08: 10,173,576) that showed high iHS score in PpSVP. (E) FST around PpSVP among different groups. The associated SNP in PpSVP is indicated using vertical black line. (F) Allelic frequencies of the associated SNP (Pp08: 10,173,576) in PpSVP across the seven groups. C and T represent the alleles of this SNP. (G) Relationship between genotypes of associated SNP (Pp08: 10,173,576) and bloom date. TT, TC, and CC represent the three genotypes of this SNP.
Figure 7.
Figure 7.
Genotype–environment interaction analysis and genome-wide association study of advance in bloom date. (A) Genotype–environment interaction analysis of bloom date from 1983 to 2011 using the AMMI analysis. (B) Scatterplots of relative bloom date of 89 peach accessions from 1983 to 2011 and temperature change in the spring. The blue and orange lines represent the trend of bloom date changes and temperature changes in the spring, respectively, based on the linear regression analyses. ΔT24 indicates anomalies in the mean temperature from February to April compared to those from 1983 to 2011. (C) Regional Manhattan plot of GWAS for ABD on Chromosome 8 of the 7.0- to 14.0-Mb region. The horizontal black dashed line indicates significance threshold (P < 7.28 × 10⁻⁸ or −log10[P] > 7.08) using a Bonferroni test (0.05). (D) The most significant SNP associated with ABD and its location relative to gene PpLNK1 (Prupe.8G062200). (E) Association between genotypes of the most significant SNP and ABD. (F) Changes in PpLNK1 expression in three cultivars in a climate-warming simulation experiment. (G) Comparison of PpLNK1 expression between accessions sensitive and insensitive to global warming at blooming. (**) P < 0.01. (H) Comparison of BD between wild type (WT) and PpLNK1 overexpression (OE) A. thaliana lines. (*) P < 0.05.

References

    1. Akihiro T, Mizuno K, Fujimura T. 2005. Gene expression of ADP-glucose pyrophosphorylase and starch contents in rice cultured cells are cooperatively regulated by sucrose and ABA. Plant Cell Physiol 46: 937–946. 10.1093/pcp/pci101 - DOI - PubMed
    1. Alachiotis N, Pavlidis P. 2018. RAiSD detects positive selection based on multiple signatures of a selective sweep and SNP vectors. Commun Biol 1: 79. 10.1038/s42003-018-0085-8 - DOI - PMC - PubMed
    1. Alexander DH, Novembre J, Lange K. 2009. Fast model-based estimation of ancestry in unrelated individuals. Genome Res 19: 1655–1664. 10.1101/gr.094052.109 - DOI - PMC - PubMed
    1. Annicchiarico P. 1997. Additive main effects and multiplicative interaction (AMMI) analysis of genotype-location interaction in variety trials repeated over years. Theor Appl Genet 94: 1072–1077. 10.1007/s001220050517 - DOI
    1. Bastin J, Clark E, Elliott T, Hart S, van den Hoogen J, Hordijk I, Ma H, Majumder S, Manoli G, Maschler J, et al. 2019. Understanding climate change from a global analysis of city analogues. PLoS One 14: e0217592. 10.1371/journal.pone.0217592 - DOI - PMC - PubMed

Publication types