. 2021 Apr 15;81(8):1988-2001.
doi: 10.1158/0008-5472.CAN-20-1954. Epub 2021 Mar 9.

Fat Induces Glucose Metabolism in Nontransformed Liver Cells and Promotes Liver Tumorigenesis

Affiliations

Fat Induces Glucose Metabolism in Nontransformed Liver Cells and Promotes Liver Tumorigenesis

Lindsay A Broadfield et al. Cancer Res. .

Abstract

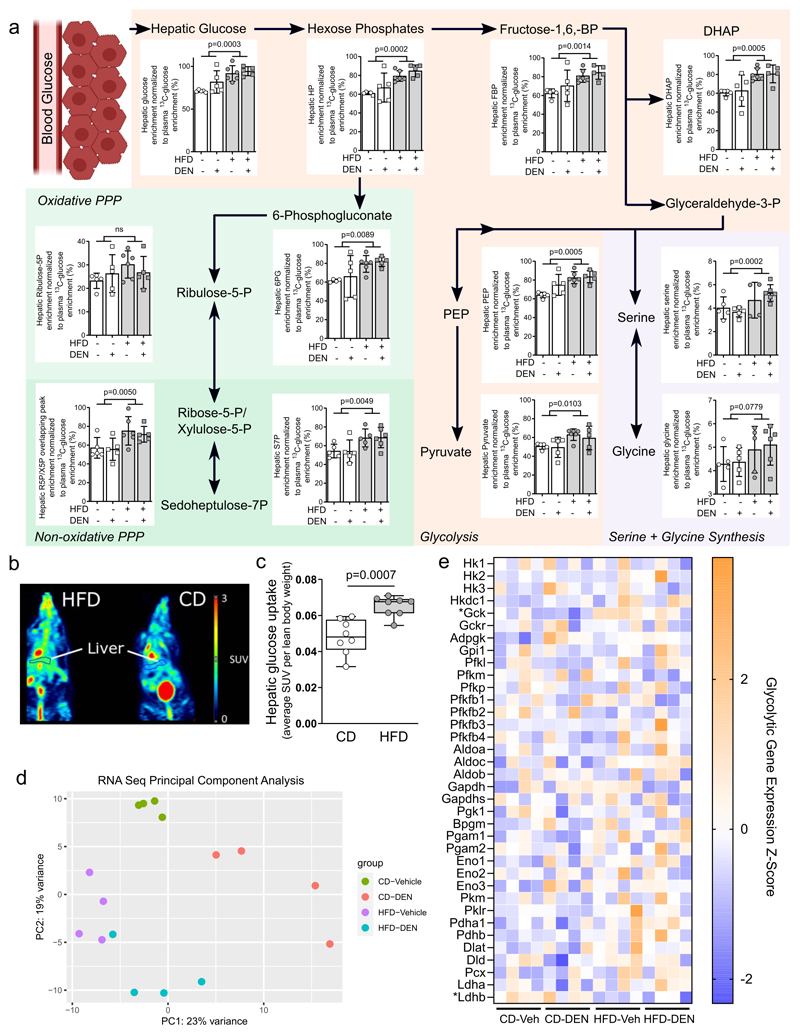
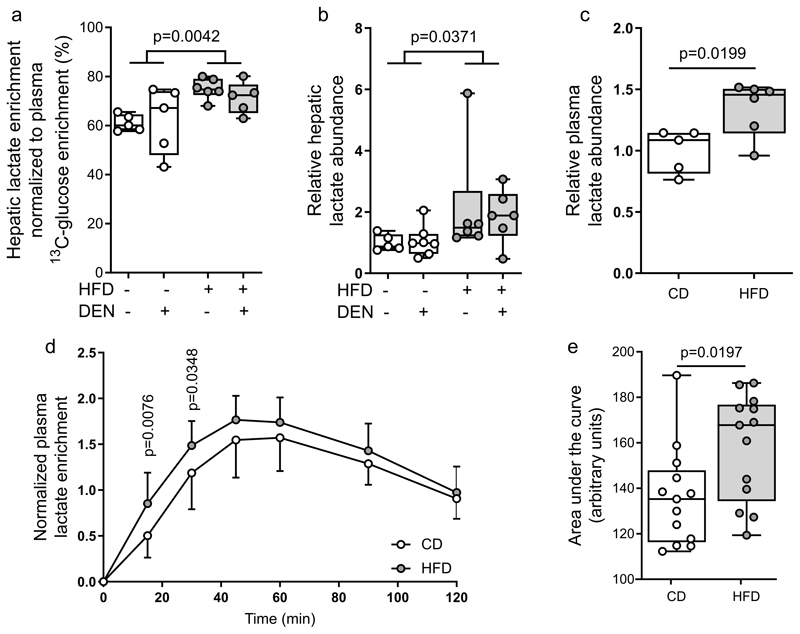
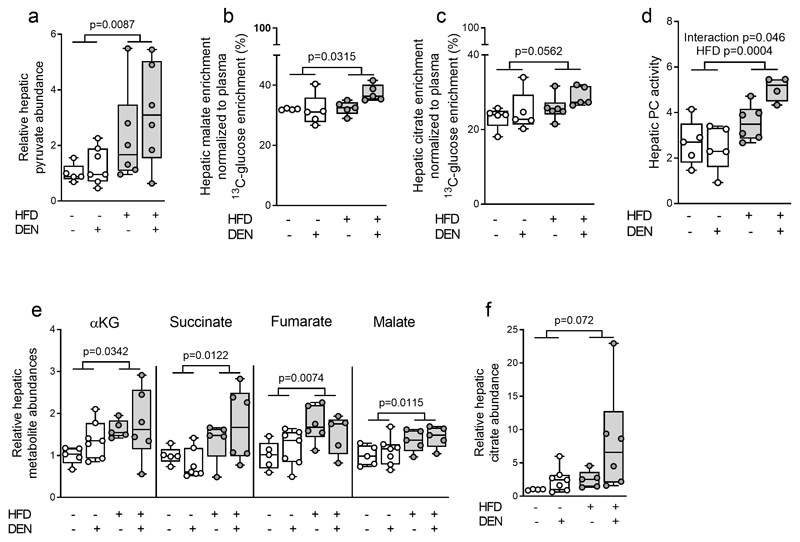
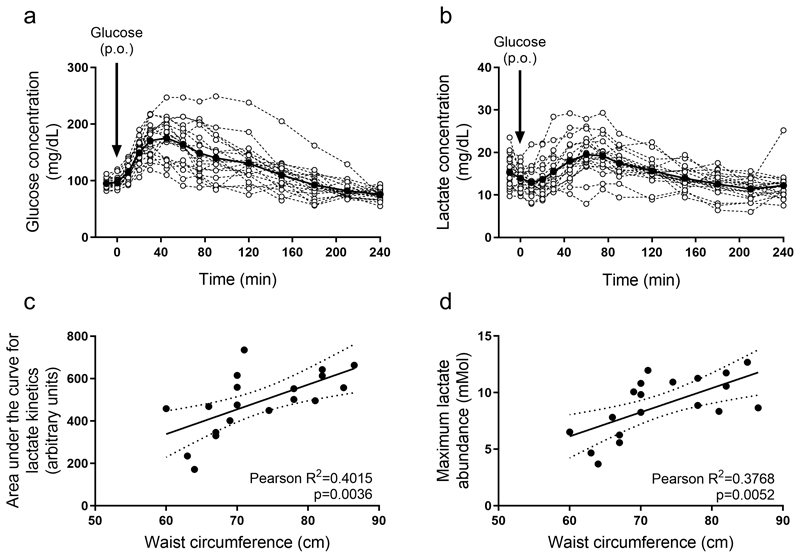
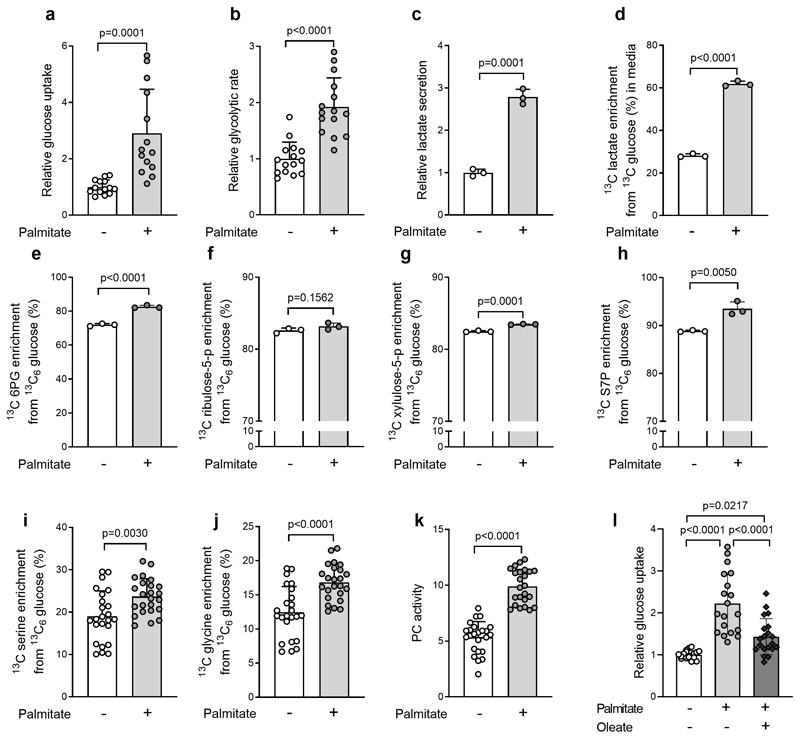
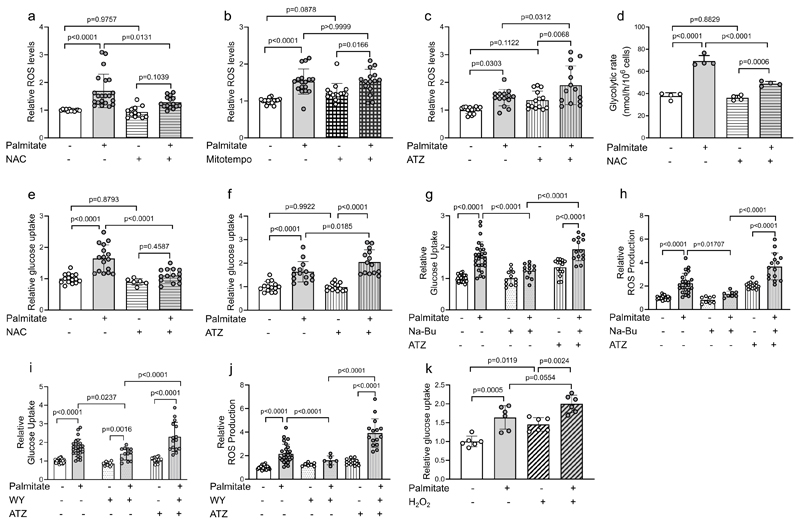
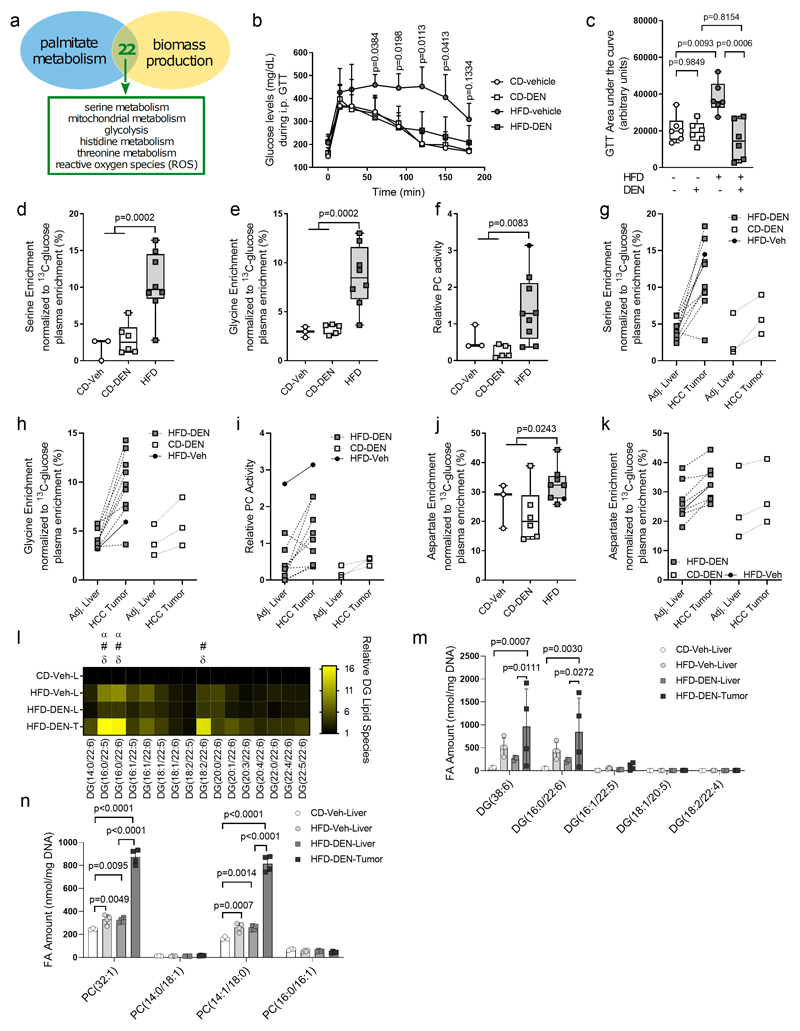
Hepatic fat accumulation is associated with diabetes and hepatocellular carcinoma (HCC). Here, we characterize the metabolic response that high-fat availability elicits in livers before disease development. After a short term on a high-fat diet (HFD), otherwise healthy mice showed elevated hepatic glucose uptake and increased glucose contribution to serine and pyruvate carboxylase activity compared with control diet (CD) mice. This glucose phenotype occurred independently from transcriptional or proteomic programming, which identifies increased peroxisomal and lipid metabolism pathways. HFD-fed mice exhibited increased lactate production when challenged with glucose. Consistently, administration of an oral glucose bolus to healthy individuals revealed a correlation between waist circumference and lactate secretion in a human cohort. In vitro, palmitate exposure stimulated production of reactive oxygen species and subsequent glucose uptake and lactate secretion in hepatocytes and liver cancer cells. Furthermore, HFD enhanced the formation of HCC compared with CD in mice exposed to a hepatic carcinogen. Regardless of the dietary background, all murine tumors showed similar alterations in glucose metabolism to those identified in fat exposed nontransformed mouse livers, however, particular lipid species were elevated in HFD tumor and nontumor-bearing HFD liver tissue. These findings suggest that fat can induce glucose-mediated metabolic changes in nontransformed liver cells similar to those found in HCC. SIGNIFICANCE: With obesity-induced hepatocellular carcinoma on a rising trend, this study shows in normal, nontransformed livers that fat induces glucose metabolism similar to an oncogenic transformation.


Conflict of interest statement

Conflict of Interest

SMF has received funding from Bayer, Merck and Black Belt Therapeutics and has consulted for Fund+. All other authors declare to have no competing interest.

Figures

Figure 1
Figure 1. Fat hyperactivates glucose metabolism.
a) Metabolic differences detected in liver tissue of mice after 8-weeks on CD (CD-vehicle n=5, CD-DEN n=5) or HFD (HFD-vehicle n=7, HFD-DEN n=6) diet normalized to plasma glucose enrichment. Abbreviations: BP, bisphosphate; FBP, fructose-1,6-bisphosphate; DHAP, dihydroxyacetone phosphate; PEP, phosphenolpyruvate; HP, Hexose phosphates; R5P, ribuose-5-phosphate; X5P, Xylulose-5-phosphate; S7P, sedoheptulose-7-phosphate; 6PG, 6-phoshogluconate; PPP, pentose-phosphate pathway. p-value statistics indicate variance caused by diet effect in two-way ANOVA testing. b,c) 18F-fluorodeoxyglucose positron emission tomography (18F-FDG-PET) of mice after eight weeks of control (n=8) or high fat (n=8) diet. Representative images highlighting the region that was selected to assess hepatic 18F-FDG uptake, normalized to lean weight of each mouse. Statistics: Two-tailed unpaired Student’s T-test. d) Principle component analysis of transcriptomics dataset from bulk RNA sequencing of liver tissue from CD-vehicle, CD-DEN, HFD-vehicle and HFD-DEN. n=4 per group. X and Y axes indicate the amount of variance accounted for by the first and second components, in percentage. e) Heat map of genes involved in glycolysis expressed as Z-score. * indicates p-adjusted value < 0.05 from DESeq analysis testing for a diet effect.
Figure 2
Figure 2. Fat induces lactate production from glucose.
a, b) Hepatic lactate enrichment normalized towards the 13C enrichment of plasma glucose, and hepatic lactate abundance CD (CD-vehicle n=5, CD-DEN n=5) or HFD (HFD-vehicle n=7, HFD-DEN n=6). c) Plasma lactate abundance of mice after 8-weeks of control (CD-vehicle n=5) or high fat (HFD-vehicle n=6) diet normalized to control. Statistics: Two-tailed unpaired Student’s T-test. d, e) Time-resolved changes in 13C lactate enrichment and corresponding area under the curve in mouse plasma after eight weeks on CD (n=13) or HFD (n=13) diet in response to oral administration of 2 g/kg of 13C6 glucose. Statistics: Two-way ANOVA with Fisher LSD testing to compare each time point (d), and two-tailed unpaired Student’s T-test (e). Statistics: Unless noted otherwise, two-way ANOVA, with p-values representing the diet effect.
Figure 3
Figure 3. Fat promotes pyruvate carboxylase activity
a) Hepatic pyruvate abundance of mice after 8-weeks of control or high fat diet normalized to CD (CD-vehicle n=5, CD-DEN n=7) or HFD (HFD-vehicle n=7, HFD-DEN n=6). b, c) Hepatic malate and citrate enrichment normalized towards the 13C enrichment of plasma glucose CD (CD-vehicle n=5, CD-DEN n=5) or HFD (HFD-vehicle n=7, HFD-DEN n=6). d) Pyruvate carboxylase (PC) activity (based on 13C tracer analysis) in mouse livers after eight weeks of CD (CD-vehicle n=5, CD-DEN n=5) or HFD (HFD-vehicle n=6, HFD-DEN n=4). e, f) Metabolite abundance in liver tissue of mice after eight weeks of CD (CD-vehicle n=5, CD-DEN n=7) or HFD (HFD-vehicle n=7, HFD-DEN n=6) normalized to CD-vehicle. αKG refers to α-ketoglutarate. Unless noted otherwise, two-way ANOVA.
Figure 4
Figure 4. Evidence for fat-induced lactate production upon glucose availability in humans
a-b) Glucose and lactate abundance in the blood plasma of healthy human individuals upon oral administration of 75 g glucose (n=20). Black line indicates average over all individuals. Arrows indicate the time at which glucose was consumed. P.O refers to per os. c-d) Correlation of waist circumference (WC; surrogate of visceral fat) with the area under the curve of the lactate kinetics or the maximum lactate abundance in healthy individuals upon oral administration of 75 g glucose (n=20). Correlations were calculated by performing linear regression analysis, followed by an F-test to determine significant deviation from a 0-slope line.
Figure 5
Figure 5. Fat-induced changes in liver metabolism can be recapitulated at the cellular level
a, b) Glucose uptake (n=14 for each group) and glycolytic rate (n=15 for each group) in H4IIEC3 cells treated with 0.4 mM palmitate or vehicle for 8-hours normalized to vehicle. c, d) 13C-labelled lactate secretion into cell medium with following an 8 hour treatment of vehicle or 0.4mM palmitate in 13C6-glucose supplemented DMEM. Lactate secretion was calculated with the assumption of exponential cell growth during the 8 hour treatment phase, normalized to control. n=3 for each condition. e-k) 6-phosphogluconate (n=3 for each group), ribulose-5-phosphate (n=3 for each group), xylulose 5-phosphate (n=3 for each group) and sedoheptulose-7-phosphate (n=3 for each group), serine synthesis (n=24 for each group) with conversion to glycine (n=24 for each group), and pyruvate carboxylase (PC) activity (n=24 for each group), in H4IIEC3 cells treated with 0.4 mM palmitate or vehicle for 8-hours. I) Glucose uptake in H4IIEC3cells treated with 0.4mM palmitate and/or oleate for 8 hours normalized to control. n=24 replicates. Statistics: one-way ANOVA with Tukey ‘s multiple comparisons test. Unless otherwise stated, two-tailed unpaired Student’s T-test, with p-values as indicated. All data are represented as mean ± standard deviation.
Figure 6
Figure 6. ROS production is required for the hyperactivation of glucose metabolism upon palmitate supplementation
a-c) Reactive oxygen species (ROS) in H4IIEC3 cells treated with 0.4 mM palmitate and/or NAC (5 mM) (n=22, 21, 12, 15 individual replicates for vehicle, palmitate, vehicle + NAC and NAC + palmitate groups, respectively), Mitotempo (n=18, 15, 14 and 15 individual replicates for vehicle, palmitate, mitotempo and mitotempo + palmitate, respectively) or ATZ (20 mM) (n=14 individual replicates for each group) normalized to control. d) Glycolytic rate in H4IIEC3cells treated with 0.4 mM palmitate and/or NAC (5 mM) (n=4 individual replicates for each group). e) Glucose uptake in H4IIEC3cells treated with 0.4mM palmitate and/or NAC (5 mM) (n=6 with individual replicates plotted for each group) normalized to control. f) Glucose uptake in H4IIEC3cells treated with 0.4 mM palmitate and/or 3-ATZ (20 mM) (n=14 individual replicates for each group) normalized to control. g-j) Relative glucose uptake and ROS production in in H4IIEC3cells pre-treated for 24-hours with sodium butyrate (Na-Bu, 5mM) or WY-14643 (WY, 100μM) followed by 8-hour treatment with 0.4mM palmitate and ATZ (20mM). (n=3-6 with individual replicates plotted for each group) normalized to control. Statistics: two-way ANOVA with Fisher LSD post-hoc testing, with p-values as indicated. k) Relative glucose uptake in cells treated with 0.4 mM palmitate and/or H2O2 (2 mM) (n=6 with individual replicates plotted) normalized to control. Unless otherwise noted, one-way ANOVA with Tukey’s multiple comparisons with p-values for multiple comparisons as indicated.
Figure 7
Figure 7. Metabolic pathways induced by fat in non-transformed mouse livers are hallmarks of HCC.
a) In silico predictions of common metabolic pathways between cells supplemented with palmitate and cells maximizing biomass production based on 22 common metabolic intermediates. b-c), Intraperitoneal glucose tolerance test in mice after 29 weeks on CD (CD-vehicle, n = 6; CD-DEN, n = 6) or HFD (HFD-vehicle, n = 6; HFD-DEN, n = 6) with DEN or vehicle exposure. Data are expressed as the mean of measured blood glucose levels (mg/dL) and the AUC. Statistics, two-way ANOVA followed by Dunnett’s multiple comparisons, with P values for HFD-vehicle compared with CD-vehicle as indicated in B and one-way ANOVA with Tukey’s multiple comparisons test with P values represented in c. d-f) Serine biosynthesis with conversion to glycine normalized toward the 13C enrichment of plasma glucose and pyruvate carboxylase (PC) activity in normal liver (CD-vehicle, n = 3; CD-DEN, n = 6) or HCC tumor tissue [HFD-vehicle, n = 1 (full-black circle); HFD-DEN, n = 9 (PC activity) or n = 8 (serine biosynthesis with conversion to glycine)] of mice after 29 weeks on CD with DEN or vehicle exposure. Statistics, two-tailed unpaired Student t test comparing CD to HFD. g-i) Serine biosynthesis with conversion to glycine normalized toward the 13C enrichment of plasma glucose and PC activity in matched pairs of HCC tumor and adjacent normal liver tissue of mice after 29 weeks on CD (n = 3) or HFD (n = 8) with vehicle or DEN exposure. In two HFD mice, two tumors were analyzed and one HFD-vehicle mouse (solid-black dot and line) was included. j) Aspartate synthesis normalized toward the 13C enrichment of plasma glucose from glucose in normal liver (CD-vehicle, n = 3; CD-DEN, n = 6) or HCC tissue [HFD-vehicle, n = 1 (full-black circle); HFD-DEN, n = 7] of mice after 29 weeks on CD with DEN or vehicle exposure. Statistics, two-tailed unpaired Student t test comparing CD to HFD. k) Aspartate synthesis normalized toward the 13C enrichment of plasma glucose from glucose in matched pairs of HCC tumor and adjacent normal liver tissue of mice after 29 weeks on CD (n = 3) or HFD (n = 8) with vehicle or DEN exposure. For two HFD-DEN animals, two tumors were analyzed and connected to the same adjacent liver sample and one HFD-vehicle mouse is included (solid-black circle and solid line). I) Heat map with normalized diacylglycerides (DG) species that contain 22:5 and 22:6 acyl chains in CD-vehicle liver tissue (n = 3), HFD-vehicle liver tissue (n = 4), HFD-DEN liver tissue (n = 3), and HFD-DEN tumor tissue (n = 4), all normalized to CD-vehicle liver tissue. Statistics, two-way ANOVA with Tukey’s multiple comparisons testing. α, significant differences between CD-vehicle liver to HFD-vehicle liver; #, significant differences between CD-vehicle liver and HFD-DEN tumor tissue; δ, significant differences between HFD-DEN liver tissue and HFD-DEN tumor tissue, with P < 0.05 considered significant. m-n) Total amounts of the sum notations of DG (38:6) and PC (32:1), and the specific lipid species that make up the sum notations in CD-vehicle liver tissue (n = 3), HFD-vehicle liver tissue (n = 4), HFD-DEN liver tissue (n = 4), and HFD-DEN tumor tissue (n = 4). Statistics, two-way ANOVA with Tukey’s multiple comparisons tests, with P values represented.

References

    1. Lundsgaard A-M, Fritzen AM, Kiens B. Molecular Regulation of Fatty Acid Oxidation in Skeletal Muscle during Aerobic Exercise. Trends in Endocrinology & Metabolism. 2018;29(1):18–30. - PubMed
    1. Lorendeau D, Christen S, Rinaldi G, Fendt S-M. Metabolic control of signaling pathways and metabolic auto-regulation. Biology of the Cell. 2015;107(8):251–72. - PubMed
    1. Rinaldi G, Rossi M, Fendt S-M. Metabolic interactions in cancer: Cellular metabolism at the interface between the microenvironment, the cancer cell phenotype and the epigenetic landscape. WIREs Syst Biol Med. 2017:e1397. doi: 10.1002/wsbm.1397. in press. - DOI - PubMed
    1. Vande Voorde J, Ackermann T, Pfetzer N, Sumpton D, Mackay G, Kalna G, et al. Improving the metabolic fidelity of cancer models with a physiological cell culture medium. Science Advances. 2019;5(1):eaau7314. - PMC - PubMed
    1. Hensley Christopher T, Faubert B, Yuan Q, Lev-Cohain N, Jin E, Kim J, et al. Metabolic Heterogeneity in Human Lung Tumors. Cell. 2016;164(4):681–94. - PMC - PubMed

Publication types

MeSH terms