

Data-driven Derivation and Validation of Novel Phenotypes for Acute Kidney Transplant Rejection using Semi-supervised Clustering
- PMID: 33687976
- PMCID: PMC8259675
- DOI: 10.1681/ASN.2020101418
Data-driven Derivation and Validation of Novel Phenotypes for Acute Kidney Transplant Rejection using Semi-supervised Clustering
Abstract
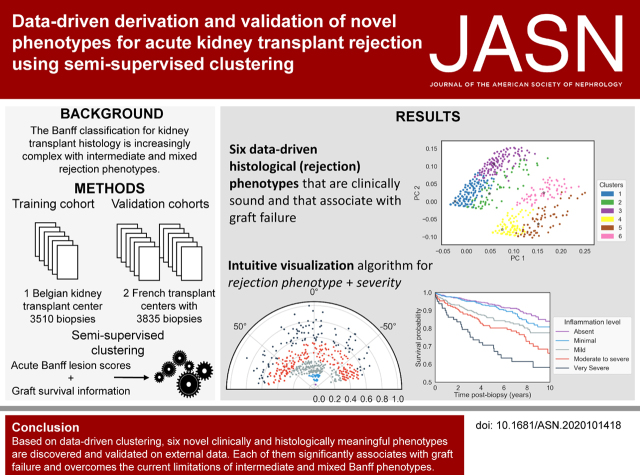
Background: Over the past decades, an international group of experts iteratively developed a consensus classification of kidney transplant rejection phenotypes, known as the Banff classification. Data-driven clustering of kidney transplant histologic data could simplify the complex and discretionary rules of the Banff classification, while improving the association with graft failure.
Methods: The data consisted of a training set of 3510 kidney-transplant biopsies from an observational cohort of 936 recipients. Independent validation of the results was performed on an external set of 3835 biopsies from 1989 patients. On the basis of acute histologic lesion scores and the presence of donor-specific HLA antibodies, stable clustering was achieved on the basis of a consensus of 400 different clustering partitions. Additional information on kidney-transplant failure was introduced with a weighted Euclidean distance.
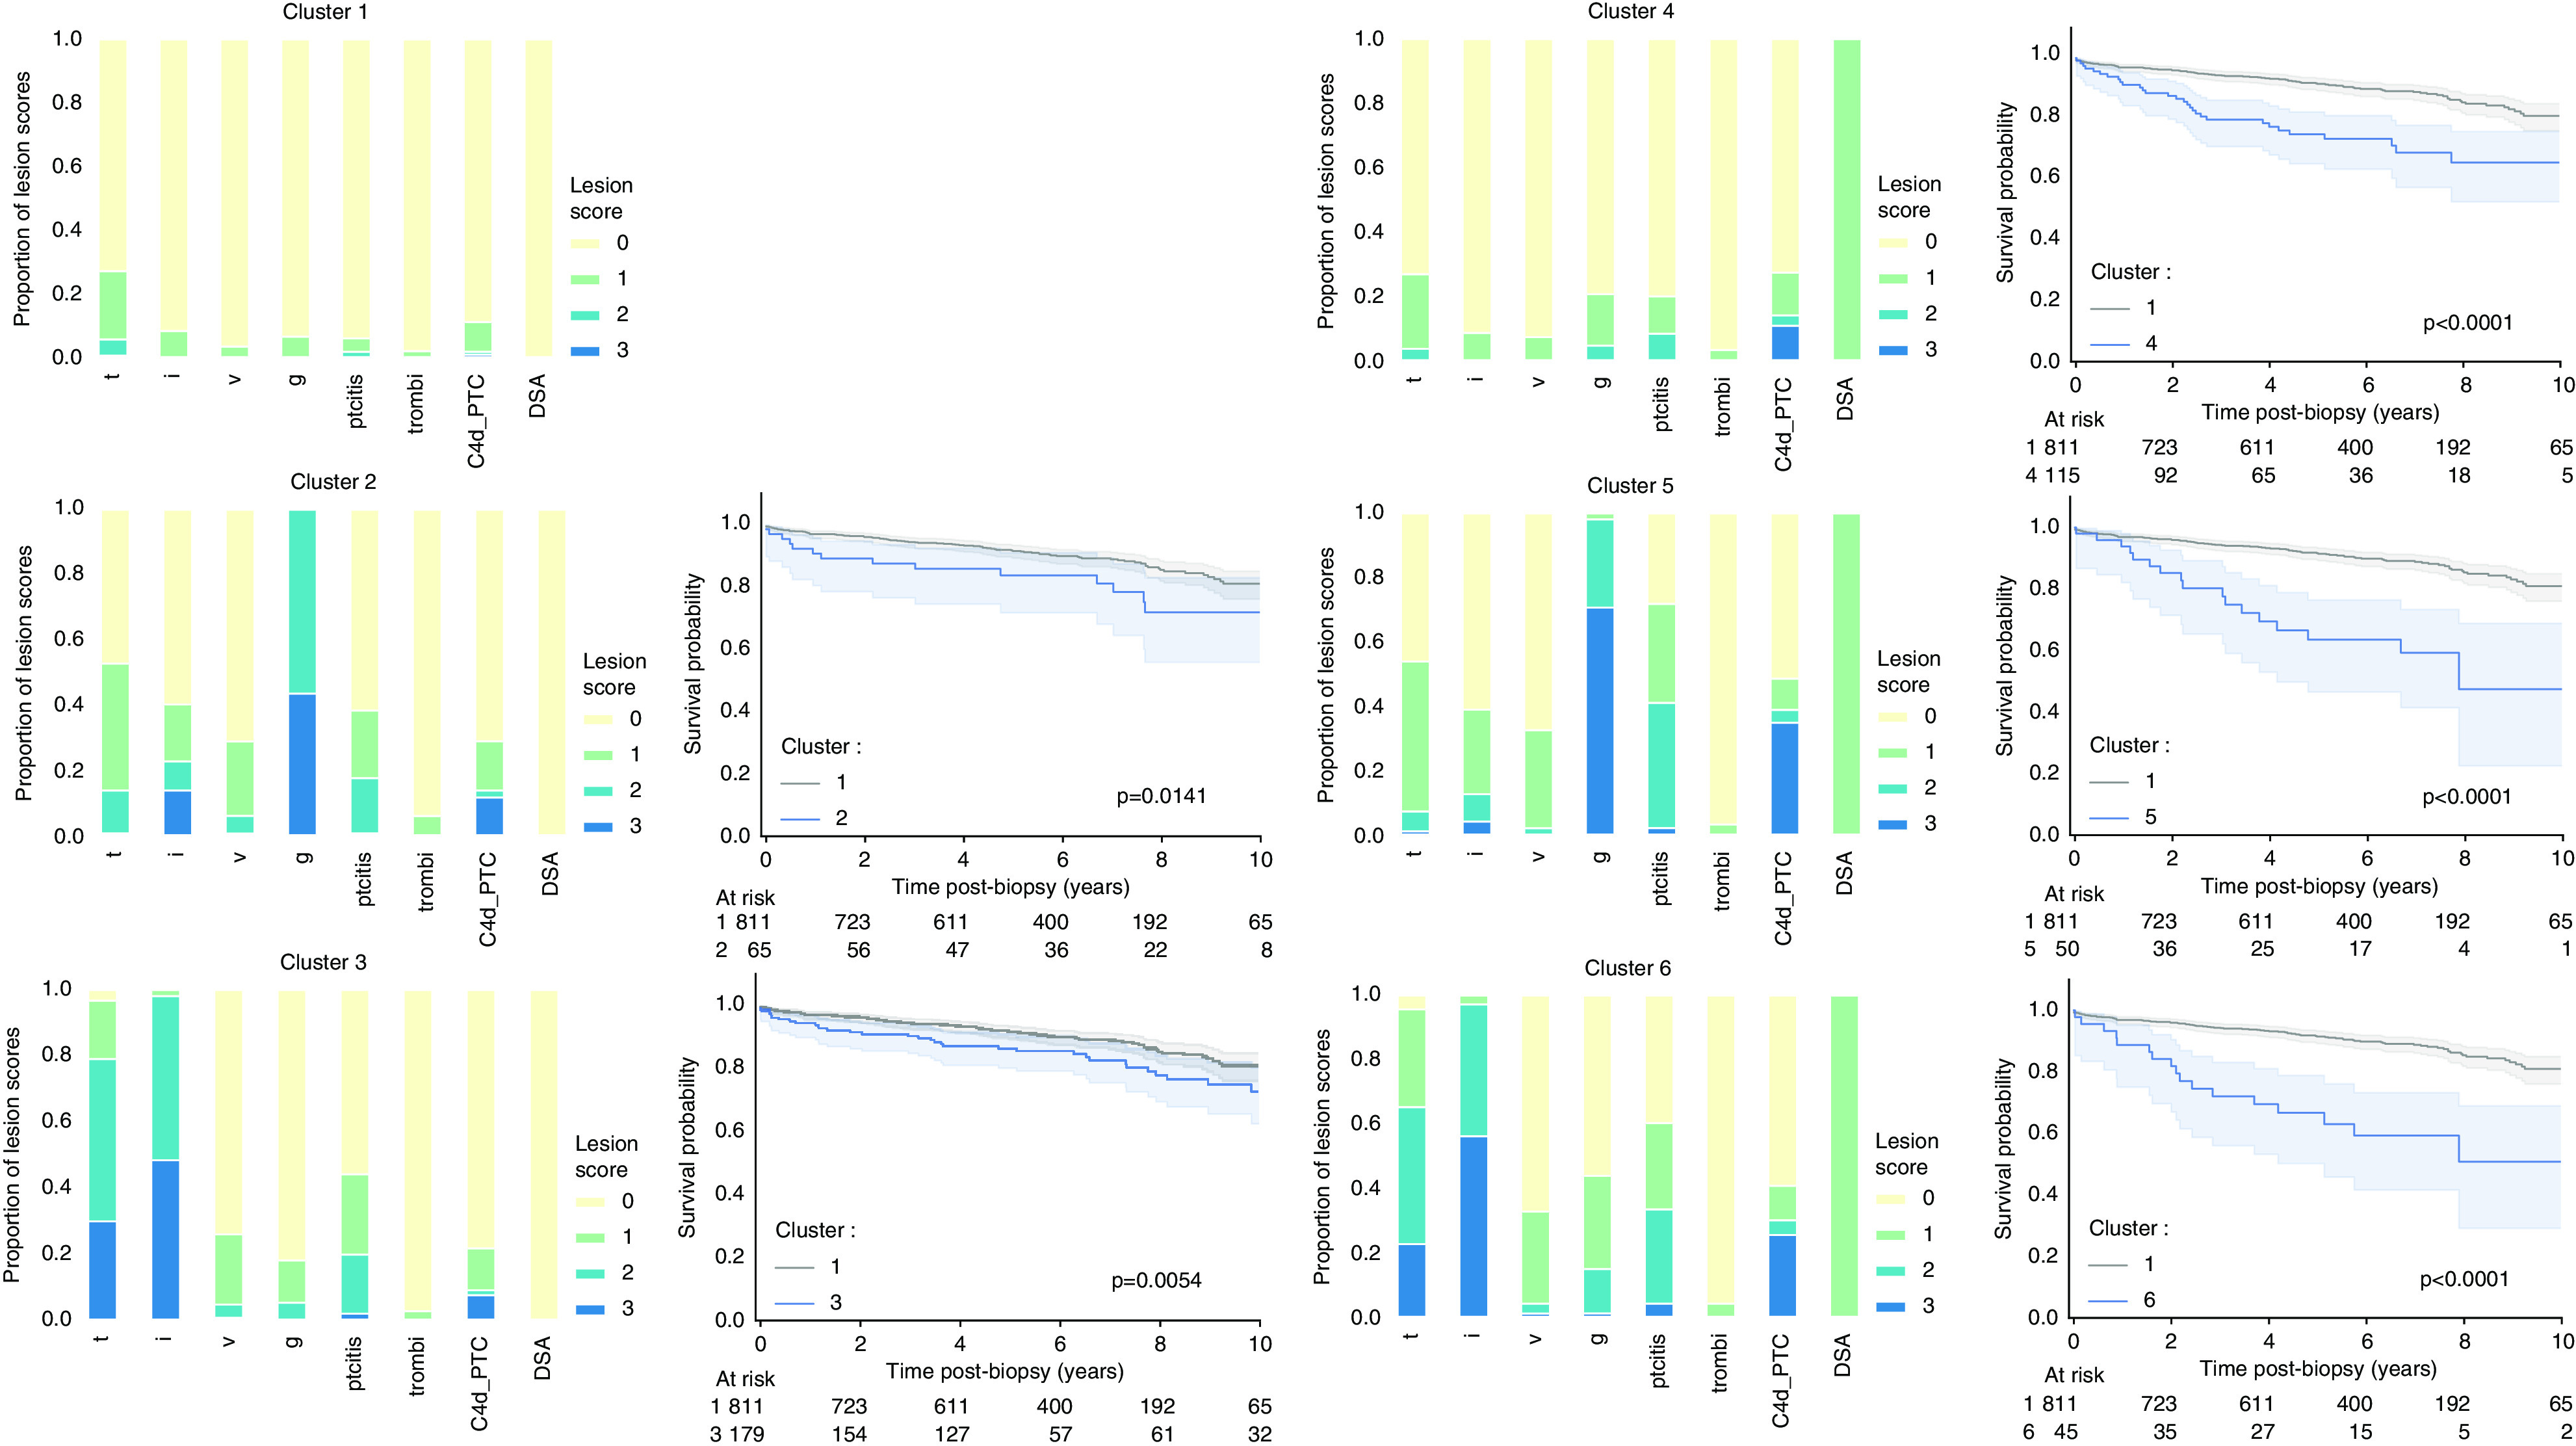
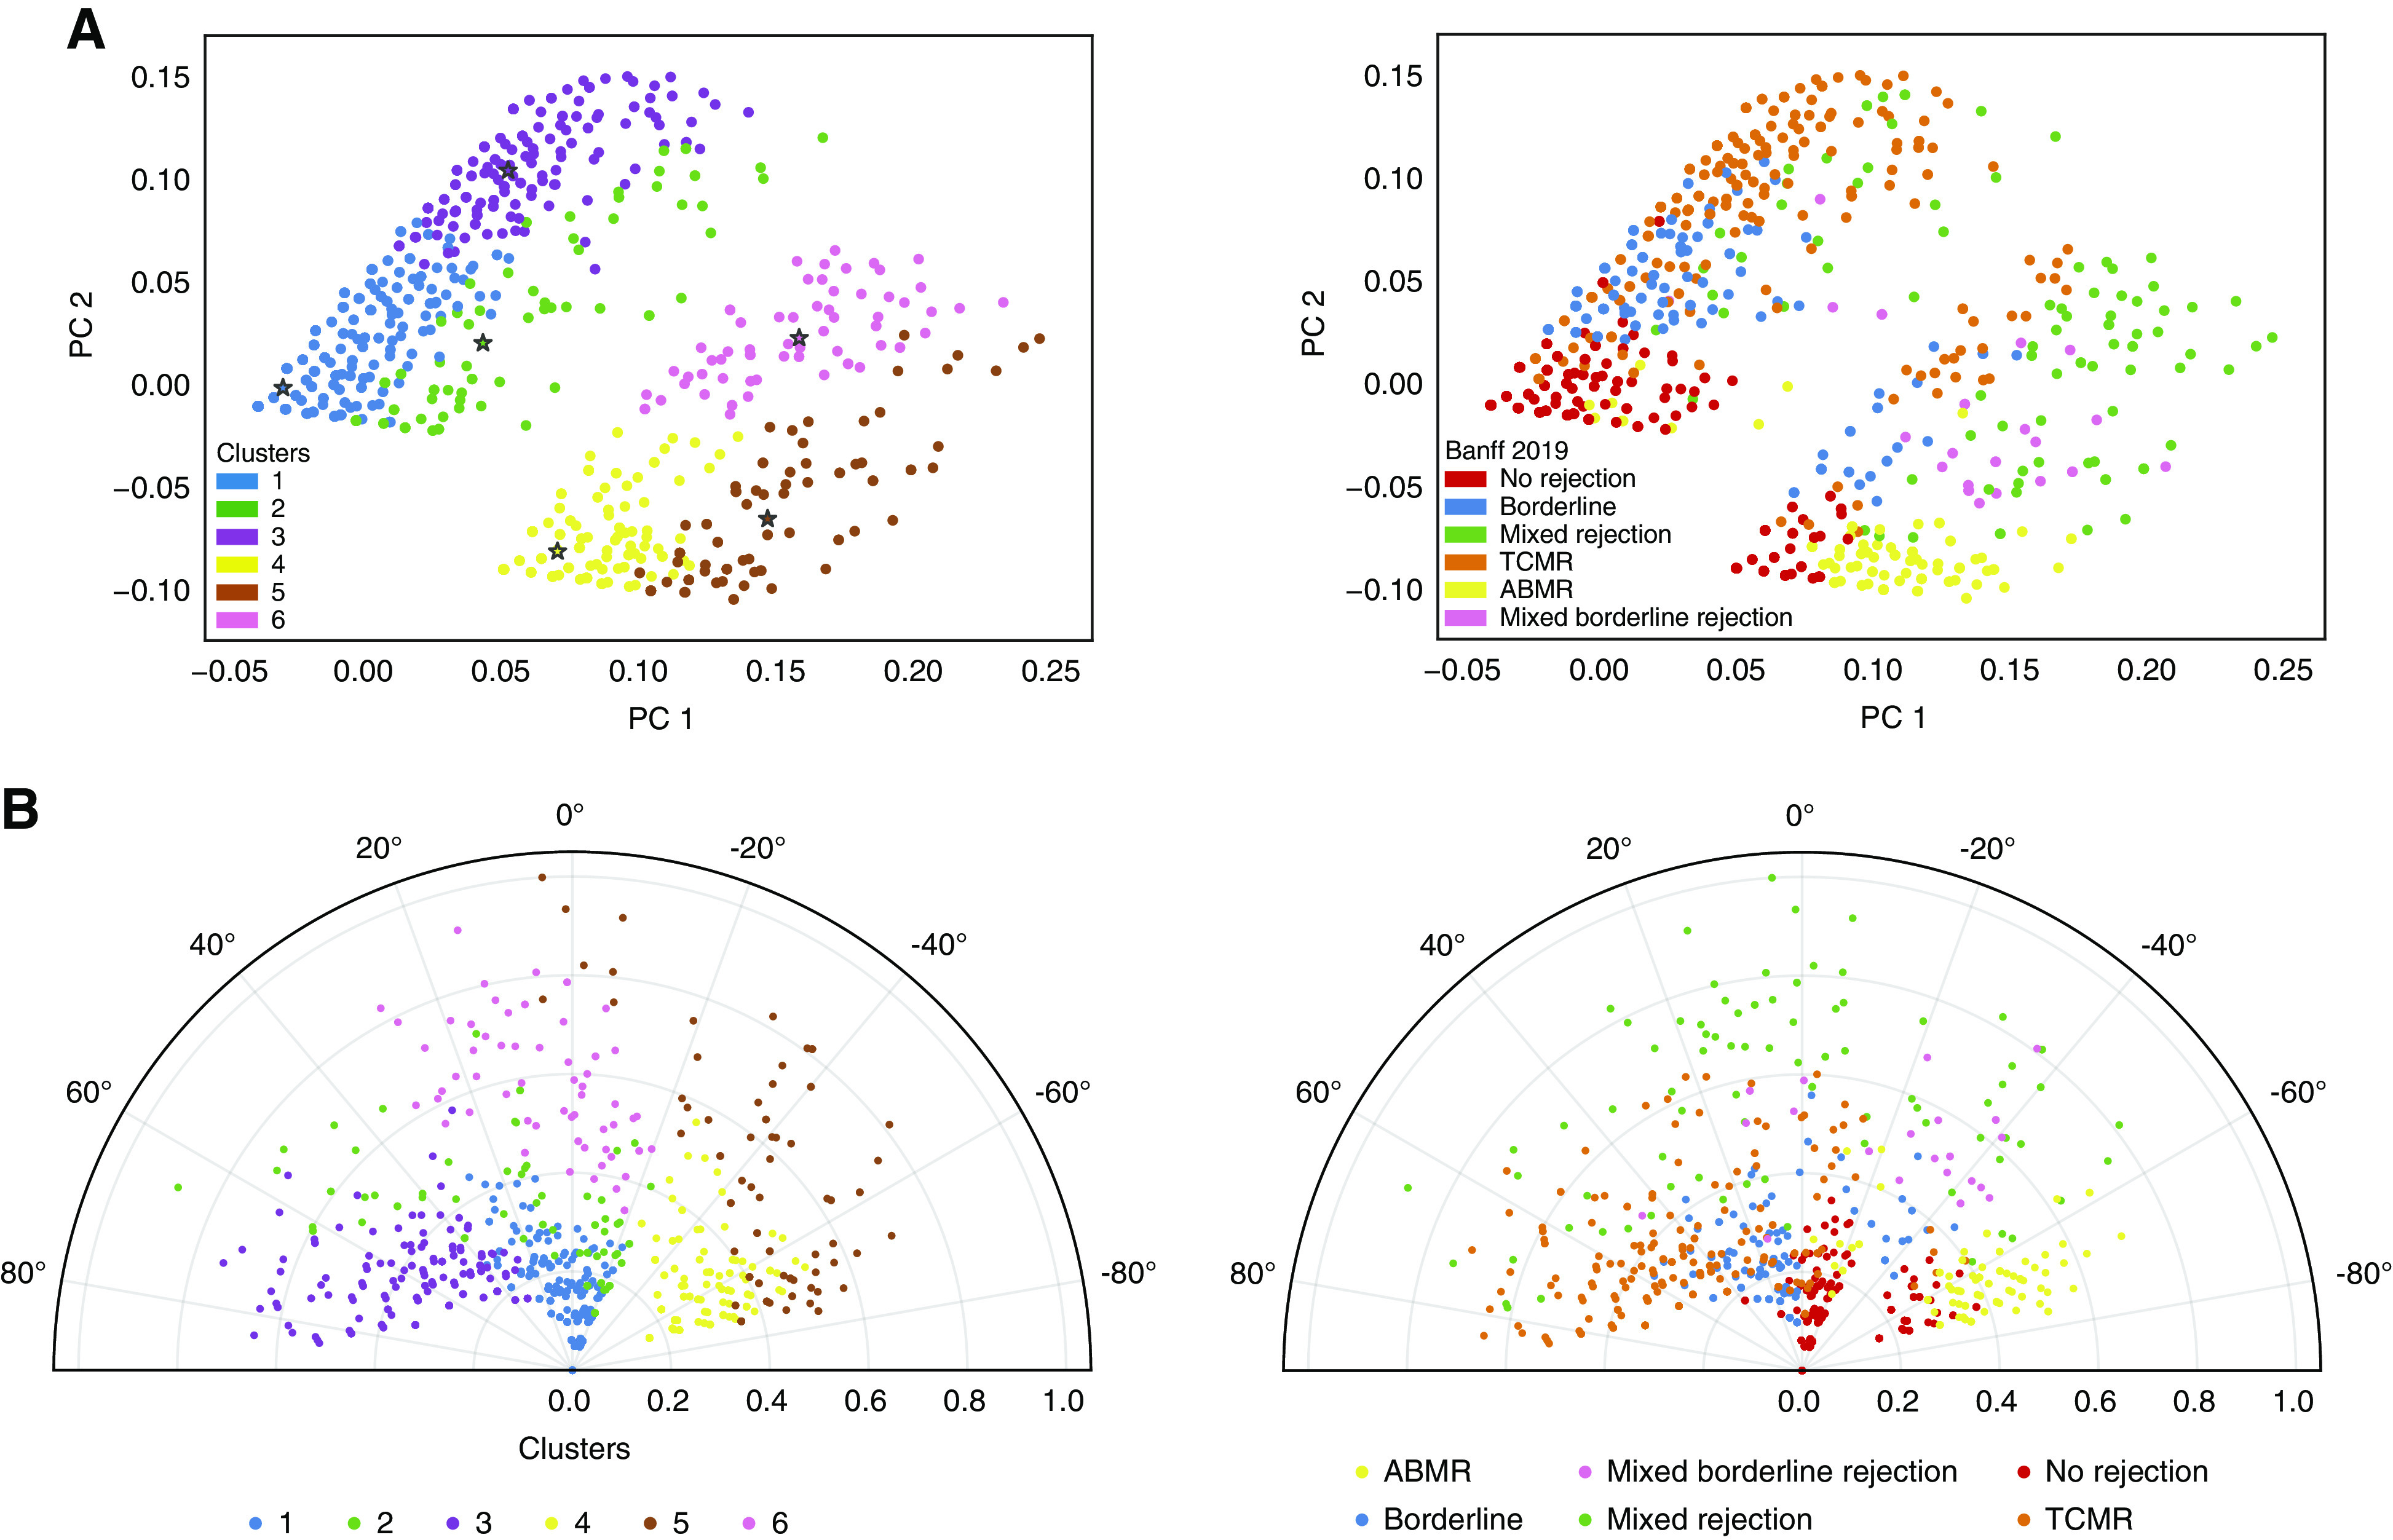
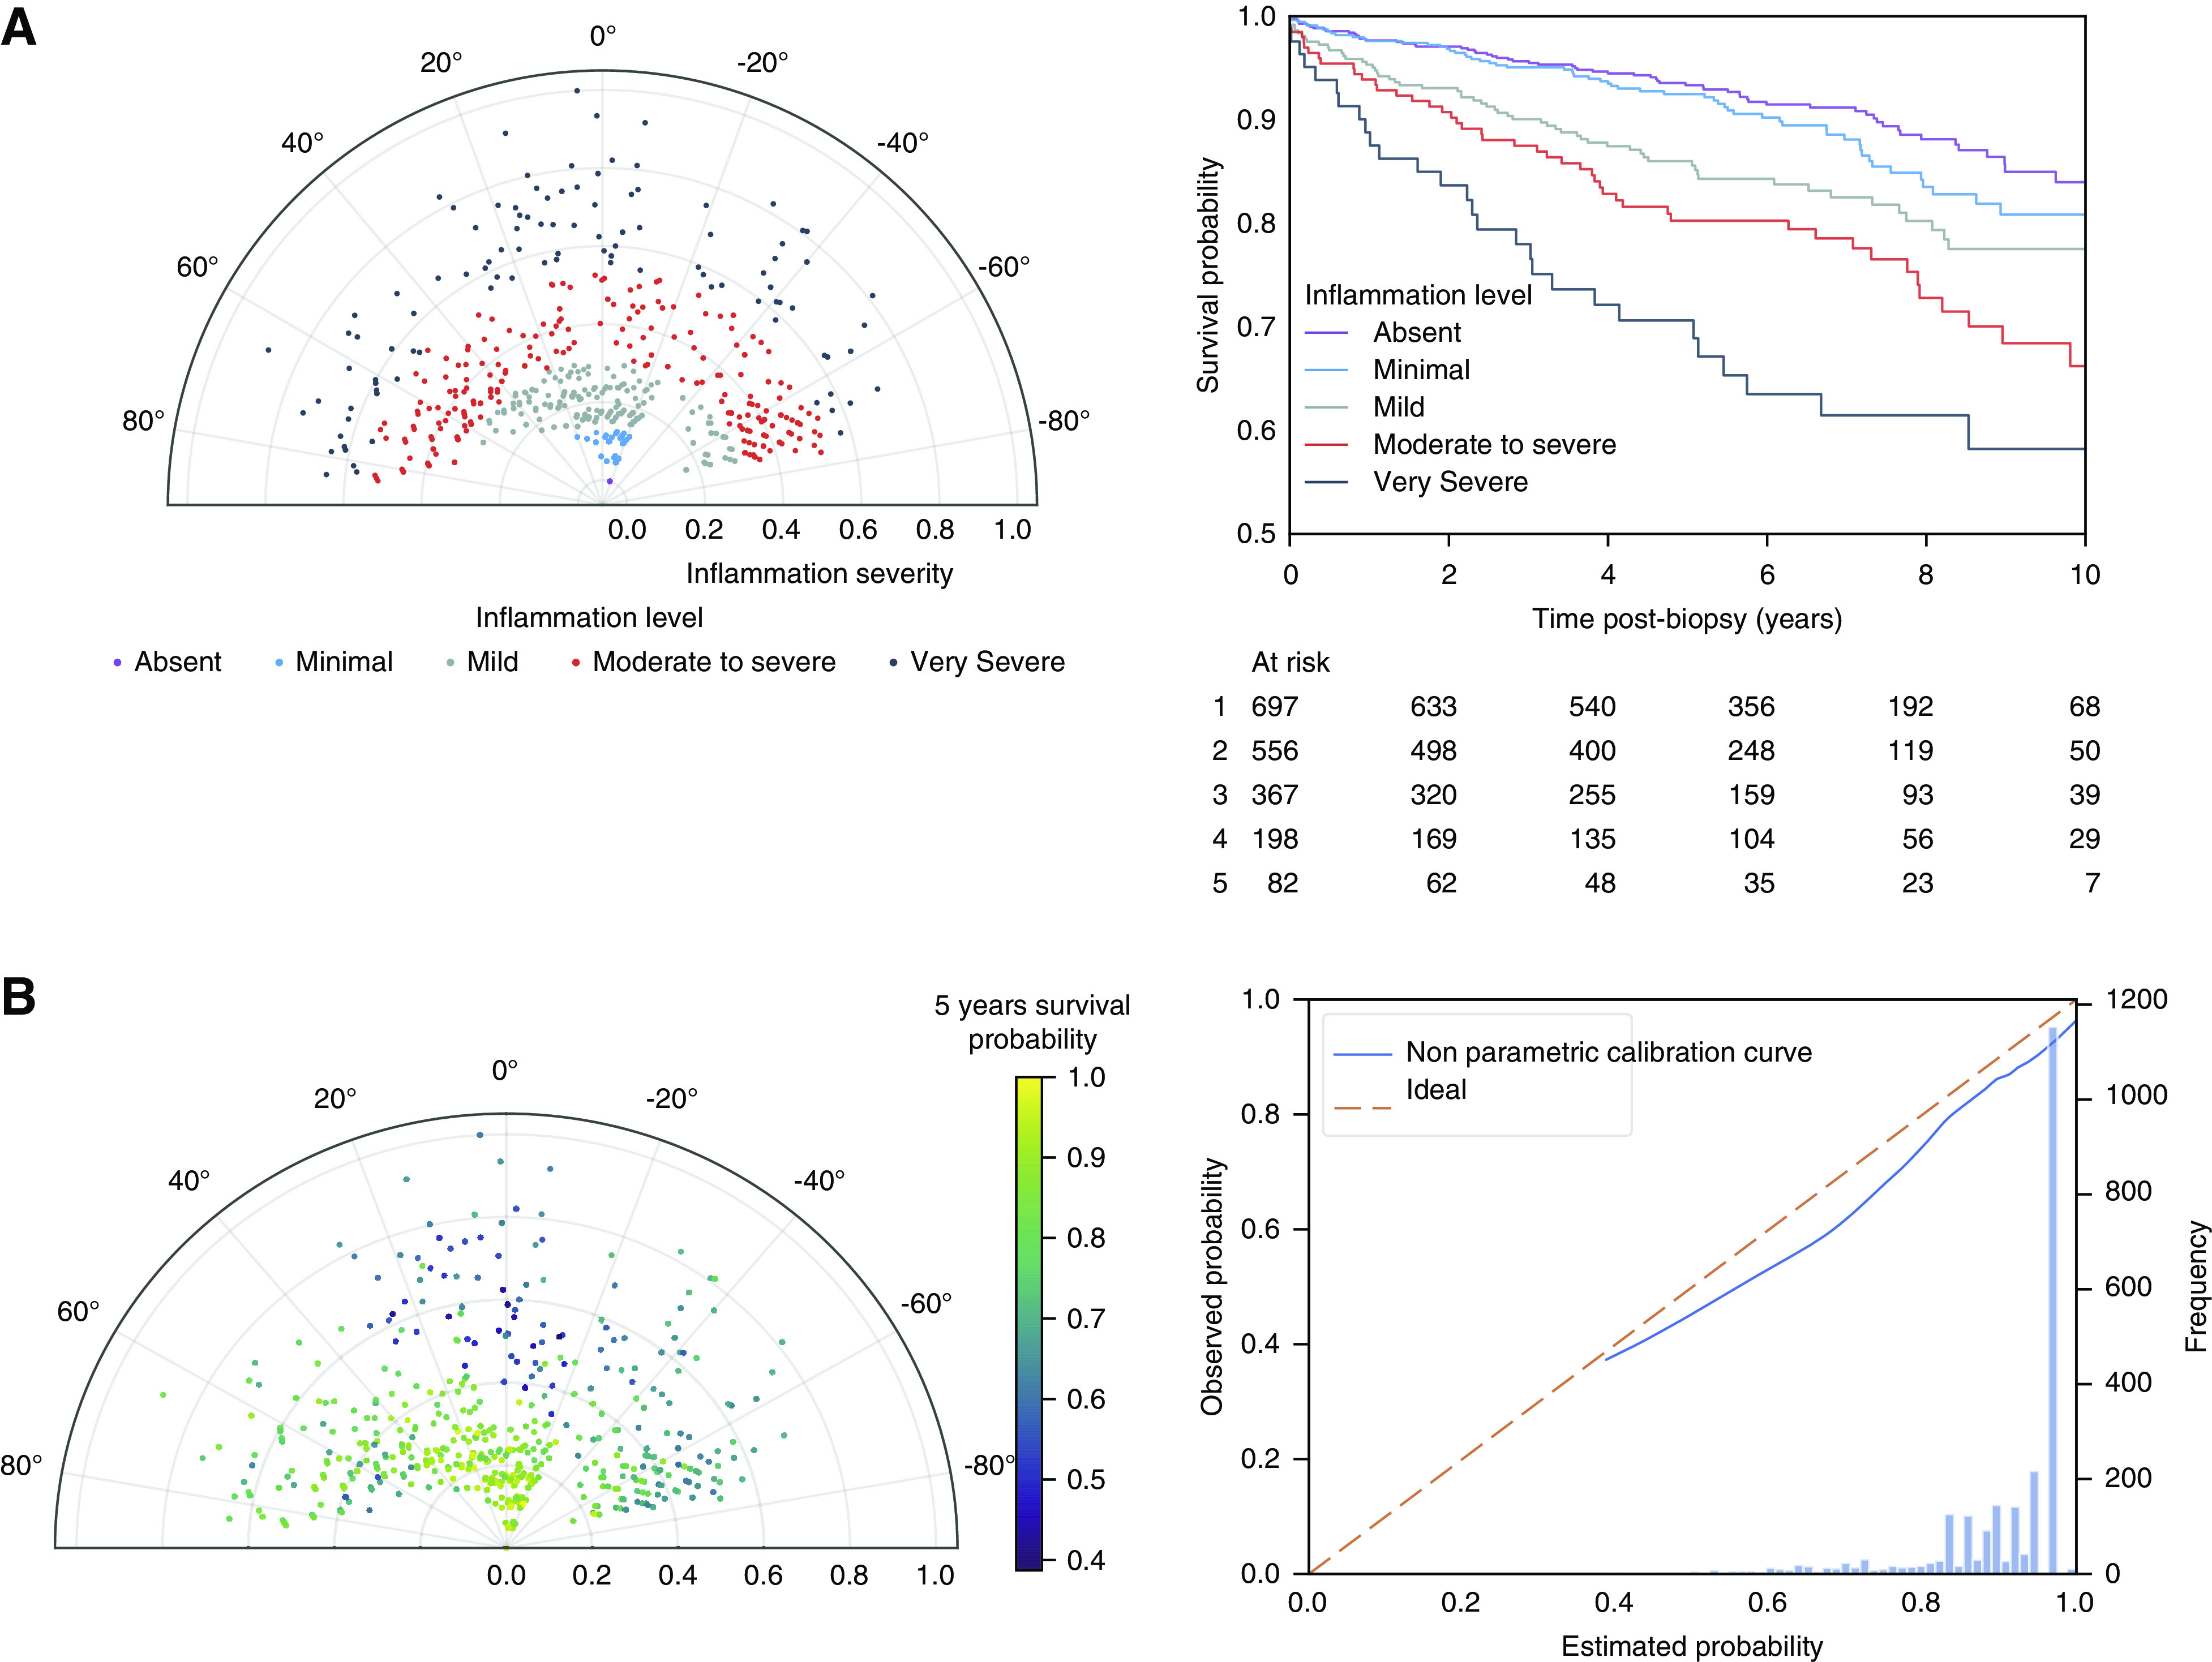
Results: Based on the proportion of ambiguous clustering, six clinically meaningful cluster phenotypes were identified. There was significant overlap with the existing Banff classification (adjusted rand index, 0.48). However, the data-driven approach eliminated intermediate and mixed phenotypes and created acute rejection clusters that are each significantly associated with graft failure. Finally, a novel visualization tool presents disease phenotypes and severity in a continuous manner, as a complement to the discrete clusters.
Conclusions: A semisupervised clustering approach for the identification of clinically meaningful novel phenotypes of kidney transplant rejection has been developed and validated. The approach has the potential to offer a more quantitative evaluation of rejection subtypes and severity, especially in situations in which the current histologic categorization is ambiguous.
Keywords: acute allograft rejection; kidney biopsy; kidney transplantation; transplant outcomes; transplant pathology.
Copyright © 2021 by the American Society of Nephrology.
Figures
Comment in
-
Kidney Transplant Rejection Clusters and Graft Outcomes: Revisiting Banff in the Era of "Big Data".J Am Soc Nephrol. 2021 May 3;32(5):1009-1011. doi: 10.1681/ASN.2021030348. Epub 2021 Apr 6. J Am Soc Nephrol. 2021. PMID: 33824191 Free PMC article. No abstract available.
-
Novel Phenotypes for Acute Kidney Transplant Rejection Using Semi-Supervised Clustering.J Am Soc Nephrol. 2021 Sep;32(9):2387-2388. doi: 10.1681/ASN.2021040572. Epub 2021 Aug 16. J Am Soc Nephrol. 2021. PMID: 34403355 Free PMC article. No abstract available.
-
Authors' Reply.J Am Soc Nephrol. 2021 Sep;32(9):2388-2389. doi: 10.1681/ASN.2021060796. Epub 2021 Aug 16. J Am Soc Nephrol. 2021. PMID: 34403356 Free PMC article. No abstract available.
References
-
- Solez K, Axelsen RA, Benediktsson H, Burdick JF, Cohen AH, Colvin RB, et al.: International standardization of criteria for the histologic diagnosis of renal allograft rejection: The Banff working classification of kidney transplant pathology. Kidney Int 44: 411–422, 1993. - PubMed
-
- Haas M, Loupy A, Lefaucheur C, Roufosse C, Glotz D, Seron D, et al.: The Banff 2017 Kidney Meeting Report: Revised diagnostic criteria for chronic active T cell-mediated rejection, antibody-mediated rejection, and prospects for integrative endpoints for next-generation clinical trials. Am J Transplant 18: 293–307, 2018. - PMC - PubMed
-
- Racusen LC, Colvin RB, Solez K, Mihatsch MJ, Halloran PF, Campbell PM, et al.: Antibody-mediated rejection criteria - an addition to the Banff 97 classification of renal allograft rejection. Am J Transplant 3: 708–714, 2003. - PubMed
Publication types
MeSH terms
LinkOut - more resources
Full Text Sources
Other Literature Sources
Medical
Research Materials
Miscellaneous
