

Cell-Associated HIV-1 Unspliced-to-Multiply-Spliced RNA Ratio at 12 Weeks of ART Predicts Immune Reconstitution on Therapy
- PMID: 33688002
- PMCID: PMC8092199
- DOI: 10.1128/mBio.00099-21
Cell-Associated HIV-1 Unspliced-to-Multiply-Spliced RNA Ratio at 12 Weeks of ART Predicts Immune Reconstitution on Therapy
Abstract
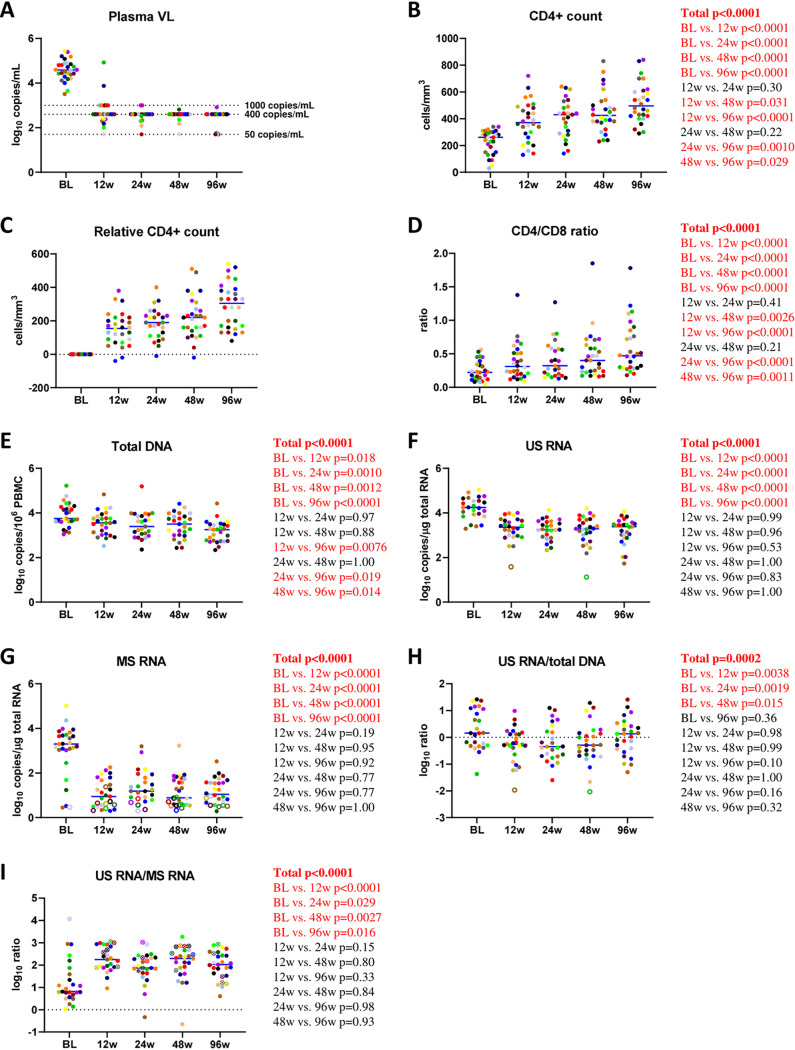
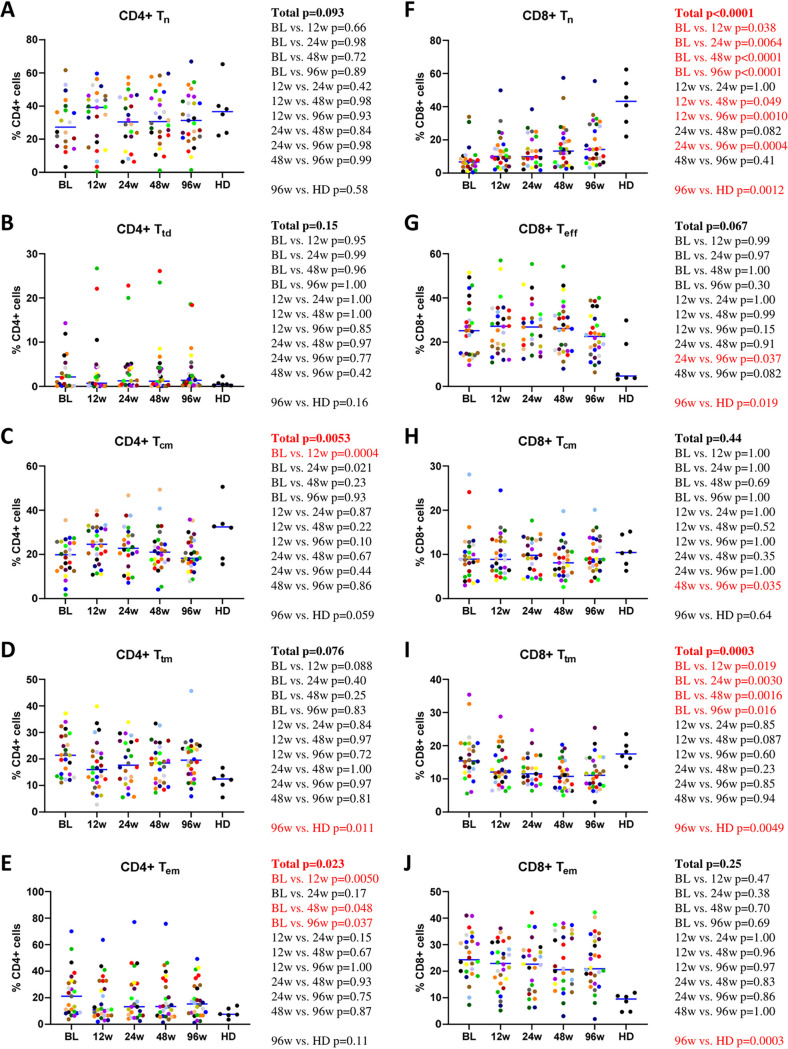
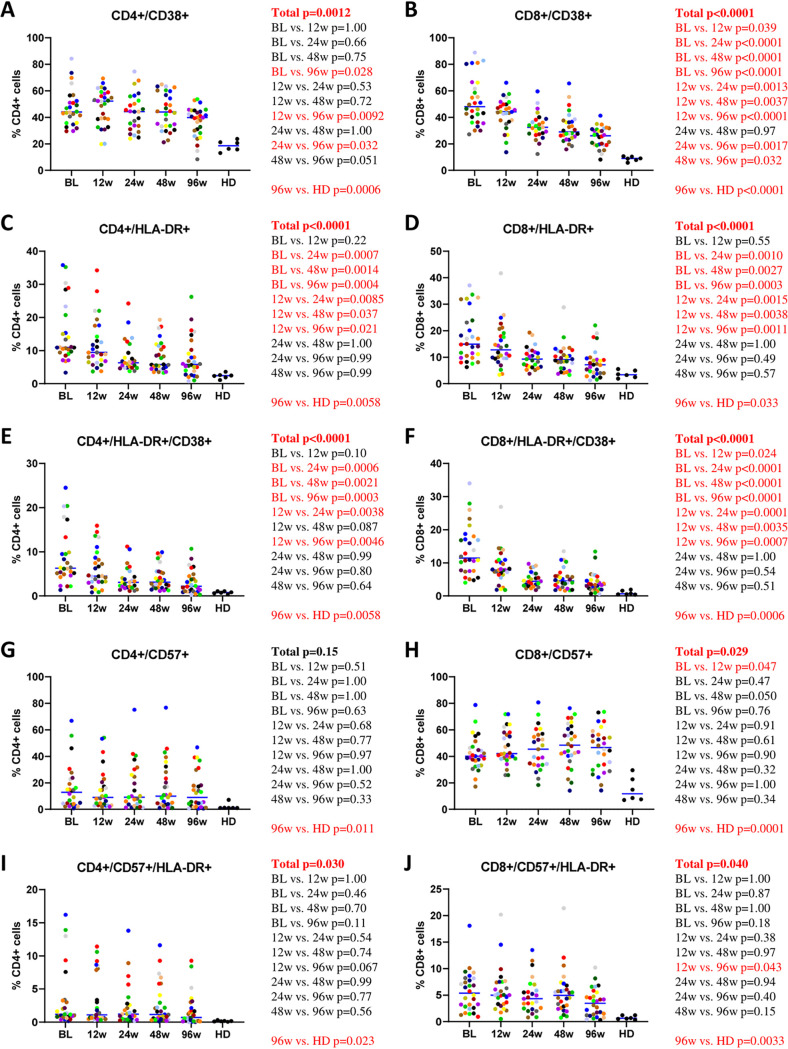
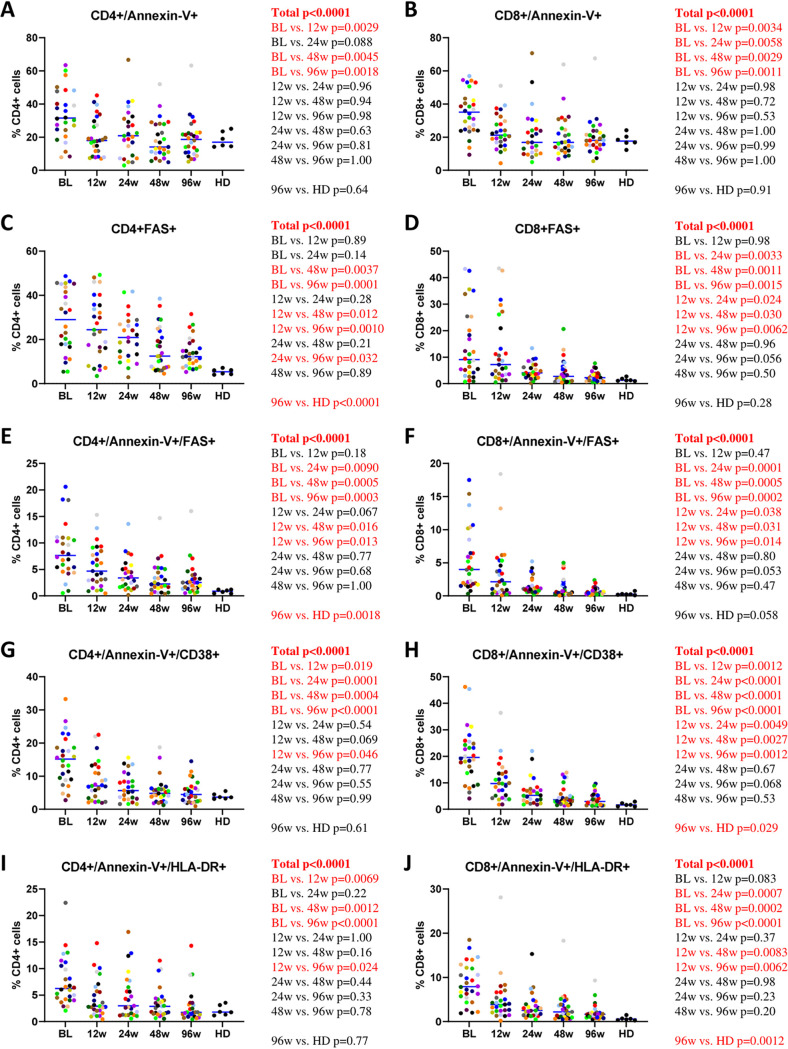
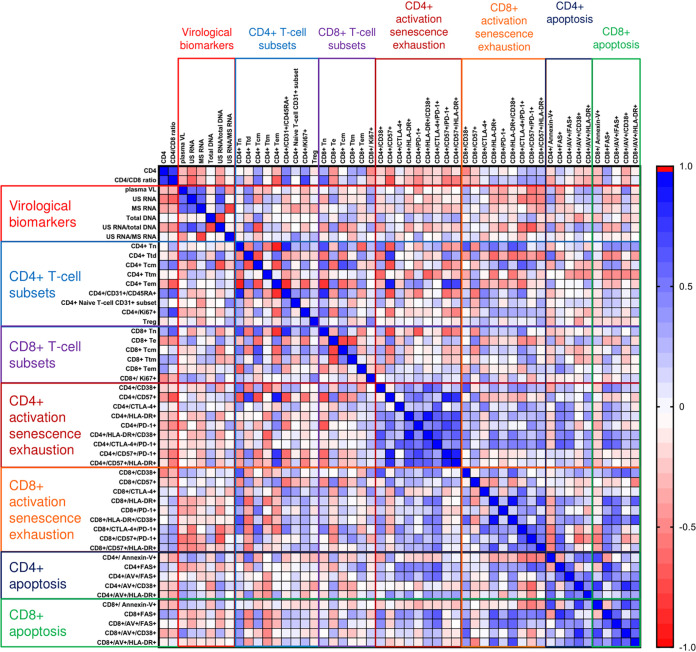
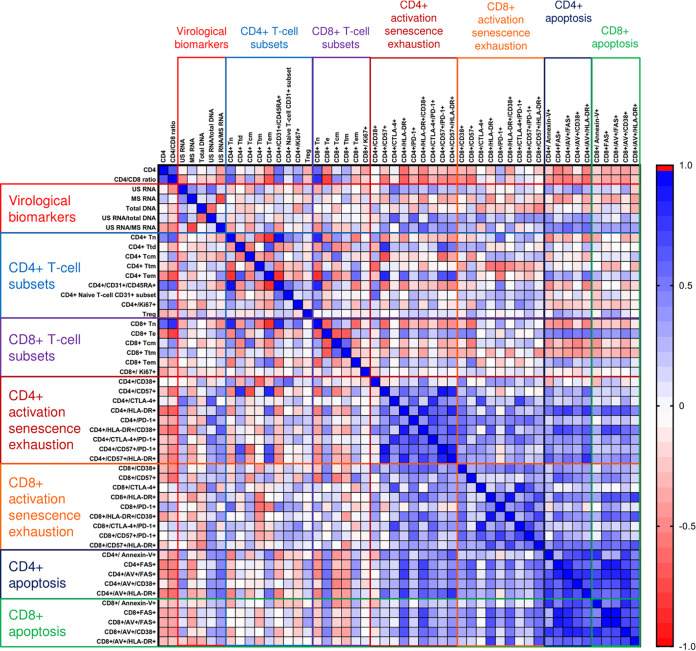
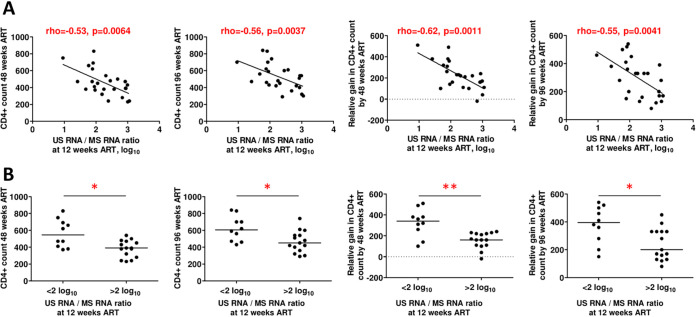
Incomplete restoration of CD4+ T-cell counts on antiretroviral therapy (ART) is a major predictor of HIV-related morbidity and mortality. To understand the possible mechanisms behind this poor immunological response despite viral suppression, we longitudinally measured more than 50 virological and immunological biomarkers in a cohort of HIV-infected individuals at several time points during the first 96 weeks of virologically suppressive ART. No baseline virological or immunological marker was predictive of the degree of immune reconstitution. However, the cell-associated HIV-1 unspliced-to-multiply-spliced (US/MS) RNA ratio at 12 weeks of ART positively correlated with markers of CD4+ T-cell activation and apoptosis and negatively predicted both the absolute and relative CD4+ T-cell counts at 48 and 96 weeks. A higher US/MS RNA ratio may reflect the higher frequency of productively infected cells that could exert pressure on the immune system, contributing to persistent immune activation and apoptosis and subsequently to a poor immunological response to ART.IMPORTANCE Human immunodeficiency virus (HIV) infection is currently managed by antiretroviral drugs, which block virus replication and promote immune restoration. However, the latter effect is not universal, with a proportion of infected individuals failing to sufficiently reconstitute their immune function despite a successful virological response to antiretroviral therapy (ART). No reliable predictive markers of immunological failure have been identified, and there is still no efficient therapeutic strategy, apart from ART itself, to facilitate immune reconstitution. Here, we measured more than 50 viral and host biomarkers at five time points during the first 2 years of ART and identified the cell-associated HIV-1 unspliced-to-multiply-spliced RNA ratio at 12 weeks of ART as a predictive factor for the immunological response to therapy. Moreover, the same marker positively correlated with markers of CD4+ T-cell activation and apoptosis. The fact that a virological biomarker performed better than any immunological biomarker in predicting an immunological outcome highlights the importance of considering the residual HIV activity on ART as a correlate and a possible cause of the residual immune dysfunction that frequently occurs despite virologically suppressive ART.
Keywords: AIDS; cell-associated RNA; human immunodeficiency virus; immune reconstitution; viral persistence; viral reservoirs.
Copyright © 2021 Scherpenisse et al.
Figures
Similar articles
-
Rapid CD4 decline prior to antiretroviral therapy predicts subsequent failure to reconstitute despite HIV viral suppression.J Infect Public Health. 2018 Mar-Apr;11(2):265-269. doi: 10.1016/j.jiph.2017.08.001. Epub 2017 Aug 18. J Infect Public Health. 2018. PMID: 28826735
-
Short Intracellular HIV-1 Transcripts as Biomarkers of Residual Immune Activation in Patients on Antiretroviral Therapy.J Virol. 2016 May 27;90(12):5665-5676. doi: 10.1128/JVI.03158-15. Print 2016 Jun 15. J Virol. 2016. PMID: 27030274 Free PMC article.
-
Naive T-cell depletion related to infection by X4 human immunodeficiency virus type 1 in poor immunological responders to highly active antiretroviral therapy.J Virol. 2006 Oct;80(20):10229-36. doi: 10.1128/JVI.00965-06. J Virol. 2006. PMID: 17005700 Free PMC article.
-
Study of the impact of HIV genotypic drug resistance testing on therapy efficacy.Verh K Acad Geneeskd Belg. 2001;63(5):447-73. Verh K Acad Geneeskd Belg. 2001. PMID: 11813503 Review.
-
How to properly define immunological nonresponse to antiretroviral therapy in people living with HIV? an integrative review.Front Immunol. 2025 Apr 7;16:1535565. doi: 10.3389/fimmu.2025.1535565. eCollection 2025. Front Immunol. 2025. PMID: 40260259 Free PMC article. Review.
Cited by
-
From network biology to immunity: potential longitudinal biomarkers for targeting the network topology of the HIV reservoir.J Transl Med. 2025 Aug 13;23(1):906. doi: 10.1186/s12967-025-06919-z. J Transl Med. 2025. PMID: 40804634 Free PMC article. Review.
-
Mechanisms of HIV-immunologic non-responses and research trends based on gut microbiota.Front Immunol. 2024 Dec 26;15:1378431. doi: 10.3389/fimmu.2024.1378431. eCollection 2024. Front Immunol. 2024. PMID: 39802299 Free PMC article. Review.
-
The Persistence of HIV Diversity, Transcription, and Nef Protein in Kaposi's Sarcoma Tumors during Antiretroviral Therapy.Viruses. 2022 Dec 13;14(12):2774. doi: 10.3390/v14122774. Viruses. 2022. PMID: 36560778 Free PMC article.
-
The influence of extrinsic apoptosis gene expression on immunological reconstitution of male ART-treated PLHIV.BMC Infect Dis. 2025 Mar 18;25(1):377. doi: 10.1186/s12879-025-10665-4. BMC Infect Dis. 2025. PMID: 40102787 Free PMC article.
-
Long-term effect of temporary ART initiated during primary HIV-1 infection on viral persistence.Nat Commun. 2025 Jul 30;16(1):6989. doi: 10.1038/s41467-025-62362-0. Nat Commun. 2025. PMID: 40738892 Free PMC article. Clinical Trial.
References
-
- Deeks SG, Lewin SR, Ross AL, Ananworanich J, Benkirane M, Cannon P, Chomont N, Douek D, Lifson JD, Lo Y-R, Kuritzkes D, Margolis D, Mellors J, Persaud D, Tucker JD, Barre-Sinoussi F, International AIDS Society Towards a Cure Working Group, Alter G, Auerbach J, Autran B, Barouch DH, Behrens G, Cavazzana M, Chen Z, Cohen É, Corbelli GM, Eholié S, Eyal N, Fidler S, Garcia L, Grossman C, Henderson G, Henrich TJ, Jefferys R, Kiem H-P, McCune J, Moodley K, Newman PA, Nijhuis M, Nsubuga MS, Ott M, Palmer S, Richman D, Saez-Cirion A, Sharp M, Siliciano J, Silvestri G, Singh J, Spire B, Taylor J, Tolstrup M, et al.. 2016. International AIDS Society global scientific strategy: towards an HIV cure 2016. Nat Med 22:839–850. doi:10.1038/nm.4108. - DOI - PMC - PubMed
-
- Florence E, Lundgren J, Dreezen C, Fisher M, Kirk O, Blaxhult A, Panos G, Katlama C, Vella S, Phillips A, for the EuroSIDA Study Group. 2003. Factors associated with a reduced CD4 lymphocyte count response to HAART despite full viral suppression in the EuroSIDA study. HIV Med 4:255–262. doi:10.1046/j.1468-1293.2003.00156.x. - DOI - PubMed
-
- Kaufmann GR, Furrer H, Ledergerber B, Perrin L, Opravil M, Vernazza P, Cavassini M, Bernasconi E, Rickenbach M, Hirschel B, Battegay M, Swiss HIV Cohort Study. 2005. Characteristics, determinants, and clinical relevance of CD4 T cell recovery to <500 cells/microL in HIV type 1-infected individuals receiving potent antiretroviral therapy. Clin Infect Dis 41:361–372. doi:10.1086/431484. - DOI - PubMed
-
- Kaufmann GR, Perrin L, Pantaleo G, Opravil M, Furrer H, Telenti A, Hirschel B, Ledergerber B, Vernazza P, Bernasconi E, Rickenbach M, Egger M, Battegay M, Swiss HIV Cohort Study. 2003. CD4 T-lymphocyte recovery in individuals with advanced HIV-1 infection receiving potent antiretroviral therapy for 4 years: the Swiss HIV Cohort Study. Arch Intern Med 163:2187–2195. doi:10.1001/archinte.163.18.2187. - DOI - PubMed
-
- Kelley CF, Kitchen CM, Hunt PW, Rodriguez B, Hecht FM, Kitahata M, Crane HM, Willig J, Mugavero M, Saag M, Martin JN, Deeks SG. 2009. Incomplete peripheral CD4+ cell count restoration in HIV-infected patients receiving long-term antiretroviral treatment. Clin Infect Dis 48:787–794. doi:10.1086/597093. - DOI - PMC - PubMed
Publication types
MeSH terms
Substances
LinkOut - more resources
Full Text Sources
Other Literature Sources
Medical
Research Materials
