. 2021 Mar 23;118(12):e2026153118.
doi: 10.1073/pnas.2026153118.

A safe and highly efficacious measles virus-based vaccine expressing SARS-CoV-2 stabilized prefusion spike

Affiliations

A safe and highly efficacious measles virus-based vaccine expressing SARS-CoV-2 stabilized prefusion spike

Mijia Lu et al. Proc Natl Acad Sci U S A. .

Abstract

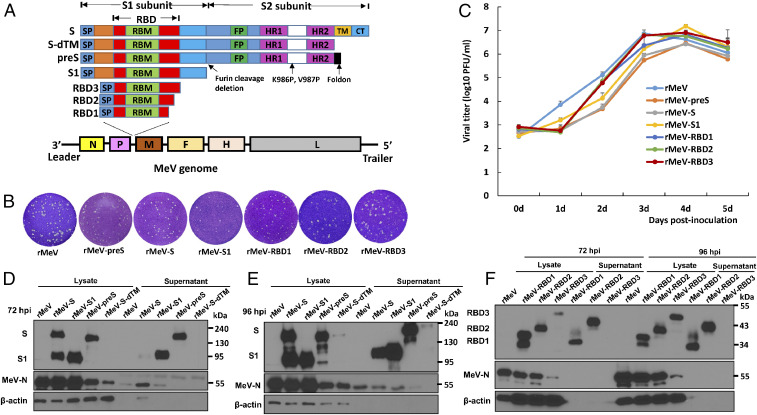
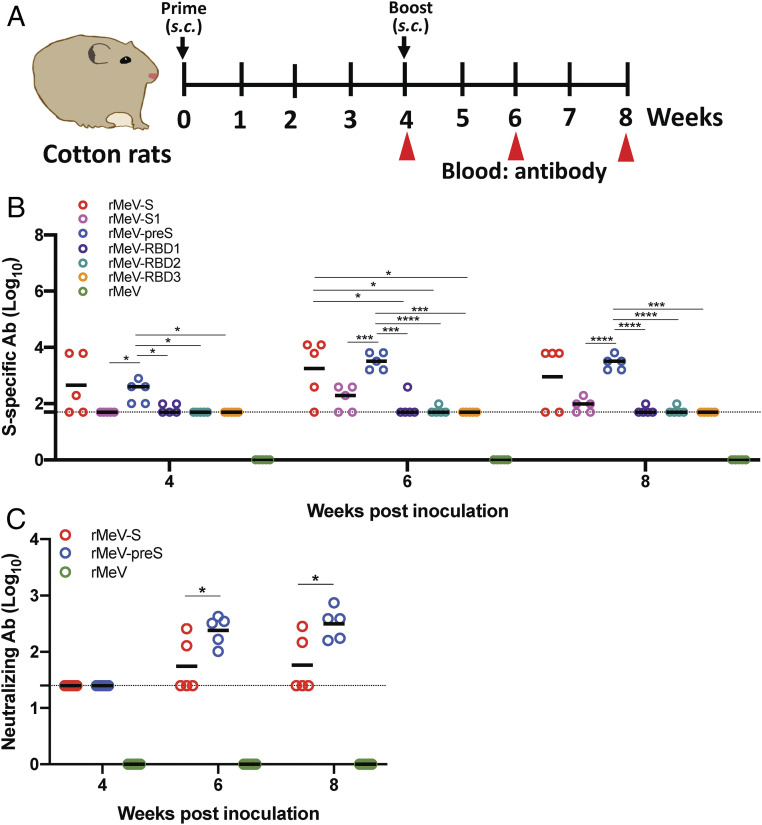
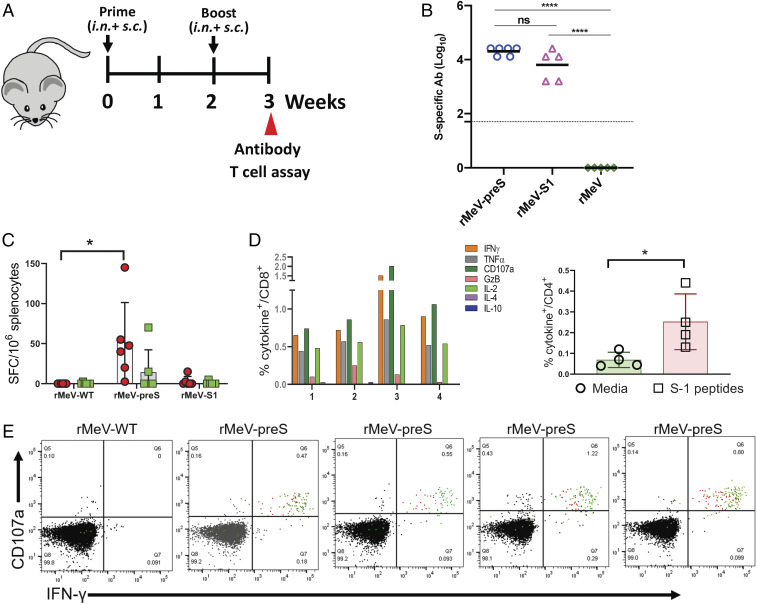
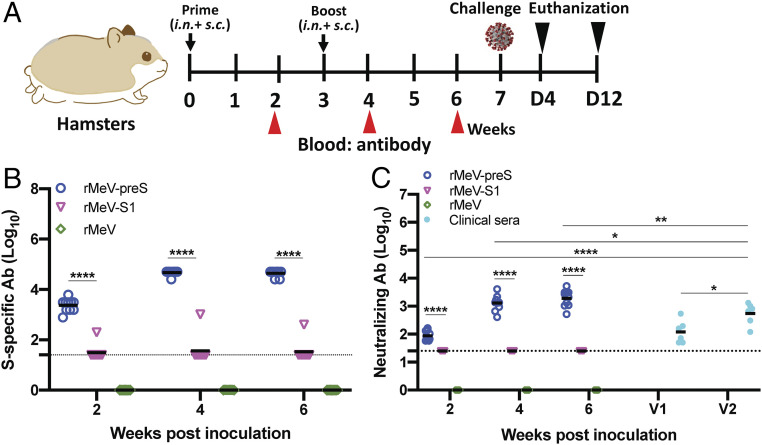
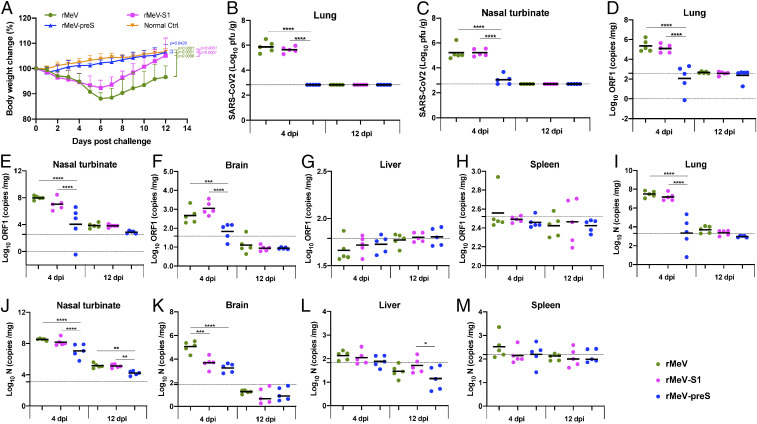
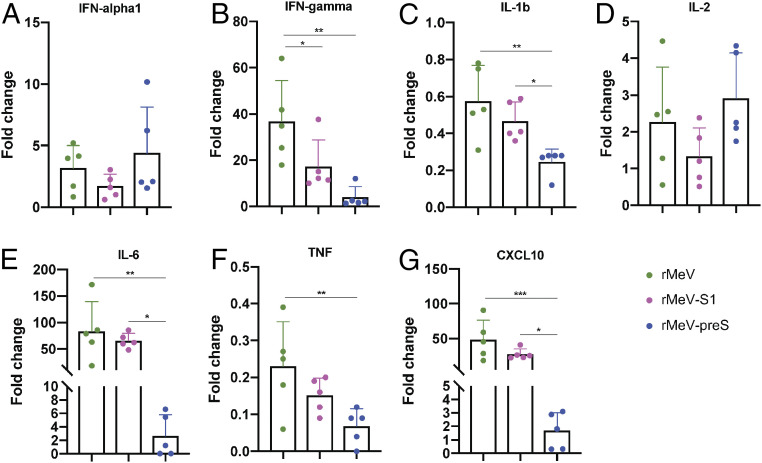
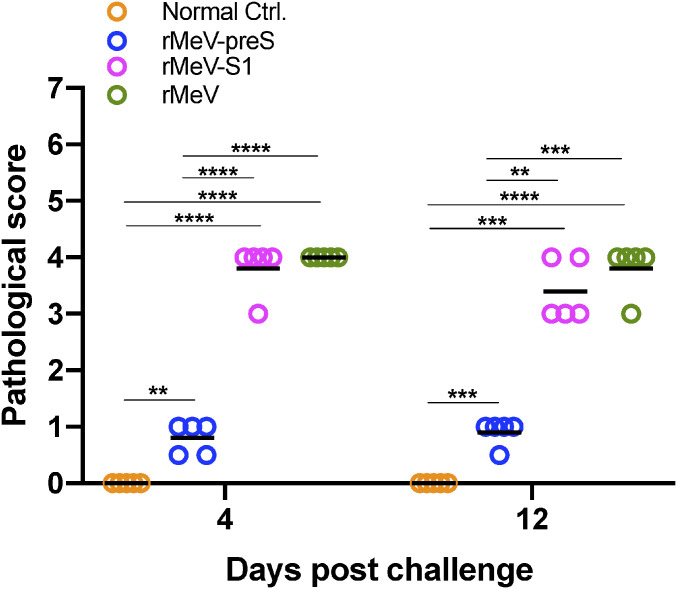
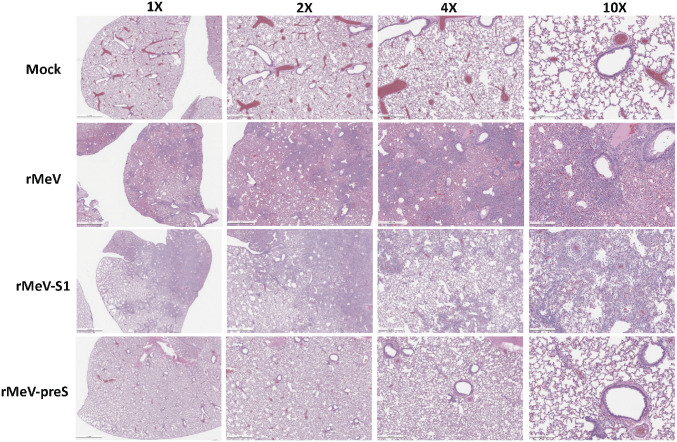
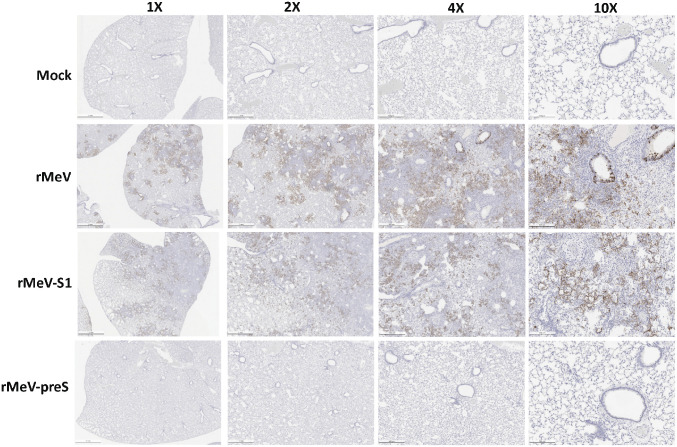
The current pandemic of COVID-19 caused by severe acute respiratory syndrome coronavirus 2 (SARS-CoV-2) highlights an urgent need to develop a safe, efficacious, and durable vaccine. Using a measles virus (rMeV) vaccine strain as the backbone, we developed a series of recombinant attenuated vaccine candidates expressing various forms of the SARS-CoV-2 spike (S) protein and its receptor binding domain (RBD) and evaluated their efficacy in cotton rat, IFNAR-/-mice, IFNAR-/--hCD46 mice, and golden Syrian hamsters. We found that rMeV expressing stabilized prefusion S protein (rMeV-preS) was more potent in inducing SARS-CoV-2-specific neutralizing antibodies than rMeV expressing full-length S protein (rMeV-S), while the rMeVs expressing different lengths of RBD (rMeV-RBD) were the least potent. Animals immunized with rMeV-preS produced higher levels of neutralizing antibody than found in convalescent sera from COVID-19 patients and a strong Th1-biased T cell response. The rMeV-preS also provided complete protection of hamsters from challenge with SARS-CoV-2, preventing replication in lungs and nasal turbinates, body weight loss, cytokine storm, and lung pathology. These data demonstrate that rMeV-preS is a safe and highly efficacious vaccine candidate, supporting its further development as a SARS-CoV-2 vaccine.

Keywords: SARS-CoV-2 vaccine; measles virus vector; prefusion spike.


Conflict of interest statement

Competing interest statement: The Ohio State University has filed an invention report for the measles virus-based SARS-CoV-2 vaccine platform.

Figures

Fig. 1.
Fig. 1.
Recovery and characterization of rMeV expressing SARS-CoV-2 S proteins. (A) Strategy for insertion of SARS-CoV-2 S and its variants to MeV genome. The codon optimized full-length S, preS, S-dTM, S1, RBD1, RBD2, and RBD3 were amplified by PCR and inserted into the same position at the gene junction between P and M in the genome of the MeV Edmonston vaccine strain. The domain structure of S protein is shown: SP, signal peptide; RBD, receptor-binding domain; RBM, receptor-binding motif; FP, fusion peptide; HR, heptad repeat; CH, central helix; TM, transmembrane domain; CT, cytoplasmic tail. The organization of negative-sense MeV genome is shown. Le, leader sequence; N, nucleocapsid gene; P, phosphoprotein gene; M, matrix protein gene; F, fusion protein gene; H, hemagglutinin protein gene; L, large polymerase gene; Tr, trailer sequence. (B) The plaque morphology of rMeV expressing SARS-CoV-2 S antigens. All plaques were developed after 5 d of incubation in Vero CCL-81 cells. (C) Multistep growth curve. Confluent Vero CCL81 cells in 12-well plates were infected with each virus at an MOI of 0.01. After 1 h of absorption, fresh DMEM with 2% fetal bovine serum was added. The cell culture supernatants and cell lysates were harvested and combined, and virus titers were determined by plaque assay. Data are geometric mean titers (GMT) ± SD from n = 3 biologically independent experiments. (D and E) Analysis of SARS-CoV-2 S and S1 protein expression in cell lysate and supernatants by Western blot. Vero CCL81 cells in 12-well plates were infected with each recombinant virus at an MOI of 0.01. At 72 h (D) or 96 h (E) postinfection, cells were lysed in 300 μL of lysis buffer, and 10 μL of lysate or supernatant was analyzed by sodium dodecyl sulfate polyacrylamide gel electrophoresis and blotted with anti–SARS-CoV-2 S protein antibody (Top), MeV N antibody (Middle), or β-actin antibody (Bottom). (F) Analysis of RBD protein expression by Western blot. Ten microliters of lysate or supernatant at 72 and 96 h postinfection was analyzed. Western blots shown are the representatives of three independent experiments.
Fig. 2.
Fig. 2.
Immunogenicity of rMeVs expressing SARS-CoV-2 antigens in cotton rats. (A) Immunization schedule in cotton rats. Cotton rats (n = 5) were inoculated subcutaneously with phosphate-buffered saline or 4 × 10⁵ PFU of each of the rMeV-based vaccine candidate. Four weeks later, cotton rats were boosted with 106 PFU of each virus. Serum samples were collected at weeks 4, 6, and 8 for antibody detection. (B) Measurement of SARS-CoV-2 S-specific antibody by ELISA. Highly purified preS protein was used as the coating antigen for the ELISA. Dotted line indicates the detectable level at the lowest dilution. (C) Measurement of SARS-CoV-2–specific neutralizing antibody. Antibody titer was determined by a plaque reduction neutralization assay. Dotted line indicates the detectable level at the lowest dilution. Data are expressed as the geometric mean titers (GMT) of five cotton rats ± SD. Data were analyzed using two-way ANOVA (*P < 0.05; ***P < 0.001; ****P < 0.0001).
Fig. 3.
Fig. 3.
rMeV-preS is highly immunogenic in IFNAR−/−-hCD46 mice and induces strong Th1-biased T cell immune responses. (A) Immunization schedule. IFNAR−/−-hCD46 mice (n = 5 or 6) were inoculated with 8 × 10⁵ PFU of rMeV, rMeV-preS, or rMeV-S1. Two weeks later, mice were boosted with 6 × 10⁵ PFU of each virus. Half the dose was delivered subcutaneously and the other half was delivered intranasally. Serum samples were collected at week 3 for antibody detection. Mice were killed at week 3 for the T cell assays. (B) Measurement of SARS-CoV-2 S-specific antibody by ELISA. Highly purified preS protein was used as the coating antigen for ELISA. Dotted line indicates the detectable level at the lowest dilution. Data were analyzed using one-way ANOVA (****P < 0.0001; ns indicates no significant difference; P > 0.05). (C) ELISpot quantification of IFN-γ–producing T cells. Spot forming cells (SFC) were quantified after the cells were stimulated by peptides representing N (S1 peptides, red) and C (S2 peptides, green) termini of SARS-CoV-2 spike protein. Data are means of five mice ± SD. *P < 0.05 as determined by unpaired t test. (D) Cytokine expression in CD8+ and CD4+ splenocytes. Splenocytes of four rMeV-preS–vaccinated mice with highest SFC were stimulated ex vivo for 5 h with pools of S1 peptides representing the N-terminal of SARS-CoV-2 S protein (5 μg/mL each) in an intracellular cytokine staining assay. Frequencies of CD4+ T cells expressing cytokines represent CD4+ T cells expressing IFN-γ, TNF-α, or IL-2. *P < 0.05 as determined by Student's t test. (E) Flow plots of cytokine production. Antigen-stimulated CD8+ T cells in one rMeV vector-immunized and four rMeV-preS–immunized mice. CD8+ T cells expressing CD107a and IFN-γ are shown as red dots and cells also expressing TNF-α are shown as green dots.
Fig. 4.
Fig. 4.
rMeV-preS is highly immunogenic in golden Syrian hamsters. (A) Immunization schedule in hamsters. Four-week-old female golden Syrian hamsters (n = 10) were immunized with 8 × 10⁵ PFU (half subcutaneous and half intranasal) of rMeV-preS, rMeV-S1, parental rMeV, or phosphate-buffered saline. Hamsters were boosted 3 wk later. At weeks 2, 4, and 6, sera were collected for antibody detection. At week 7, hamsters were challenged with 105 PFU of SARS-CoV-2. Unimmunized, unchallenged controls were inoculated with DMEM. (B) Measurement of SARS-CoV-2 S-specific antibody. Highly purified preS protein was used as coating antigen for ELISA. Dotted line indicates the detectable level at the lowest dilution. (C) Measurement of SARS-CoV-2–specific neutralizing antibody. Antibody titer was determined by a plaque reduction neutralization assay. Human convalescent sera from acute infection (V1) and recovered COVID-19 patients (V2) were used as side-by-side controls. Data are expressed as the geometric mean titers (GMT) of 10 hamsters. Dotted line indicates the detectable level at the lowest dilution. Data were analyzed using two-way ANOVA (*P < 0.05; **P < 0.01; ****P < 0.0001).
Fig. 5.
Fig. 5.
rMeV-preS provides complete protection against SARS-CoV-2 challenge in golden Syrian hamsters. (A) Dynamics of hamster body weight changes after SARS-CoV-2 challenge. The body weight for each hamster was measured daily and expressed as percentage of body weight at the challenge day. From days 0 to 4, the average body weight of 10 hamsters (n = 10) in each group is shown. From days 5 to 12, the average body weight of five hamsters (n = 5) in each group is shown. SARS-CoV-2 titer in lungs (B) and nasal turbinate (C). At day 4 after challenge, five hamsters from each group were killed and lungs and nasal turbinates were collected for virus titration by plaque assay. At day 12, the remaining five hamsters in each group were killed. Viral titers are the geometric mean titer (GMT) of five animals ± SD. The limit of detection (LoD) is 2.7∼2.8 Log10 PFU per gram of tissue (dotted line). SARS-CoV-2 genome RNA copies in lungs (D), nasal turbinate (E), brain (F), liver (G), and spleen (H). Total RNA was extracted from the homogenized tissue using TRIzol reagent. SARS-CoV-2 genome copies were quantified by real-time RT-PCR using primers annealing to the 5′ end of the genome. SARS-CoV-2 subgenomic RNA copies in lungs (I), nasal turbinate (J), brain (K), liver (L), and spleen (M). SARS-CoV-2 subgenomic RNA copies were quantified by real-time RT-PCR using primers annealing to the N gene at the 3′ end of the genome. Black bars are shown as GMT of five hamsters in each group. Dotted line indicates the detection limit. Data were analyzed using two-way (A) or one-way (BM) ANOVA (*P < 0.05; **P < 0.01; ***P < 0.001; ****P < 0.0001).
Fig. 6.
Fig. 6.
rMeV-preS immunization prevents a cytokine storm in the lungs. Total RNA was extracted from lungs of hamsters killed at day 4 after challenge with SARS-CoV-2. Hamster IFN-α1 (A), IFN-γ (B), IL-1b (C), IL-2 (D), IL-6 (E), TNF (F), and CXCL10 (G) mRNAs were quantified by real-time RT-PCR. GAPDH mRNA was used as an internal control. Data are shown as fold change in gene expression compared to normal animals (unimmunized and unchallenged) after normalization. Data were analyzed using one-way ANOVA (*P < 0.05; **P < 0.01; ***P < 0.001).
Fig. 7.
Fig. 7.
Lung pathology score after challenge with SARS-CoV-2. Fixed lung tissues from days 4 and 12 after SARS-CoV-2 challenge were embedded in paraffin, sectioned at 5 µm, deparaffinized, rehydrated, and stained with hematoxylin/eosin for the examination of histological changes by light microscopy. Each slide was quantified based on the severity of histologic changes including inflammation, interstitial pneumonia, edema, alveolitis, bronchiolitis, alveolar destruction, mononuclear cell infiltration, pulmonary hemorrhage, and peribronchiolar inflammation. Score 4 = extremely severe lung pathological changes; score 3 = severe lung pathological changes; score 2 = moderate lung pathological changes; score 1 = mild lung pathological changes; score 0 = no pathological changes. Data were analyzed using two-way ANOVA (**P < 0.01; ***P < 0.001; ****P < 0.0001).
Fig. 8.
Fig. 8.
rMeV-preS immunization protects against lung pathology. Hematoxylin/eosin staining of lung tissue of hamsters killed at day 4 after SARS-CoV-2 challenge is shown. Micrographs with 1×, 2×, 4×, and 10× magnification of a representative lung section from each group are shown. Scale bars are indicated at the left corner of each image.
Fig. 9.
Fig. 9.
rMeV-preS immunization prevents SARS-CoV-2 antigen expression in lungs. IHC staining of lung sections from hamsters killed at day 4 after SARS-CoV-2 challenge is shown. Lung sections were stained with SARS-CoV-2 N antibody. Micrographs with 1×, 2×, 4×, and 10× magnification of a representative lung section from each group are shown. Scale bars are indicated at the left corner of each image.

Similar articles

Cited by

References

    1. Li Q., et al. ., Early transmission dynamics in Wuhan, China, of novel coronavirus-infected pneumonia. N. Engl. J. Med. 382, 1199–1207 (2020). - PMC - PubMed
    1. Huang C., et al. ., Clinical features of patients infected with 2019 novel coronavirus in Wuhan, China. Lancet 395, 497–506 (2020). - PMC - PubMed
    1. Zhu N.et al. .; China Novel Coronavirus Investigating and Research Team , A novel coronavirus from patients with pneumonia in China, 2019. N. Engl. J. Med. 382, 727–733 (2020). - PMC - PubMed
    1. Sharpe H. R., et al. ., The early landscape of coronavirus disease 2019 vaccine development in the UK and rest of the world. Immunology 160, 223–232 (2020). - PMC - PubMed
    1. Thanh Le T., et al. ., The COVID-19 vaccine development landscape. Nat. Rev. Drug Discov. 19, 305–306 (2020). - PubMed

Publication types

MeSH terms