. 2021 Apr 6;8(2):ENEURO.0403-20.2021.
doi: 10.1523/ENEURO.0403-20.2021. Print 2021 Mar-Apr.

Ketamine-Induced Alteration of Working Memory Utility during Oculomotor Foraging Task in Monkeys

Affiliations

Ketamine-Induced Alteration of Working Memory Utility during Oculomotor Foraging Task in Monkeys

Ryo Sawagashira et al. eNeuro. .

Abstract

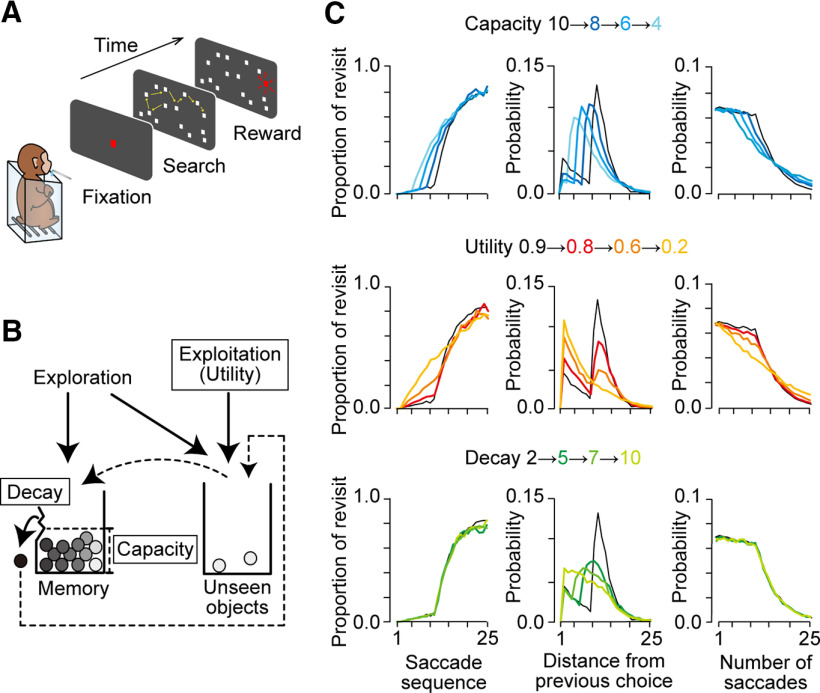
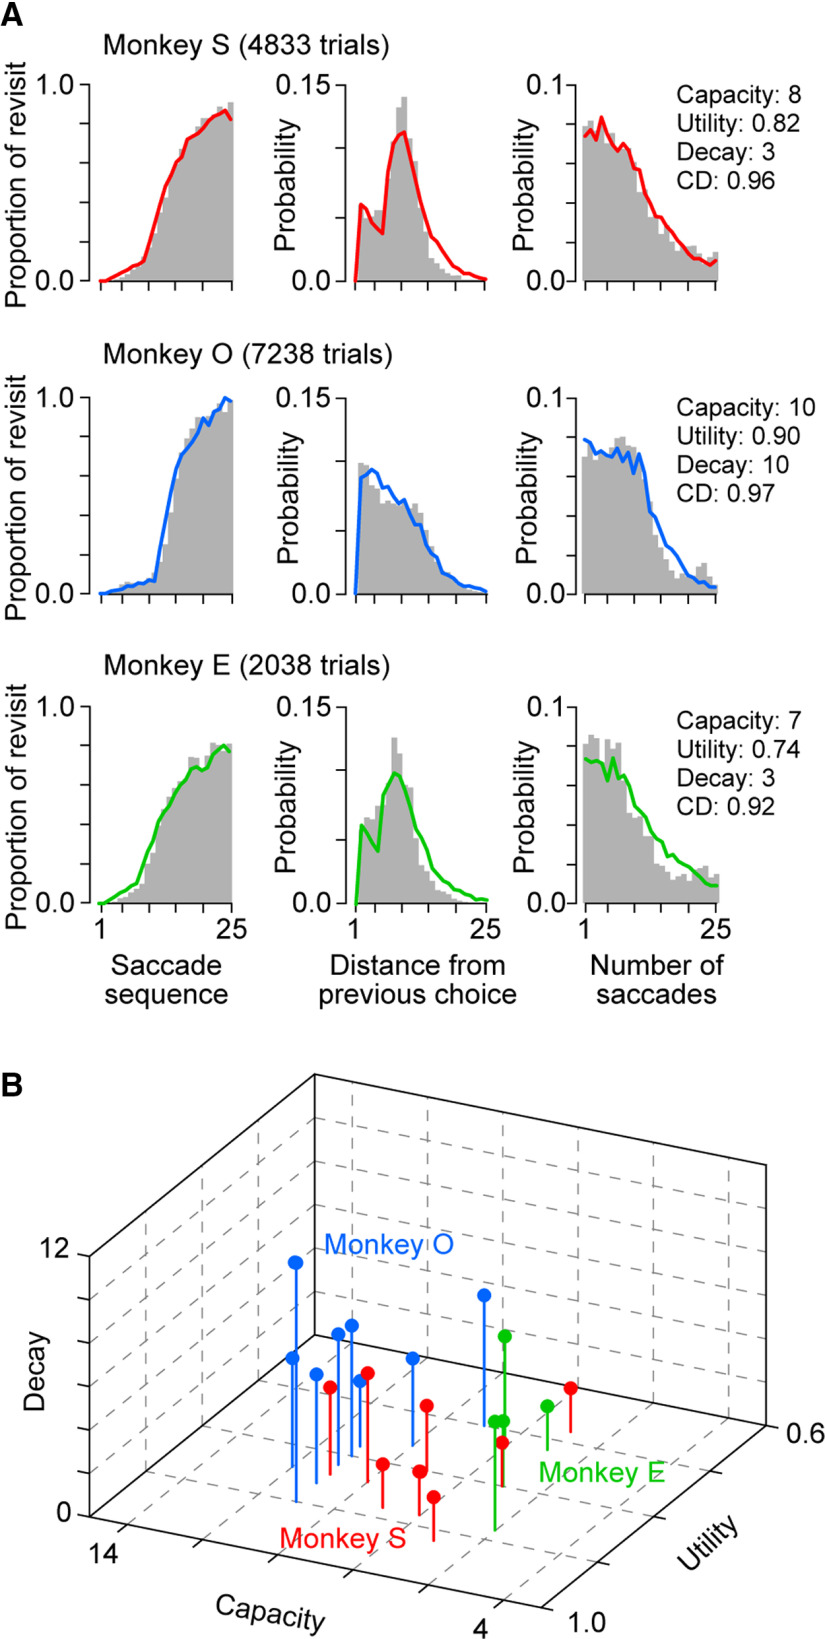
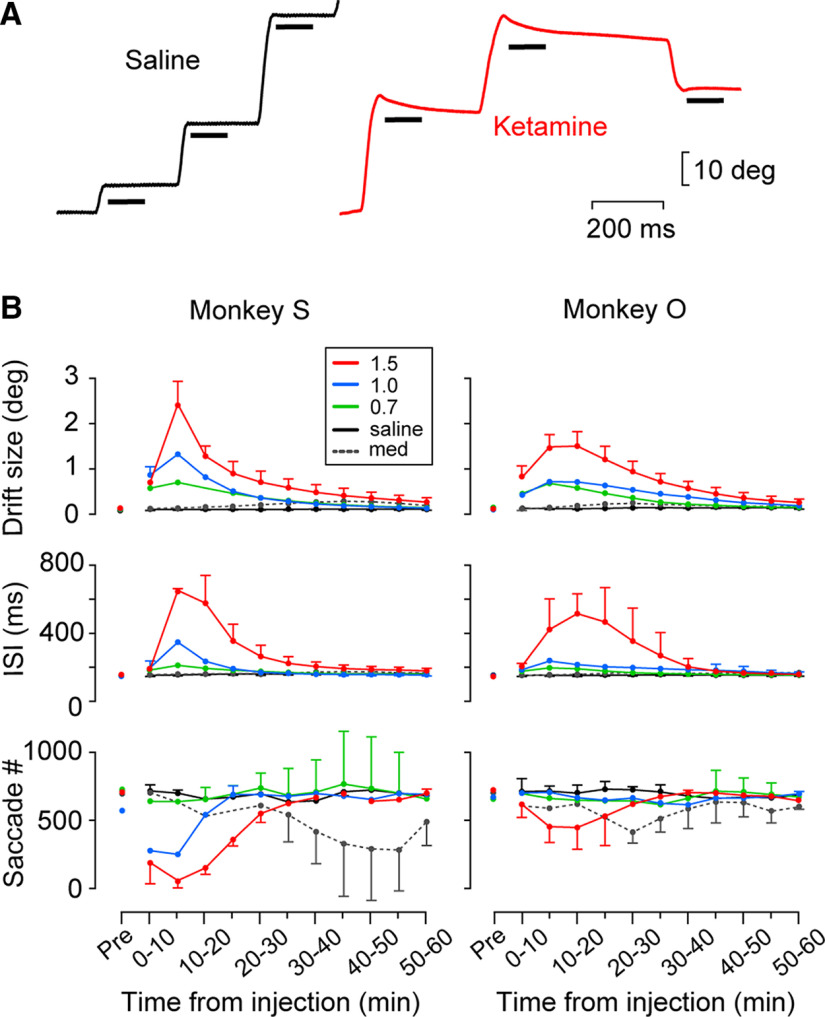
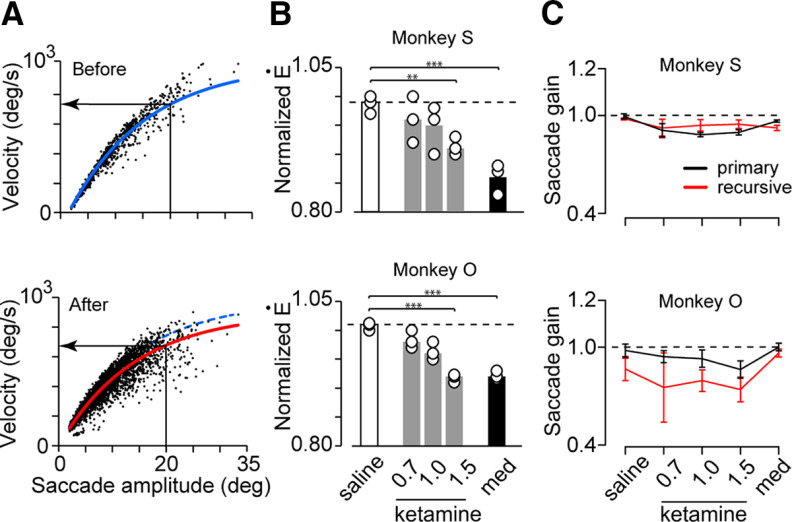
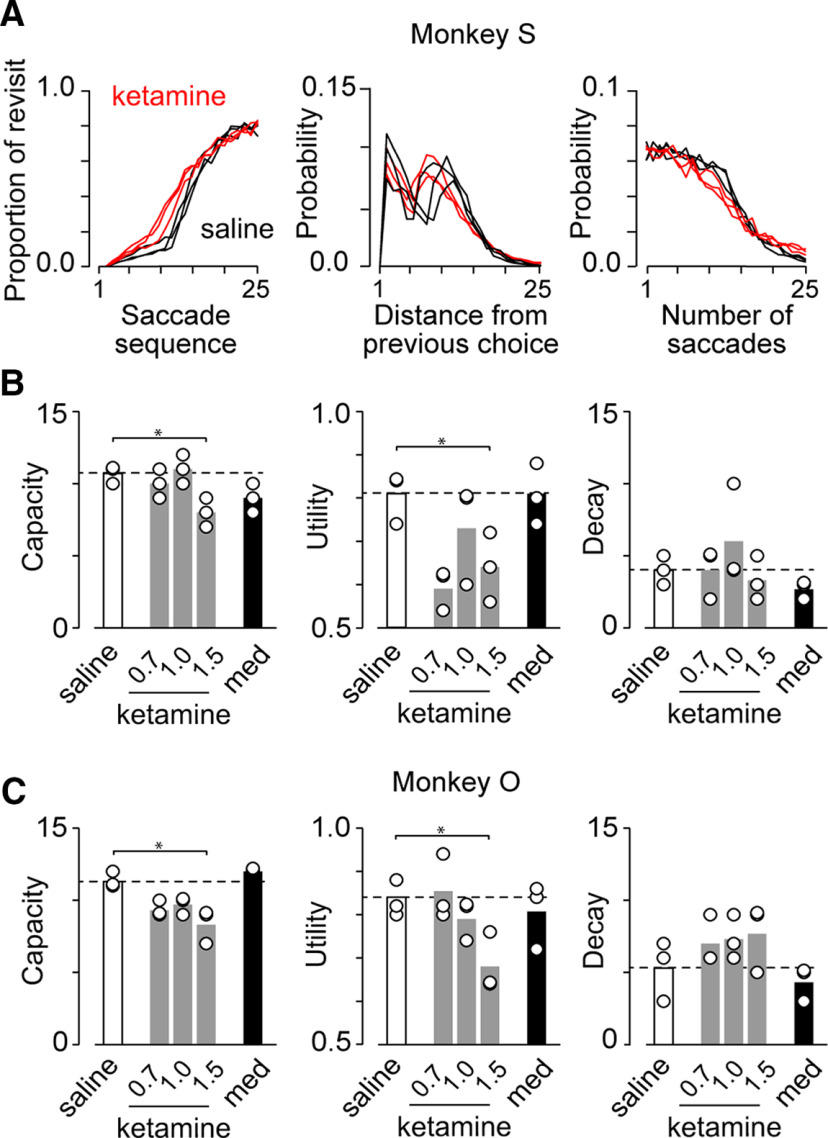
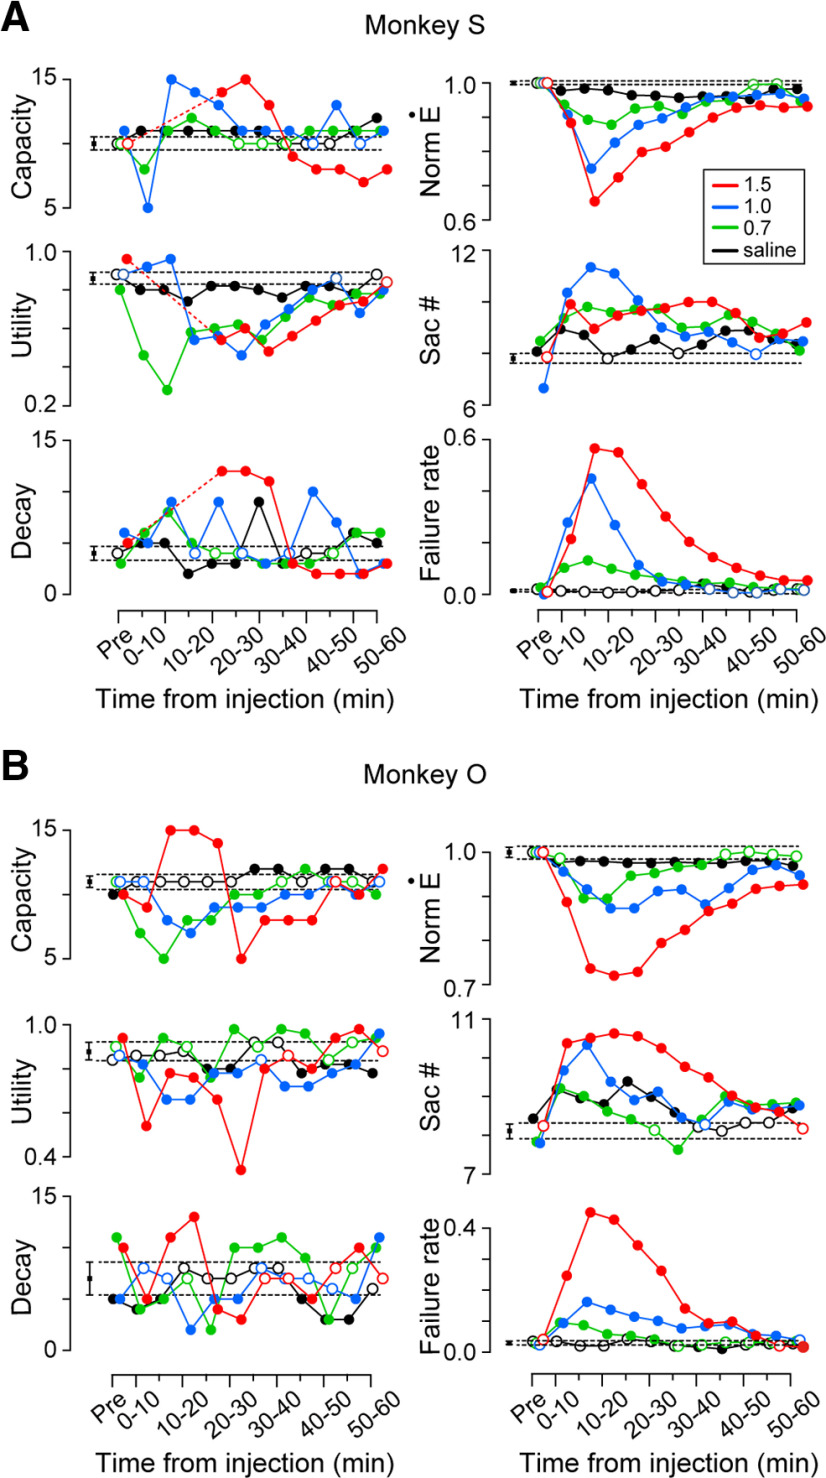
Impairments of working memory (WM) are commonly observed in a variety of neurodegenerative disorders but they are difficult to quantitatively assess in clinical cases. Recent studies in experimental animals have used low-dose ketamine (an NMDA receptor antagonist) to disrupt WM, partly mimicking the pathophysiology of schizophrenia. Here, we developed a novel behavioral paradigm to assess multiple components of WM and applied it to monkeys with and without ketamine administration. In an oculomotor foraging task, the animals were presented with 15 identical objects on the screen. One of the objects was associated with a liquid reward, and monkeys were trained to search for the target by generating sequential saccades under a time constraint. We assumed that the occurrence of recursive movements to the same object might reflect WM dysfunction. We constructed a "foraging model" that incorporated (1) memory capacity, (2) memory decay, and (3) utility rate; this model was able to explain more than 92% of the variations in behavioral data obtained from three monkeys. Following systemic administration of low dosages of ketamine, the memory capacity and utility rate were dramatically reduced by 15% and 57%, respectively, while memory decay remained largely unchanged. These results suggested that the behavioral deficits during the blockade of NMDA receptors were mostly due to the decreased usage of short-term memory. Our oculomotor paradigm and foraging model appear to be useful for quantifying multiple components of WM and could be applicable to clinical cases in future studies.

Keywords: NMDA receptor antagonist; central executive; exploratory behavior; nonhuman primate; recursive choice; visual search.


Figures

Figure 1.
Figure 1.
Behavioral task and the foraging model. A, The oculomotor foraging task. Monkeys were presented with 15 identical objects (white squares) on the screen after the initial fixation period. One of the objects was associated with a liquid reward, and animals obtained a reward when they looked at the target for 100 ms within 6 s. As monkeys found the target, it turns red and the trial was terminated. B, A schematic of the foraging model. Each circle represents a single object. During the visual search, the visited item was sequentially registered to the short-term memory and moved from the right box (unseen objects) to the left box (memory). When the number of items reached the memory capacity (12 items in this example), one item in the left box dropped off and moved back to the right box. The order of memory loss was defined by the memory decay and smaller number indicated better retention of short-term memory. In the exploration mode, the item was randomly chosen from 14 objects (except for the currently fixated object) with no reference to WM. Thus, the model was defined by three parameters: memory capacity, memory decay, and utility rate. C, Model prediction derived from Monte Carlo simulations. Each column plots the relationship between saccade sequence and proportion of revisiting behavior (left), relative frequency of revisiting behavior as a function of the number of intervening saccades (distance) from the previous choice (middle), and relative frequency of saccade number in each trial. Each row compares the predictions for different memory capacities (top), utility rates (middle row), and memory decays (bottom). In all panels, the black traces indicate the data obtained from the model with memory capacity of 10, utility rate of 0.9, and memory decay of 2.
Figure 2.
Figure 2.
Behavioral data and model fitting. A, Actual behavioral data (gray bars) were compared with the best-fit distributions obtained from the foraging model (colored lines). For each animal, data from multiple sessions were combined (nine, nine, and four sessions for monkeys S, O, and E, respectively). The CDs for the fit of each model were 0.96, 0.97, and 0.92 for monkeys S, O, and E, respectively. Note that when we evaluated the goodness-of-fit, each of the three distributions with 25 bins was normalized so that the area under the curve equaled unity. Three optimal parameters for each animal are reported in the right panel. B, Optimal parameters in individual sessions. Note that the data from each monkey separated by color are clustered.
Figure 3.
Figure 3.
Effects of ketamine administration on oculomotor parameters. A, Eye position traces from single trials after saline (black) or ketamine (1.5 mg/kg, red) injection in monkey S. The horizontal bar indicates the 100-ms interval for measuring postsaccadic drift. B, Time course of eye movement parameters (drift size, ISI, and saccade number in every 10 min) following intramuscular injection of saline or drugs (0.7, 1.0, and 1.5 mg/kg ketamine and 0.01 mg/kg medetomidine). Data for the same experimental condition (three sessions) are connected with lines. Different colors indicate different drug conditions. The error bar indicates 1 SD and is only displayed for the maximal or minimal values of each time window.
Figure 4.
Figure 4.
Effects of ketamine administration on saccade velocity and amplitude. A, Relationships between saccade amplitude and peak velocity (main sequence) before (top panel) and 60 min following ketamine administration (1.5 mg/kg, bottom) in monkey S. Blue and red solid lines show the best-fit exponential curves (least squares) for the preinjection and postinjection data, respectively. The blue dashed curve in the bottom panel duplicates the one in the top panel for comparison. The leftward arrow indicates the estimated peak velocity for the 20° saccade. B, Peak velocity following intramuscular injection of saline or drugs (0.7, 1.0, and 1.5 mg/kg ketamine and 0.01 mg/kg medetomidine) normalized for the preinjection data. The circles indicate individual experiments and bars denote the means of three sessions; **p <0.01, ***p <10−3 for multiple comparisons (Dunnett’s tests compared with saline). C, Gains of primary (black) and recursive (red) saccades. Error bar indicates 1 SD for sessions.
Figure 5.
Figure 5.
Effects of ketamine administration on model parameters. A, Comparison of the best-fit data following saline (black traces) and ketamine (1.5 mg/kg, red traces) injection in monkey S. B, C, Three parameters were derived from the foraging model for different drug conditions. Data were collected 60 min after injection. The conventions are the same as those in Figure 4B.
Figure 6.
Figure 6.
Time courses of foraging model parameters (left column) and eye movement parameters (right) following ketamine administration in monkeys S (A) and O (B). Data points connected with lines indicate single experimental conditions (data from three sessions). Different colors indicate different drug conditions. The left side black square indicates the preinjection data for all conditions (12 sessions). The error bars and horizontal dashed lines indicate the 95% confidence interval of the bootstrap data. Filled circles denote statistically significant modulations compared with the preinjection data. Data points for different drug conditions are slightly jittered horizontally for presentation purposes only.

Similar articles

Cited by

References

    1. Aigner TG, Walker DL, Mishkin M (1991) Comparison of the effects of scopolamine administered before and after acquisition in a test of visual recognition memory in monkeys. Behav Neural Biol 55:61–67. 10.1016/0163-1047(91)80127-Z - DOI - PubMed
    1. Aks DJ, Zelinsky GJ, Sprott JC (2002) Memory across eye-movements: 1/f dynamic in visual search. Nonlinear Dynamics Psychol Life Sci 6:1–25. 10.1023/A:1012222601935 - DOI
    1. Arani T, Karwan MH, Drury CG (1984) A variable-memory model of visual search. Hum Factors 26:631–639. 10.1177/001872088402600602 - DOI - PubMed
    1. Baddeley AD, Hitch G (1974) Working memory. Psychol Learn Motiv 8:47–89.
    1. Baddeley A, Della Sala S (1996) Working memory and executive control. Philos Trans R Soc Lond B Biol Sci 351:1397–1403. 10.1098/rstb.1996.0123 - DOI - PubMed

Publication types

LinkOut - more resources